Football analytics is still a very young field of research. While it may seem as though there are new people hired or promoted in the space every day — including former PFF R&D interns Mehmet Erden (Denver Broncos) and Zach Drapkin (Philadelphia Eagles) — there is still so much left to be understood and so many more questions to be unearthed and evolved.
This is why I (Eric) am so excited to reveal what Arjun Menon, Haley English and Judah Fortgang have been working on so far this summer, as it is a true team effort toward trying to understand the game better.
PFF's George Chahrouri and I (Eric) published a seminal piece of work back in 2019, documenting how PFF coverage grades were not only more explanatory of wins in-season but were also more predictive at the team level than pass-rushing grades. This gave rise to a shift in how we understood the league and various teams within it, as well as more and more work trying to poke holes in the insights derived from that 2019 offseason.
- Coverage versus pass rush revisited
- Coverage versus pass rush: Part III
- Coverage versus pass rush: College football
- How Fragile is defense? The effect of stars versus depth on game outcomes
One reasonable objection raised against our work on coverage versus pass rush is that, unlike pass rushing, PFF's coverage data is very (but not exclusively) target driven. Thus, in trying to understand “process” versus “results,” one could argue that pass-rushing data is more process driven and that the metrics are much, much more stable for pass-rushers than for coverage players. This is knocked down a peg when coverage at the team level is better predictively as well as explanatory, but it's reasonable enough to explore deeper.
Thus, we at PFF started an “all coverage” process in 2019, which is analogous to the quarterback charting data you can find in our QB Annual. Think: “what PFF has always done, but deeper.” We’re giving each and every coverage player a grade from -2 to 1 in increments of 0.25, along with grainier designations for assignment, alignment and technique.
In this article, we’re going to first look at “perfectly covered plays,” an analog of perfectly blocked runs and passes, which were studied here. Seeing as coverage, like offensive line play, is a weak-link system, it makes sense to look at plays where there are one or more negatively graded players. The resulting data is rich.
What is a perfectly covered play?
A perfectly covered play is one in which each coverage player receives either a positive or neutral PFF coverage grade. Coverage is a weak-link system, which means that even if only one player botches their assignment as the “weak link,” the probability of offensive success drastically increases. In essence, our definition of perfect coverage tries to capture whether any covering player on a play “messed up” or whether they played to expectation and made life difficult for the opposing offense.
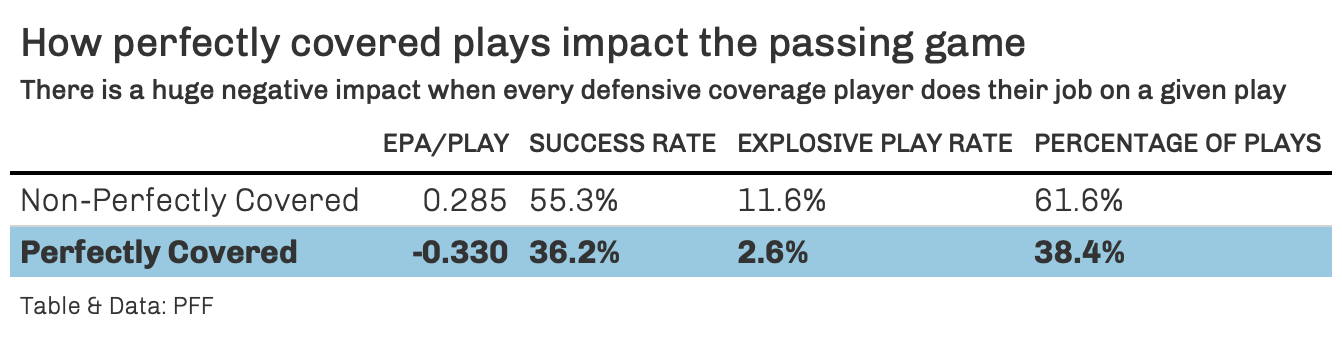
To try and measure the effects of a perfectly covered play in the passing game, we looked at important metrics that pertain to offensive success. We measured the difference in expected points added (EPA) per play, the change in success rate (defined as any play with an EPA > 0) and how much harder it is to generate explosive plays in the passing game.
In short, the findings were drastically different. A perfectly covered play forces an offense to be the least efficient offense in NFL history. Since 2019, offenses lose about 0.3 points on average when every coverage player on the defense does their job. Offenses are about 20% less successful on a per-play basis when facing a perfectly covered play, and it is extremely difficult to dial up an explosive play on a perfectly covered play.
While PFF began that aforementioned “all coverage” charting process only in 2019, we’ve coincidentally seen some of the best offenses of the past decades in that three-year span. So naturally, broken coverages have occurred more often than not. Add in the fact that young wide receivers have been impact performers right out of college, and it’s easy to see why defenses have struggled the past couple of years (some more than others, as we’ll show later in the article).
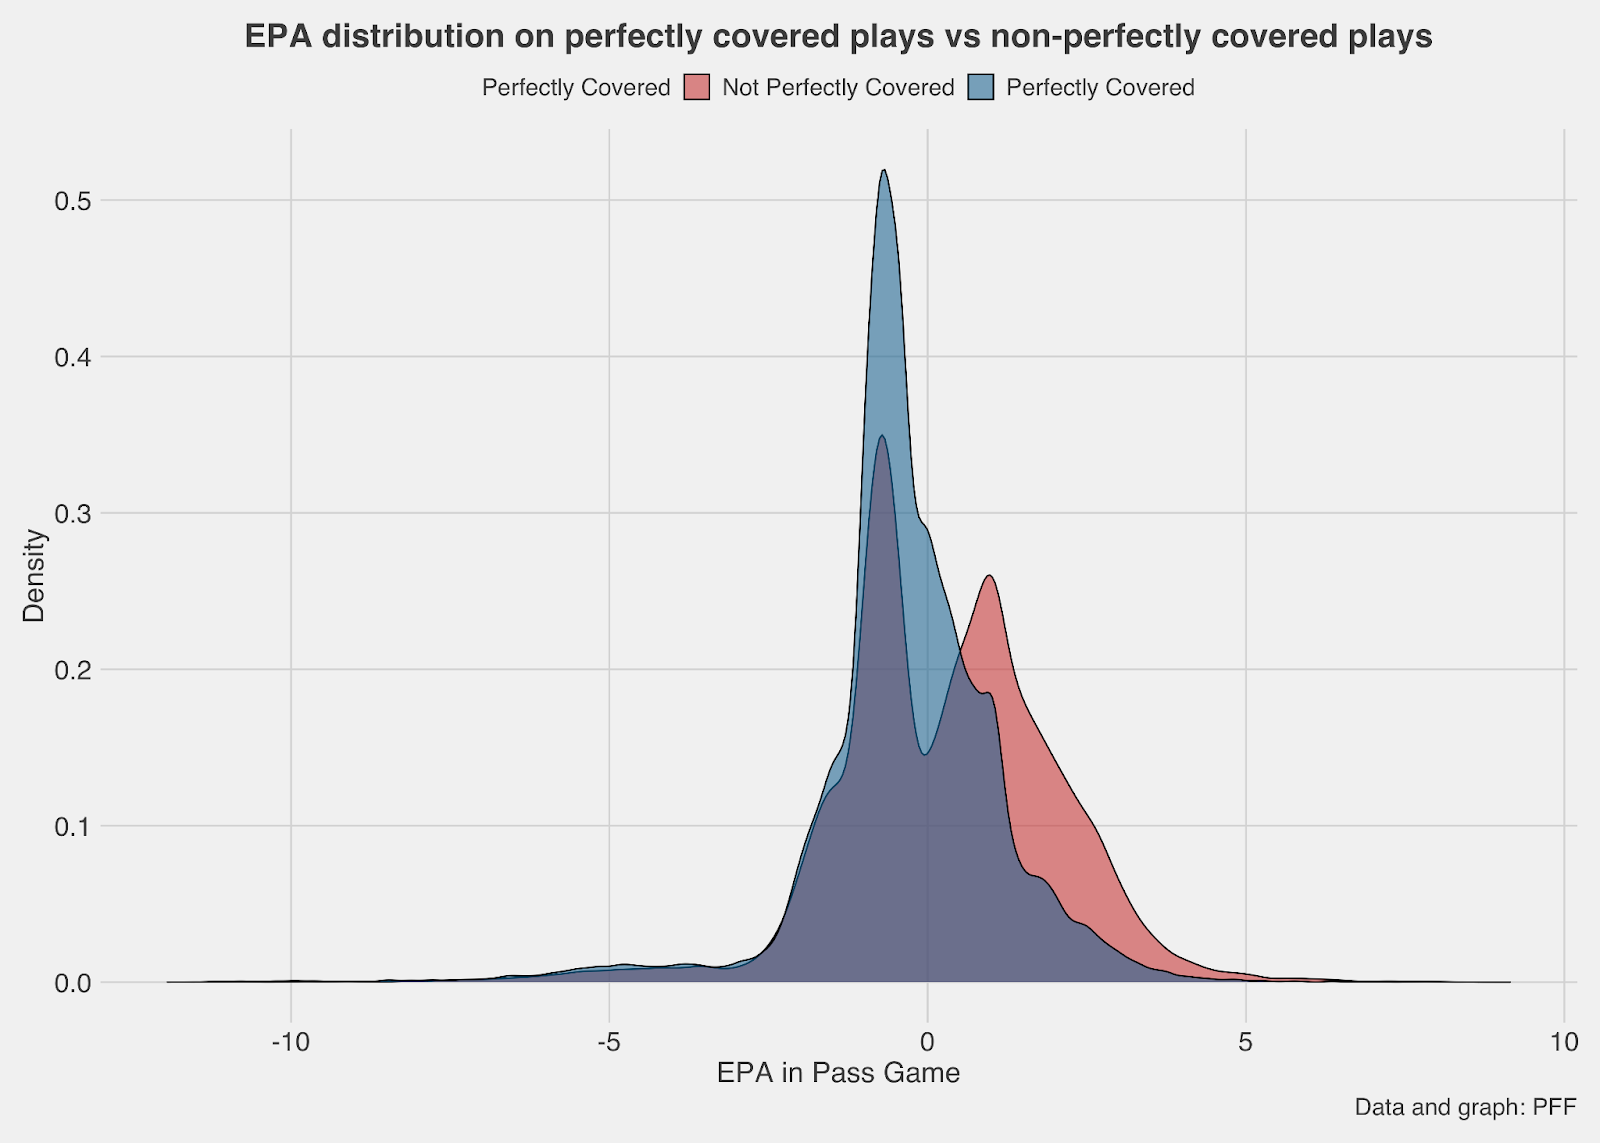
Here is the EPA distribution curve as a function of whether a play was perfectly covered or not. The effect of perfectly covered plays is easily visible here. With a larger density of positive EPA plays, and a much wider right tail (signifying the explosive plays mentioned earlier), a broken coverage can turn into a game-changing play instantly.
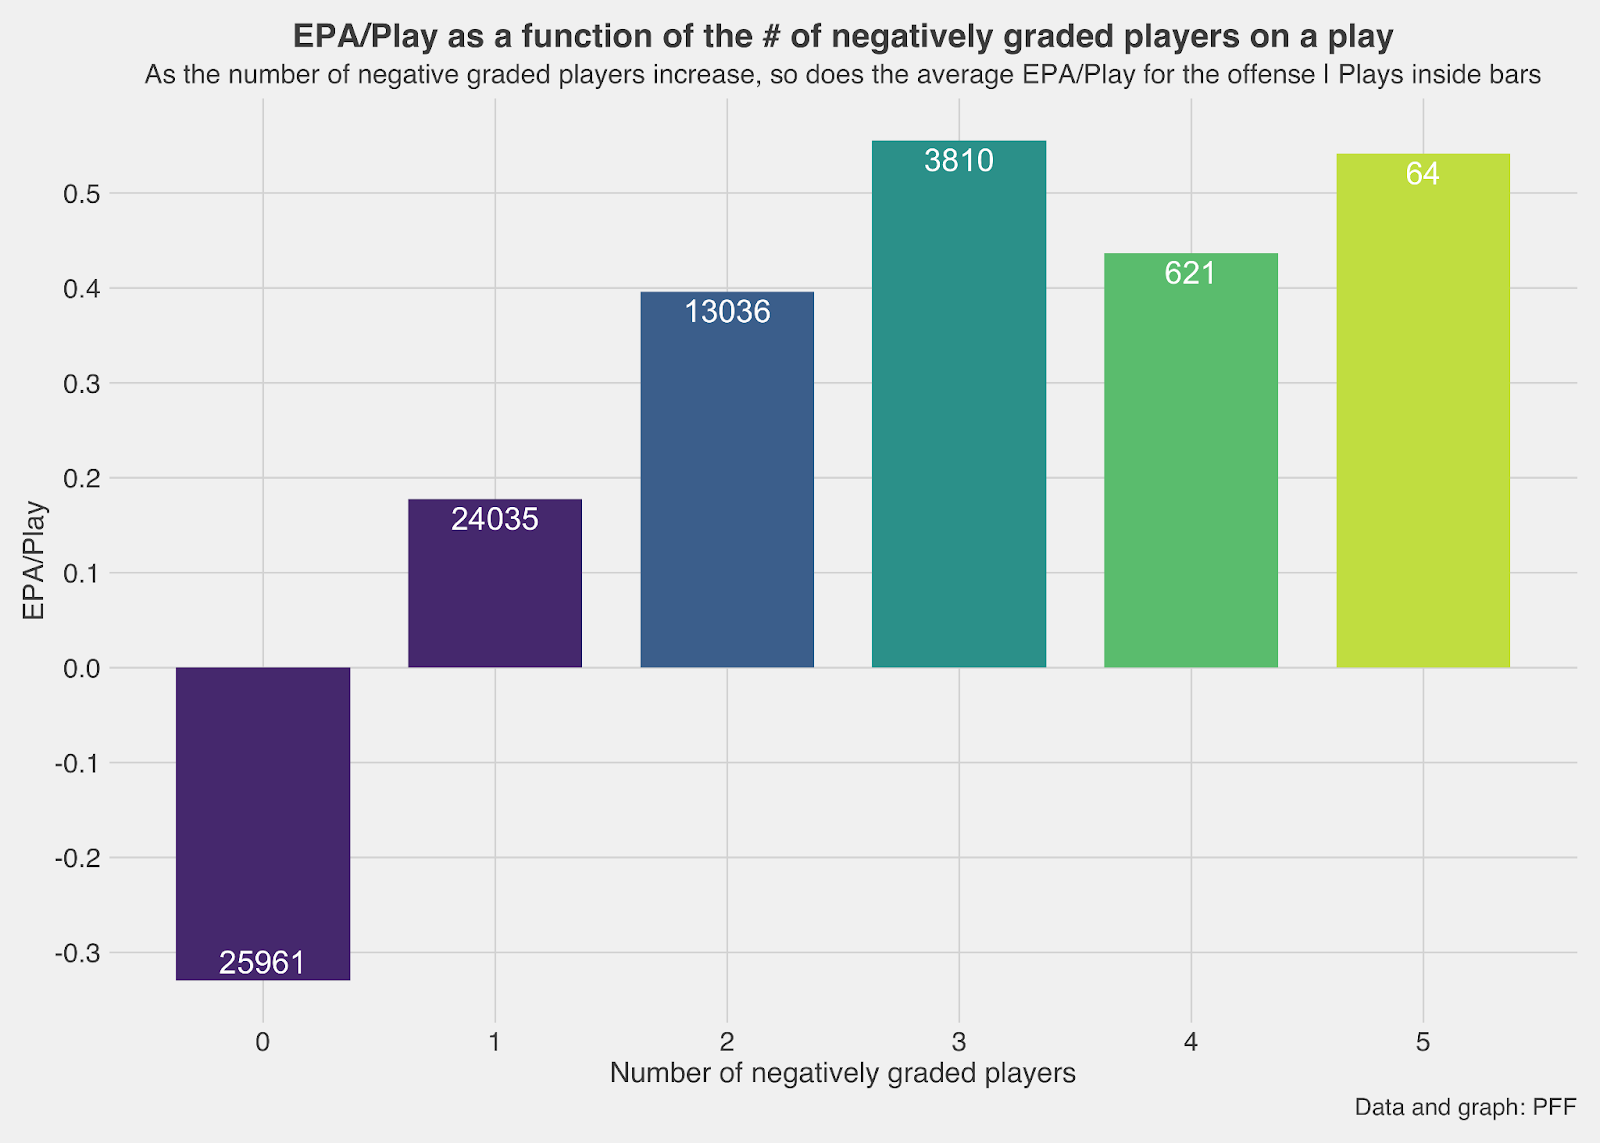
We can also examine how a quarterback is affected by the number of coverage players who mess up on a given play. As stated before, the average EPA on perfectly covered plays is negative, but we can visually see how quarterbacks improve when defenders don’t do their jobs. There are obvious sample size issues for plays with four and five defenders receiving negative coverage grades, but it’s interesting to see how marginally better offenses get when more defenders mess up on a given play.
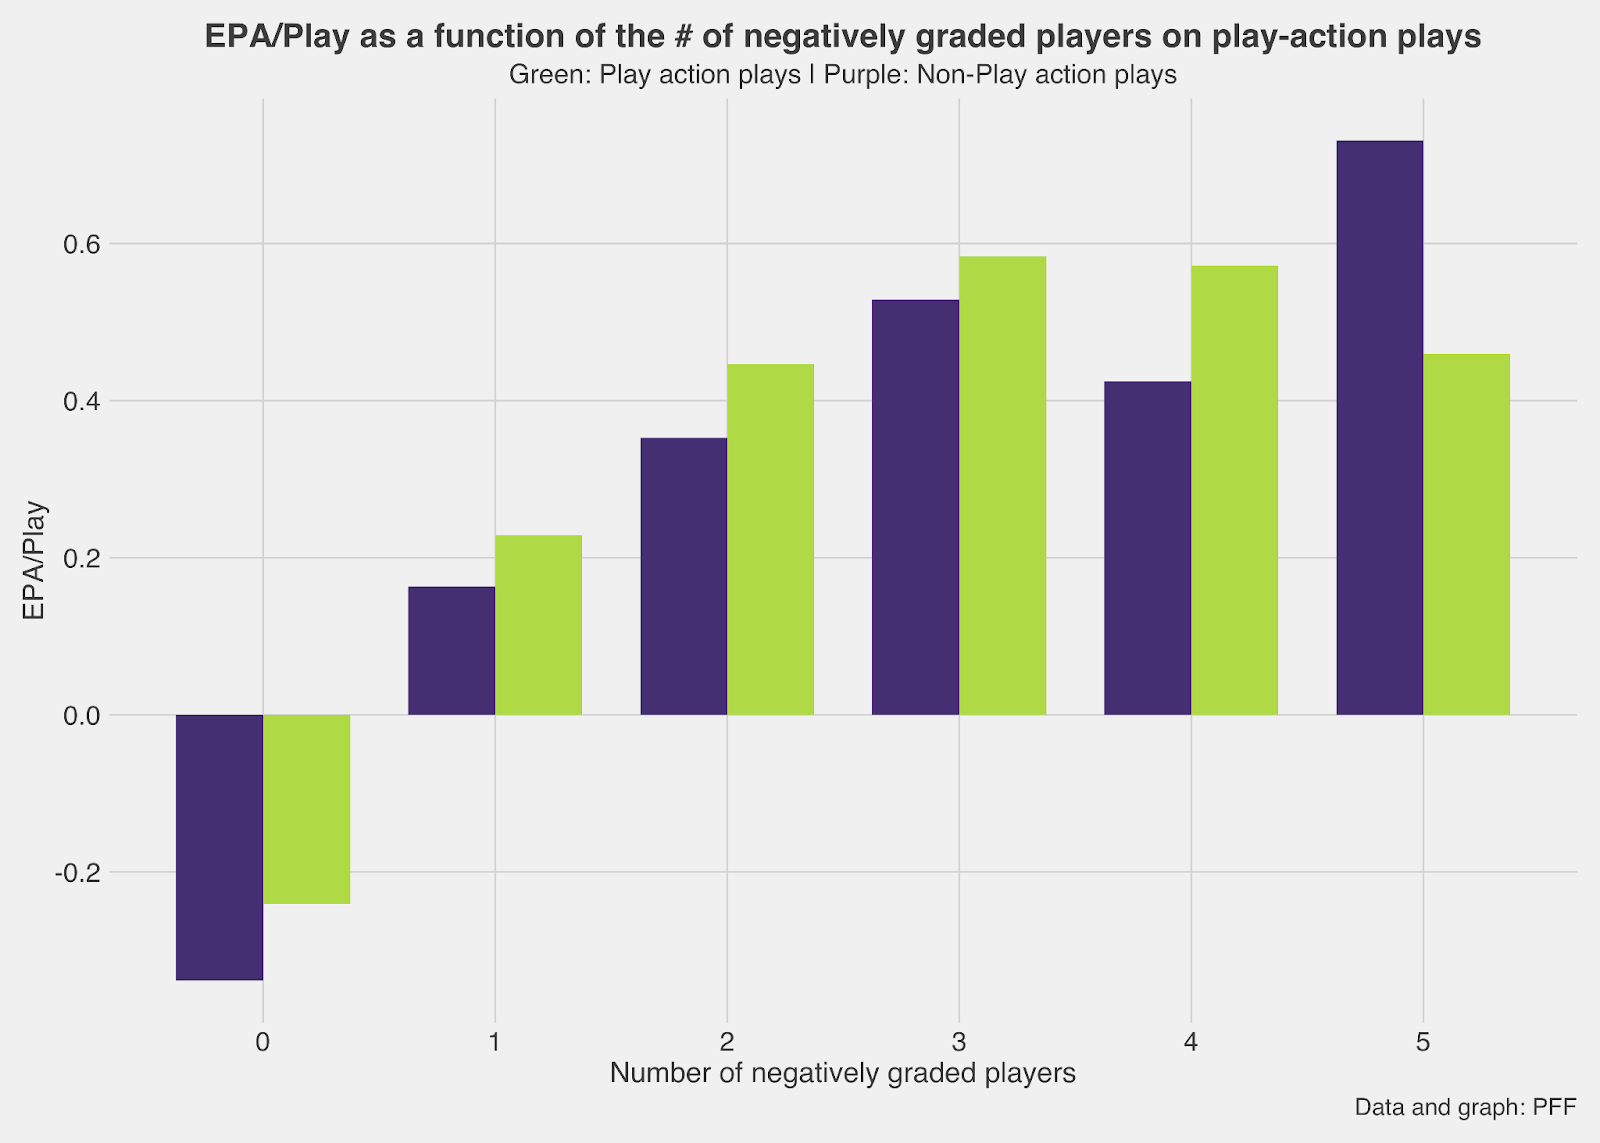
We decided to break this down even further, showing the difference between play action and non-play action. It's long been known play action is more effective than straight dropbacks, which is delineated here, as well. As shown, play action produces a higher EPA per play figure as the number of negatively graded players increases along with it. Additionally, running play action forces a broken coverage on approximately 63% of plays, as compared to 60.7% on straight dropbacks.
Analyzing perfectly covered plays at the team level
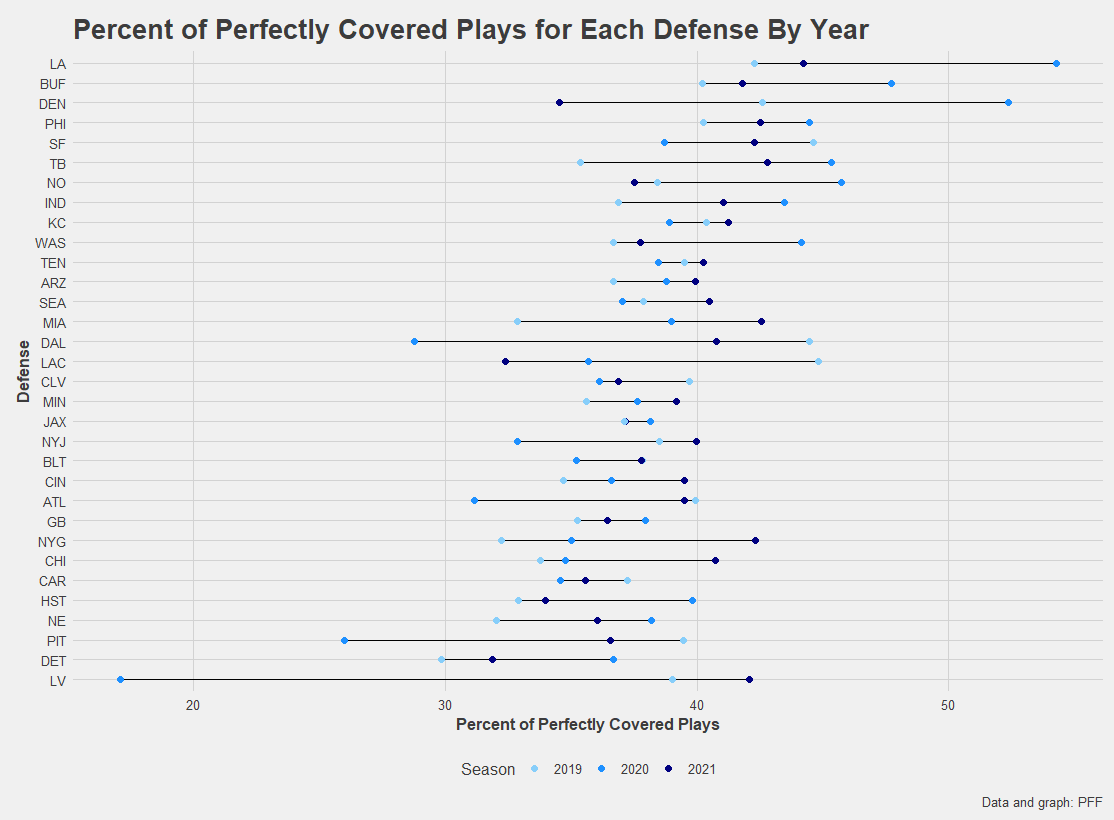
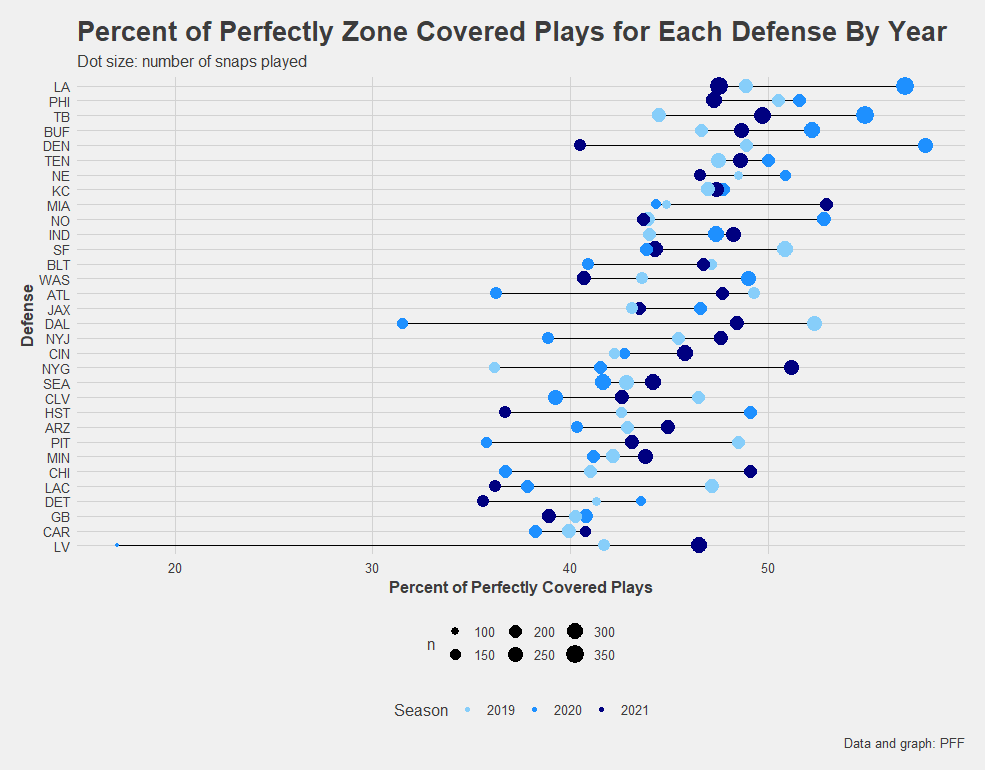
We can also look at how successful each NFL defense is at generating perfectly covered plays, as this varies greatly by team (and by year). Since 2019, the Los Angeles Rams have had the highest overall percentage of perfectly covered plays, and they were the top team in that aspect in both 2020 and 2021. A strong secondary combined with running a zone-style defense most of the time helps buoy them at the top of the list.
It is also worth noting, as shown in the plot below, that eight of the top 10 defenses at producing perfectly covered plays for the three-year span were most successful in the 2020 season before regressing in 2021 while some of the lower-ranked teams closed the gap.
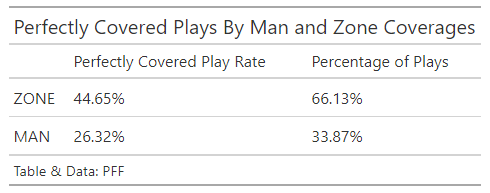
We can further break this down by man and zone coverage. There is a distinct difference in the percentage of perfectly covered plays based on what type of defense the team was running:
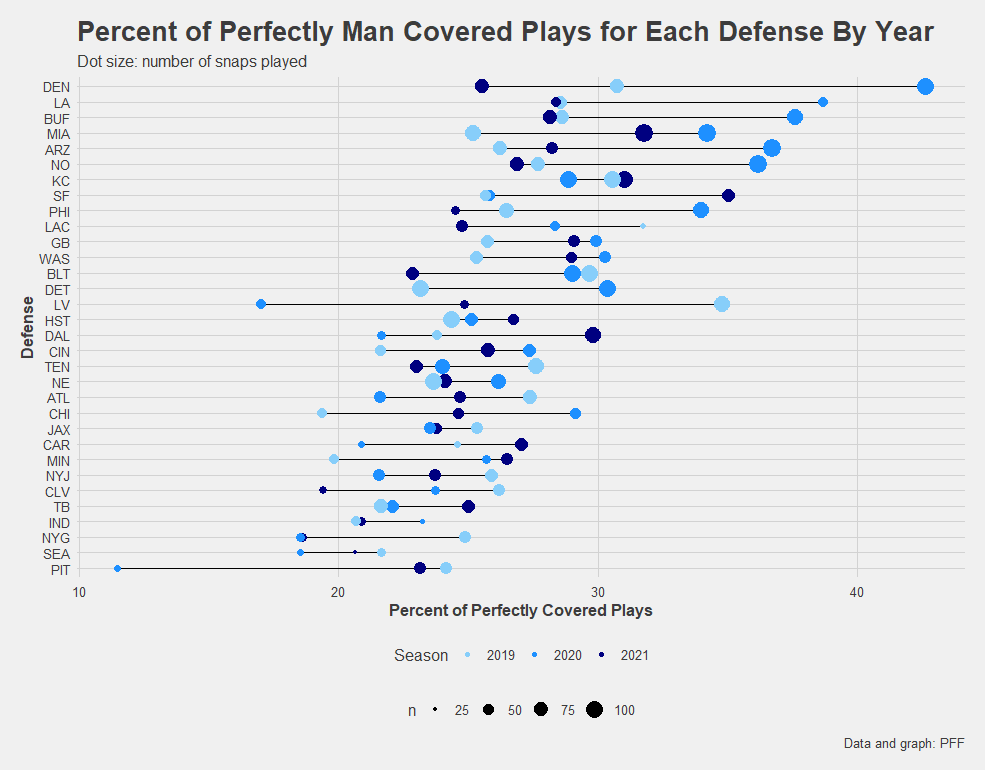
Each individual team has its own style of defense, whether it be running more man or more zone coverages. The graphs below show how successful each NFL team was at generating perfectly covered plays by whether they were running a man or zone defense on that snap.
Looking at the Tampa Bay Buccaneers, their man defense ranked only 28th in the league in this aspect, but their zone defense placed second — behind only the Rams. The Buccaneers ran a good amount of man coverage in the past three seasons, much more than they maybe should have, given the other teams that were not successful at producing perfectly covered plays in a man-style defense chose to run more zone.
Additionally, the plots below further show how successful the Rams were in their defensive coverages. Their man defense (which they do not utilize a lot), is the second-most successful grouping in the NFL at producing perfectly covered plays, behind only the Denver Broncos. However, given that Los Angeles' zone defense was the best at producing perfectly covered plays, which occurred over 50% of the time, it makes sense the team may have not wanted to run the risk of playing more man coverage. Even though the Rams ranked second in the league, they generated perfectly covered plays only about 30% of the time from such coverages.
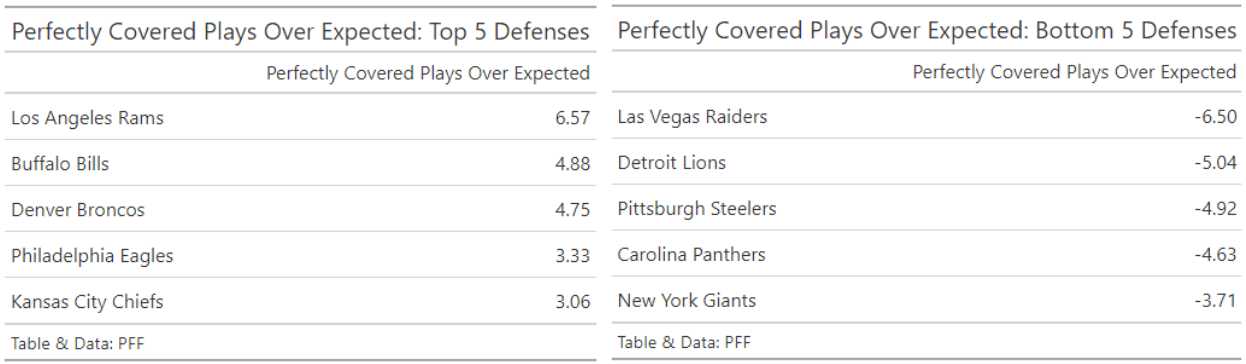
Perfectly Covered Plays Over Expected (PCPOE)
Now that we have this team-level information, we can normalize it into a “Perfectly Covered Plays Over Expected” metric. Each team does not face the same situations — for example, the likelihood of a play being perfectly covered by the defense is drastically different on a third-and-short play in the red zone than a first-and-10 at midfield.
To combine all of these factors into one metric, we used a logistic regression model that contained the following features: down, number of coverage players, distance (short, medium and long by down), time remaining in half (early, mid and two minute), defense play assignment (man or zone) and yards to go until goal (long, mid and red zone). Each of these situations was weighted and given a prediction for the percentage chance they would be perfectly covered.
Using these predictions, we counted how many of each situation each team faced and averaged the prediction of perfectly covered passes they were expected to cover. Finally, subtracting this amount from each team’s actual percentage of perfectly covered passes gives us our Perfectly Covered Plays Over Expected metric. A positive value means the team perfectly covered more plays than expected, and a negative value means the team perfectly covered fewer plays than expected.
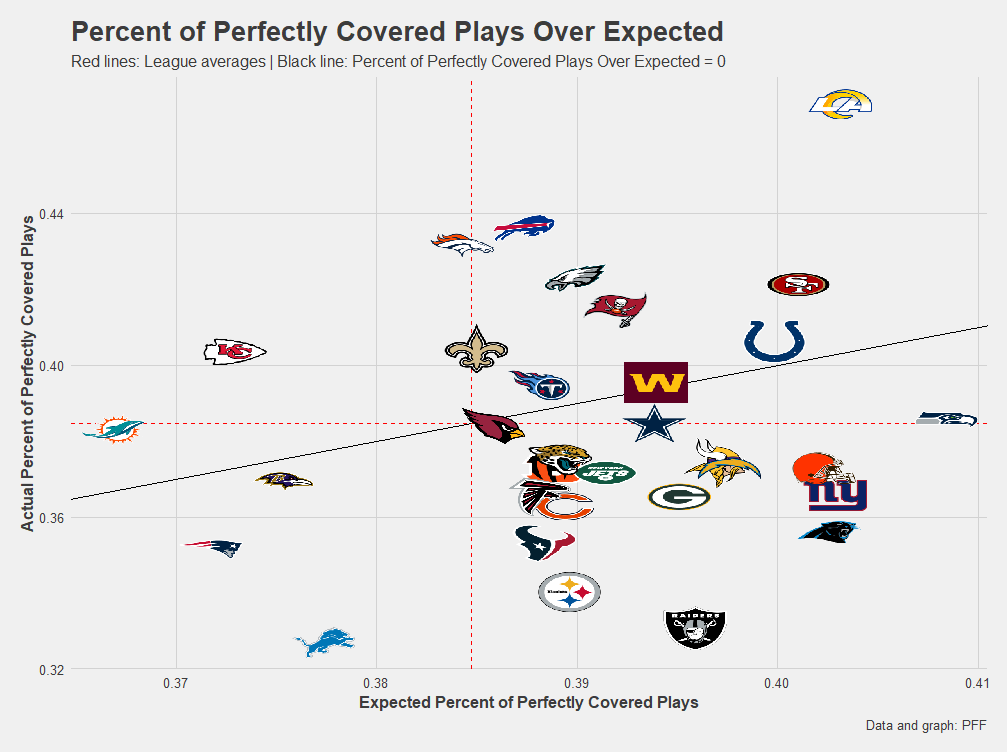
The graph below puts into perspective the above tables and how often teams actually produced perfectly covered plays compared to expectations. Looking at the Expected Percentage of Perfectly Covered Plays, the Seattle Seahawks were expected to produce the most and the Dolphins were expected to produce the fewest, which is all based on the situations they faced in the past three seasons.
Additionally, if a defense is above the black line, they had a positive Perfectly Covered Plays Over Expected value, and vice versa. Even though the Rams were one of the teams that faced the “easiest” situations, they generated a massive number of perfectly covered plays — far more than expected. On the other hand, the Las Vegas Raiders were expected to produce a well-above-average number of perfectly covered plays given the situations they faced in the past three seasons, but their actual total falls well below those expectations.
Perfectly covered plays not only inform us about defense but also allow us to better understand quarterback play and decision-making. Consider that it is one skill to find a receiver following a blown coverage assignment, but it is a whole different skill to create offense when the defense has the receivers covered. What happens when none of the quarterback’s looks are open and the defense has everything covered?
There are four possible outcomes for a passer when facing perfect coverage. They can throw it into the perfect coverage, throw it away, take a sack or scramble. Let's look at base EPA rates across the league for these four options:
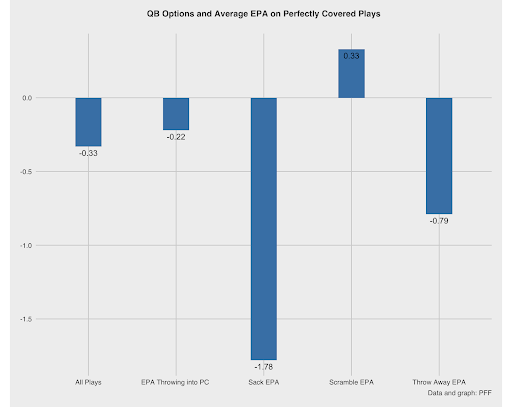
The results are telling. Throwing into perfect coverage is a recipe for trouble, and tucking and running is the only recipe for success on average. However, the frequency at which a quarterback chooses to throw into coverage (83%) far outweighs the other alternatives. But despite that high frequency, a quarterback's EPA throwing into perfect coverage is not the end-all, be-all of their total EPA on perfectly covered plays.
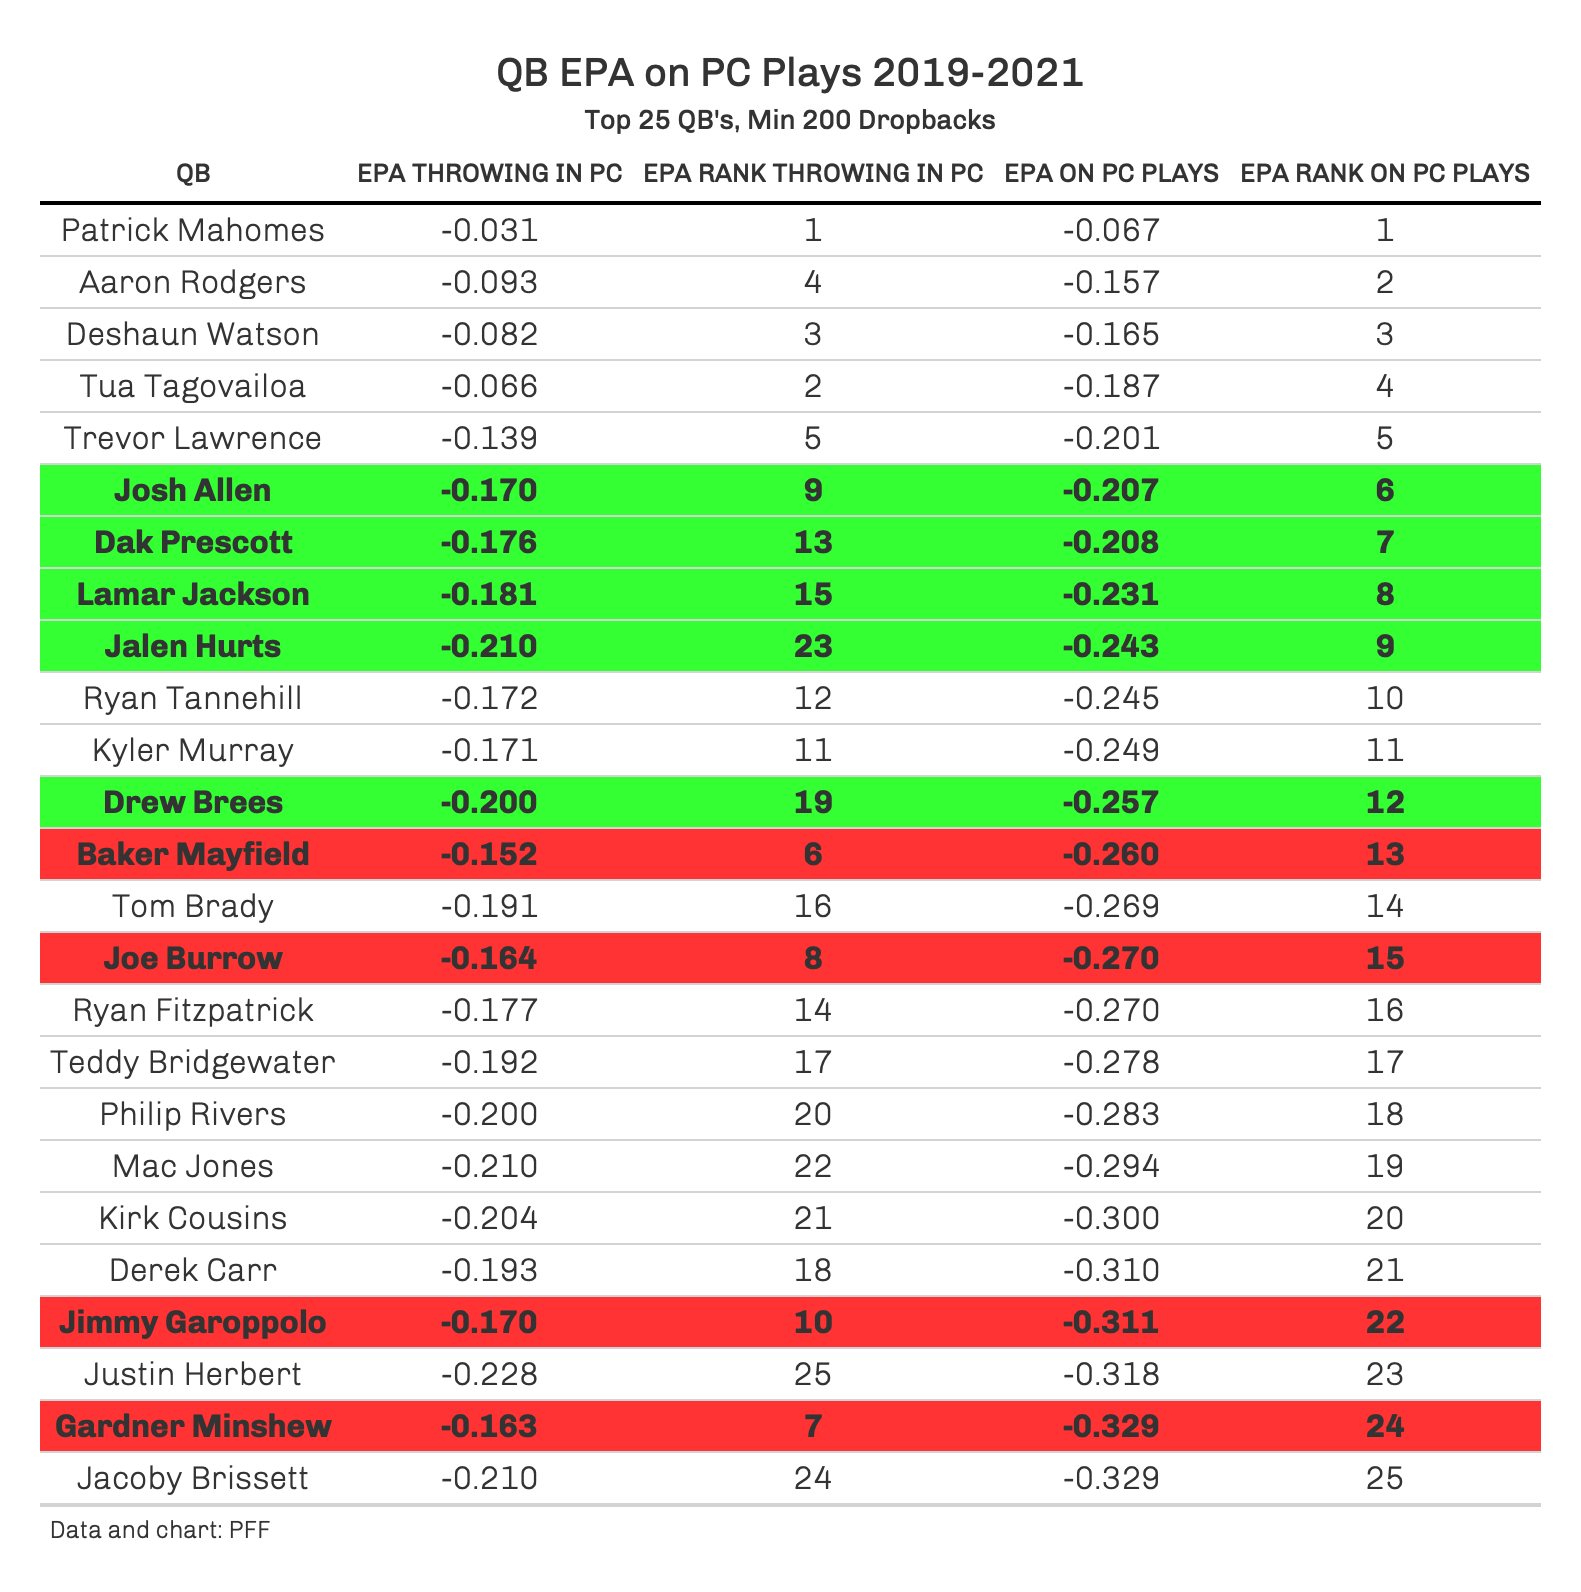
Quarterbacks such as Jalen Hurts, Lamar Jackson and Dak Prescott make an impressive leap in their total EPA rank on perfectly covered plays because they scramble often and well while avoiding sacks. The most successful passers see the perfect coverage and throw into it less often, instead deciding to tuck it and run for, generally, positive EPA.
Conversely, quarterbacks such as Jimmy Garoppolo, Joe Burrow and Baker Mayfield, who all ranked top 10 in EPA throwing into perfect coverage, fall out of the top 10 in total EPA because they scramble poorly and less often and take many sacks. For quarterbacks, identifying the perfect coverage and deciding to scramble is the best path to defeating perfect coverage.
Summary
We hope this article was able to bring to light new ways of viewing coverage at the team and player levels. Looking at some of the key data points in this article, it’s easy to understand how much of a “passing league” the NFL really is, given the frequency that broken coverages appear compared to perfect coverage.
When the defense does its job perfectly, it’s tough for the quarterback to turn a play into a positive outcome. Instead, they should be trying to make a decision that is the least harmful to the offense. But when one or multiple players in coverage aren’t doing their job, quarterbacks have done well to take advantage.
Six defenders could do their job in coverage, but all it takes is one player to mess up for the offense to turn that play into a success.
