We have previously looked into each defensive coverage position in football and how often they make mistakes, as well as the effect of those on both the defense's and opposing offense’s performance. However, what factors go into each position’s, and more specifically each player’s, coverage rate (the percentage of the time the coverage defender successfully covers the offensive player and earns a positive or neutral coverage grade)?
Generally, each defensive coverage position has a different successful coverage rate, with safeties having the highest, followed by linebackers and then cornerbacks. Using NFL combine data from 2019-2021, we can look at how much each measurement and drill reflects the player’s eventual successful coverage rate in the NFL. Additionally, we can look at the players and defenses that exceeded their NFL combine athleticism or even underperformed based on what their combine athleticism predicted their coverage rate would be.

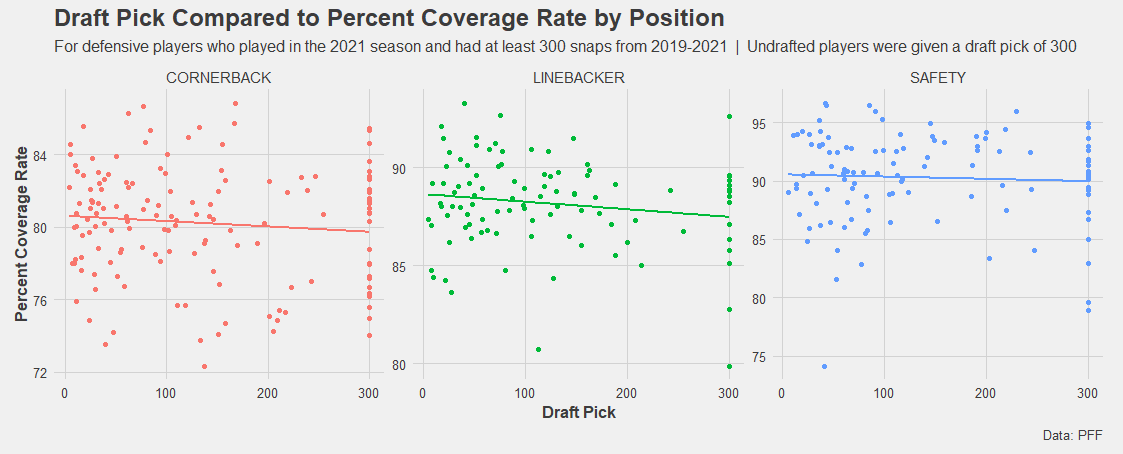
DRAFT PICK AND NFL EXPERIENCE COMPARED TO COVERAGE RATE
How much do draft selection and NFL experience contribute to a player’s eventual NFL coverage rate? One would expect that, generally, players drafted in the earlier rounds would have a higher coverage rate than those selected later or who go undrafted. This generally seems true according to the plot below, as the line slopes down slightly for each position, but not as much as you may think. It’s only a difference of about one to two percentage points for each position, and drafting a player (specifically a safety) in the later rounds could yield about the same coverage rate as one drafted in the first two rounds.
Of course, the player must earn a spot on the team and get playing time, so most of the later-round picks could just be the best of the bunch who impressed coaches in practice or preseason.
40 TIME COMPARED TO DRAFT PICK AND COVERAGE RATE
Getting into the NFL combine drills, the 40-yard dash is mostly regarded as the most important, as players train months for that one test. So, how much does a coverage defender’s 40 time correlate to their NFL coverage rate and the position at which they were drafted?
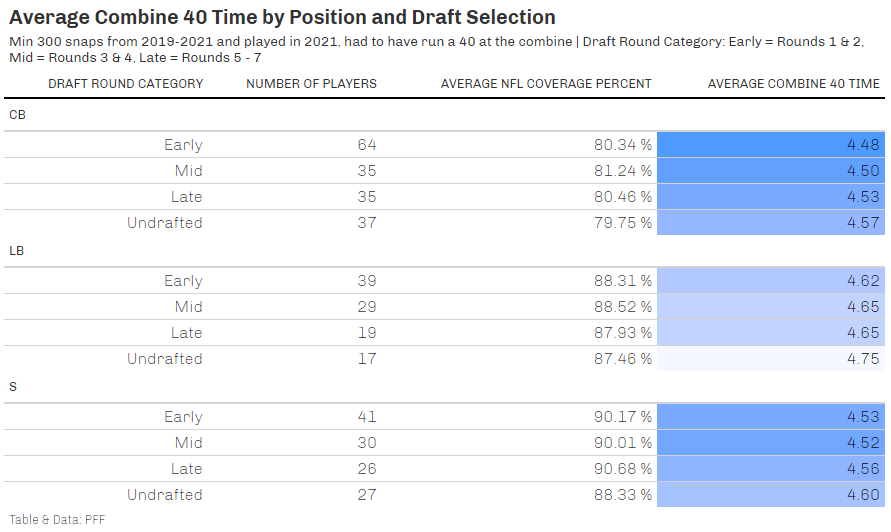
The above table shows that the fastest coverage defenders were drafted earliest, with the average 40 time slowly increasing as players are drafted later on. Undrafted players for each position had a much weaker average 40 time than players who were drafted.
However, a player’s 40 time may not have the biggest impact on their NFL coverage rate, as cornerbacks and linebackers drafted in Rounds 3 and 4 and safeties drafted in Rounds 5-7 have the highest coverage rates for their position, meaning that the fastest players (who are usually drafted in Rounds 1 and 2) generally do not have the highest coverage rates. The difference in coverage rate is not the biggest, but this relationship is worth noting.
COMBINE ATHLETICISM COMPARED TO COVERAGE PERCENTAGE (COVERAGE RATE OVER EXPECTED)
How much do drills and measurements at the NFL combine reflect a player’s eventual NFL coverage rate? We can investigate this using each player’s NFL combine or pro day data from 2019-2021.
This article from PFF's Eric Eager lays out the general framework for adjusting pro day data so that it’s on the same scale as combine data. However, not every player participates in every drill at the combine — some choose not to run the 40-yard dash or do the broad jump, for example. So, these missing values need to be imputed, in this case using k-nearest neighbors. This algorithm will impute the missing aspect’s approximate value based on the closeness of its other values to the values of other observations. Players who did not participate in the NFL combine and had missing values for all the measurements and drills were not eligible for imputation and were removed.
Now that all the values are imputed, we can begin to calculate the importance of each combine measurement and drill to a player’s NFL coverage rate. To do this, we used Principal Component Analysis (PCA), as some drills correlate strongly with other drills, therefore creating multicollinearity. Previously, PFF data scientist Timo Riske looked into the correlation of some combine drills, and the table below adds in the other measurements.
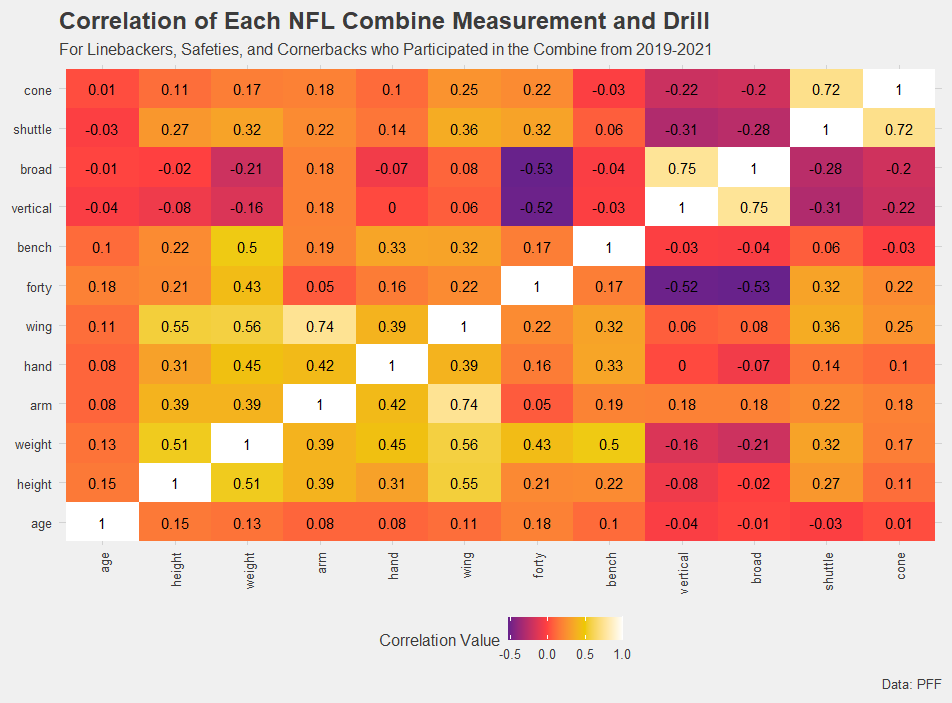
Boxes with lighter colors and higher numbers correlate more to each other. Here, we can see the broad jump, vertical jump, shuttle and three-cone strongly correlate together. Using PCA will reduce the dataset of combine drills and measurements down to principal components that account for a percentage of the variance. In this case, the best linear regression model — using the principal components and the player’s position as predictors of NFL coverage rate — involved only the first two principal components, shown below.
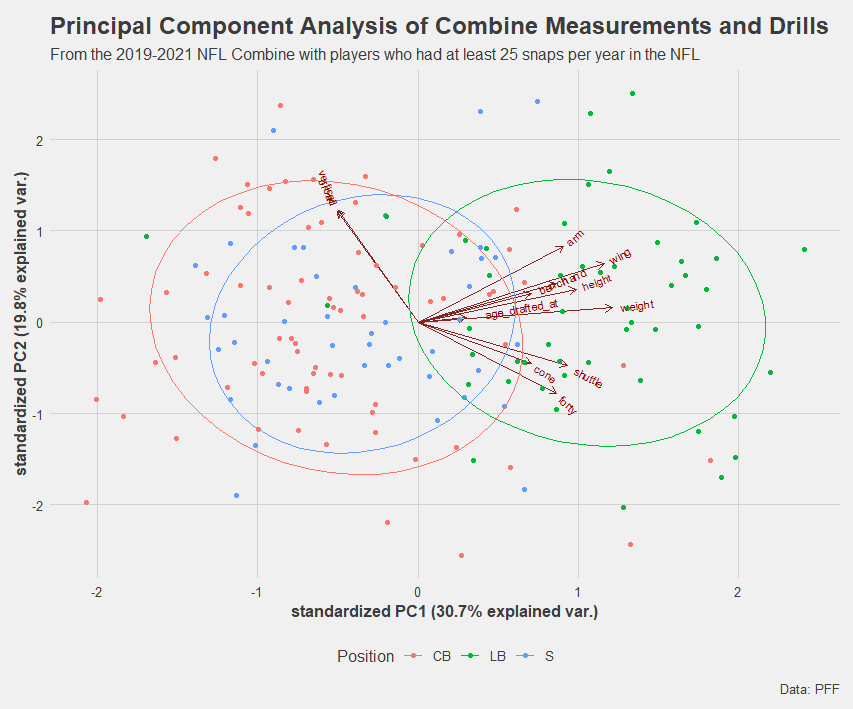
The vertical and broad jump tests differ the most from everything else measured at the NFL combine, as the PCA plot above shows that those two measurements contribute more to the second principal component. Broken down by position, cornerbacks and safeties are characterized more by their vertical and broad jump abilities, which makes sense because it's critical that these two positions have the ability to elevate to the height of receivers to make a play. Meanwhile, linebackers are characterized by a general mix of the other measurements.
I built a linear regression model that takes into account the top two principal components, as well as the defender’s position, to predict a player's NFL coverage rate. Some players greatly exceeded their NFL combine athleticism, where their actual coverage rate was much higher than their predicted coverage rate from their combine results.
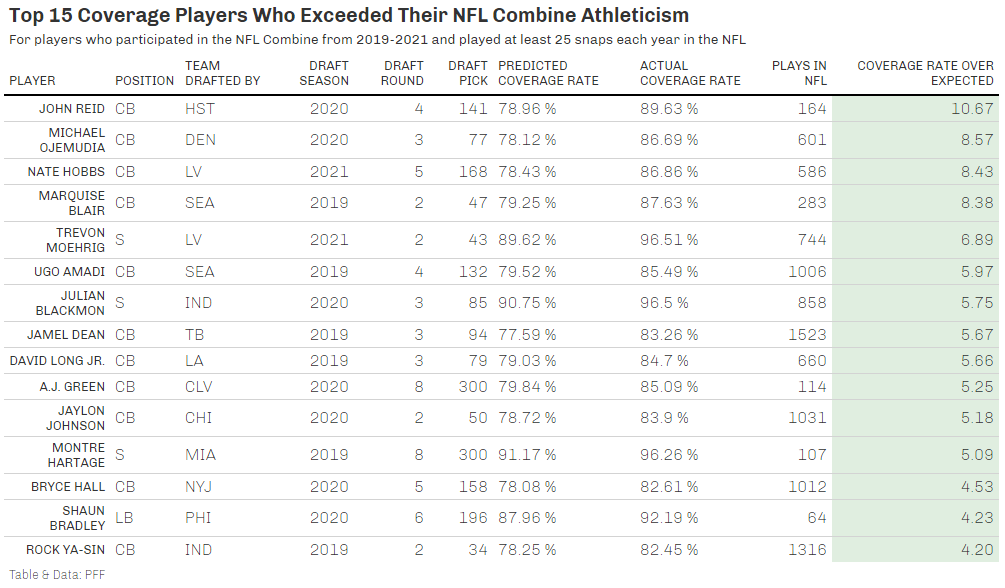
This list is mostly made up of cornerbacks, with NFL coverage rates for the position generally hovering around 80%. However, the cornerbacks on this list greatly overperformed on their generally underwhelming combine results. Perhaps the most impressive player on this list is Trevon Moehrig, who had one of the lowest predicted coverage rates from his combine results but greatly exceeded that prediction to have the top coverage rate for safeties (drafted from 2019-2021) in just his first season.
DEFENSE SPECIFIC ANALYSIS
Each team has its own strategy for drafting players. Some may choose to draft players who were breakout stars at the combine, and others may not value those results as much. We can look at which teams drafted the most “athletic” players in terms of predicted coverage rate and which teams took players who may not have had the most combine athleticism and turned them into star coverage players in a metric called Coverage Rate Over Expected.
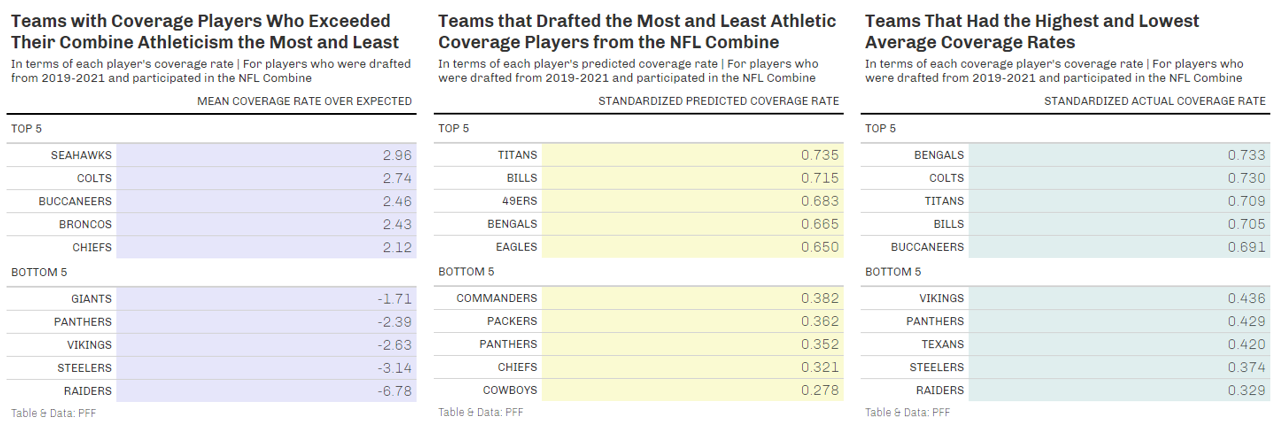
The Seattle Seahawks had the highest Coverage Rate Over Expected from 2019 to 2021, greatly aided by cornerbacks Ugo Amadi and Marquise Blair, who had two of the top-six values in this aspect. However, having a high Coverage Rate Over Expected does not mean the team had the highest average coverage rate. Instead, that's more to say the team drafted players who weren't predicted to have high coverage rates but outperformed their combine results. Here, the Seahawks took those two players and turned their underwhelming combine performance into high coverage rates, but they rank only 11th in terms of their standardized actual coverage rate.
The Las Vegas Raiders had the lowest mean Coverage Rate Over Expected value as a team from 2019 to 2021 even though they had two of the top-five players in that regard. That was counteracted by their five players in the bottom 15, along with former Raiders cornerback Damon Arnette, who ranked comfortably in last.
Since safeties, linebackers and cornerbacks naturally have very different average coverage rates, these values needed to be standardized so that they could be compared in the same way. By position, each player’s predicted and actual coverage rates were standardized from 0 to 1, and then the average was calculated for each team.
From 2019-2021, the Cincinnati Bengals drafted the fourth-best coverage unit in terms of predicted coverage rate, and they had a great turnout to have the highest actual coverage rate from those players, meaning they exceeded their NFL combine athleticism. The Tennessee Titans and Buffalo Bills also had drafts in the top five in terms of combine athleticism for coverage players that solidly remained in the top five for their actual coverage rates.
On the other hand, the Carolina Panthers drafted the third-least athletic coverage unit over the past three years and did not successfully turn those players into a top coverage unit, as they remained in the bottom five for their standardized actual coverage rate. The other four teams who were in the bottom five for predicted coverage rates escaped the bottom five for their actual coverage rates, meaning they turned not-so-athletic coverage players from the NFL combine into players with higher coverage rates.
The Kansas City Chiefs even rank fifth in terms of Coverage Rate Over Expected, which showcases their defensive coaches who turned their draft picks into star coverage players.
CONCLUSION
Quantifying NFL combine athleticism into a metric that measures a player’s eventual NFL coverage rate is full of uncertainty, and anything can happen once a player enters the NFL. Some players survive the jump, and some don’t live up to the potential they flashed in their college days. That’s why drafting players can end up being a big question mark, and sometimes a team makes the perfect move or may even get lucky.
But, it may not be all about drafting the most athletic players, even though it does give teams an edge in terms of getting high coverage rates against opposing receivers and tight ends. Instead, it may be about what coaches do to develop these players into star NFL coverage defenders, as some teams and players far exceeded what they were predicted to do.
