The annual NFL Combine invites draft prospects to go through a series of physical measurements and athletic testing. The measurements include arm height, weight, arm length, wingspan and hand size, while the athletic testing includes bench press, broad jump, vertical jump, short shuttle (20 shuttle) three cone and the 40-yard dash (during which a 10-yard and a 20-yard split is measured).
This article is sparked by an obvious difference between measurements and testing. While weight can certainly be tinkered with by the athlete and will change over time, all the measurements represent the true value of these measurements. In other words, if we measured the height of a player 1,000 times during the draft process, we would observe only very little variance in our measurements.
This is certainly not true for the athletic testing results. If a player ran a 40-yard dash multiple times during the draft process, we would observe a sizable variance in results, just as a professional track athlete doesn’t run the 100-meter in the same time in every competition.
Click here for more PFF tools:
Draft Guide & Big Board | Mock Draft Simulator
Dynasty Rankings & Projections | Free Agent Rankings | 2022 QB Annual
Player Grades
Looking at this year’s combine, Ahmad “Sauce” Gardner ran a 4.52 40 in his first attempt and a 4.41 in his second attempt, illustrating the variance that comes with every athletic testing result.
From a statistical point of view, every draft prospect can be assumed to have some true athletic prowess, which determines his median 40-yard dash result, and every 40-yard dash he runs draws one observation from a normal distribution with a certain standard deviation. With the data we have right now, it’s impossible to estimate that standard deviation, but given the 40 times of Gardner, it’s probably at least 0.05 seconds.
Combine results come with a flaw
Using 0.05 as standard deviation, the distribution of 40-yard dash results of a 4.45-speed prospect would look like this.
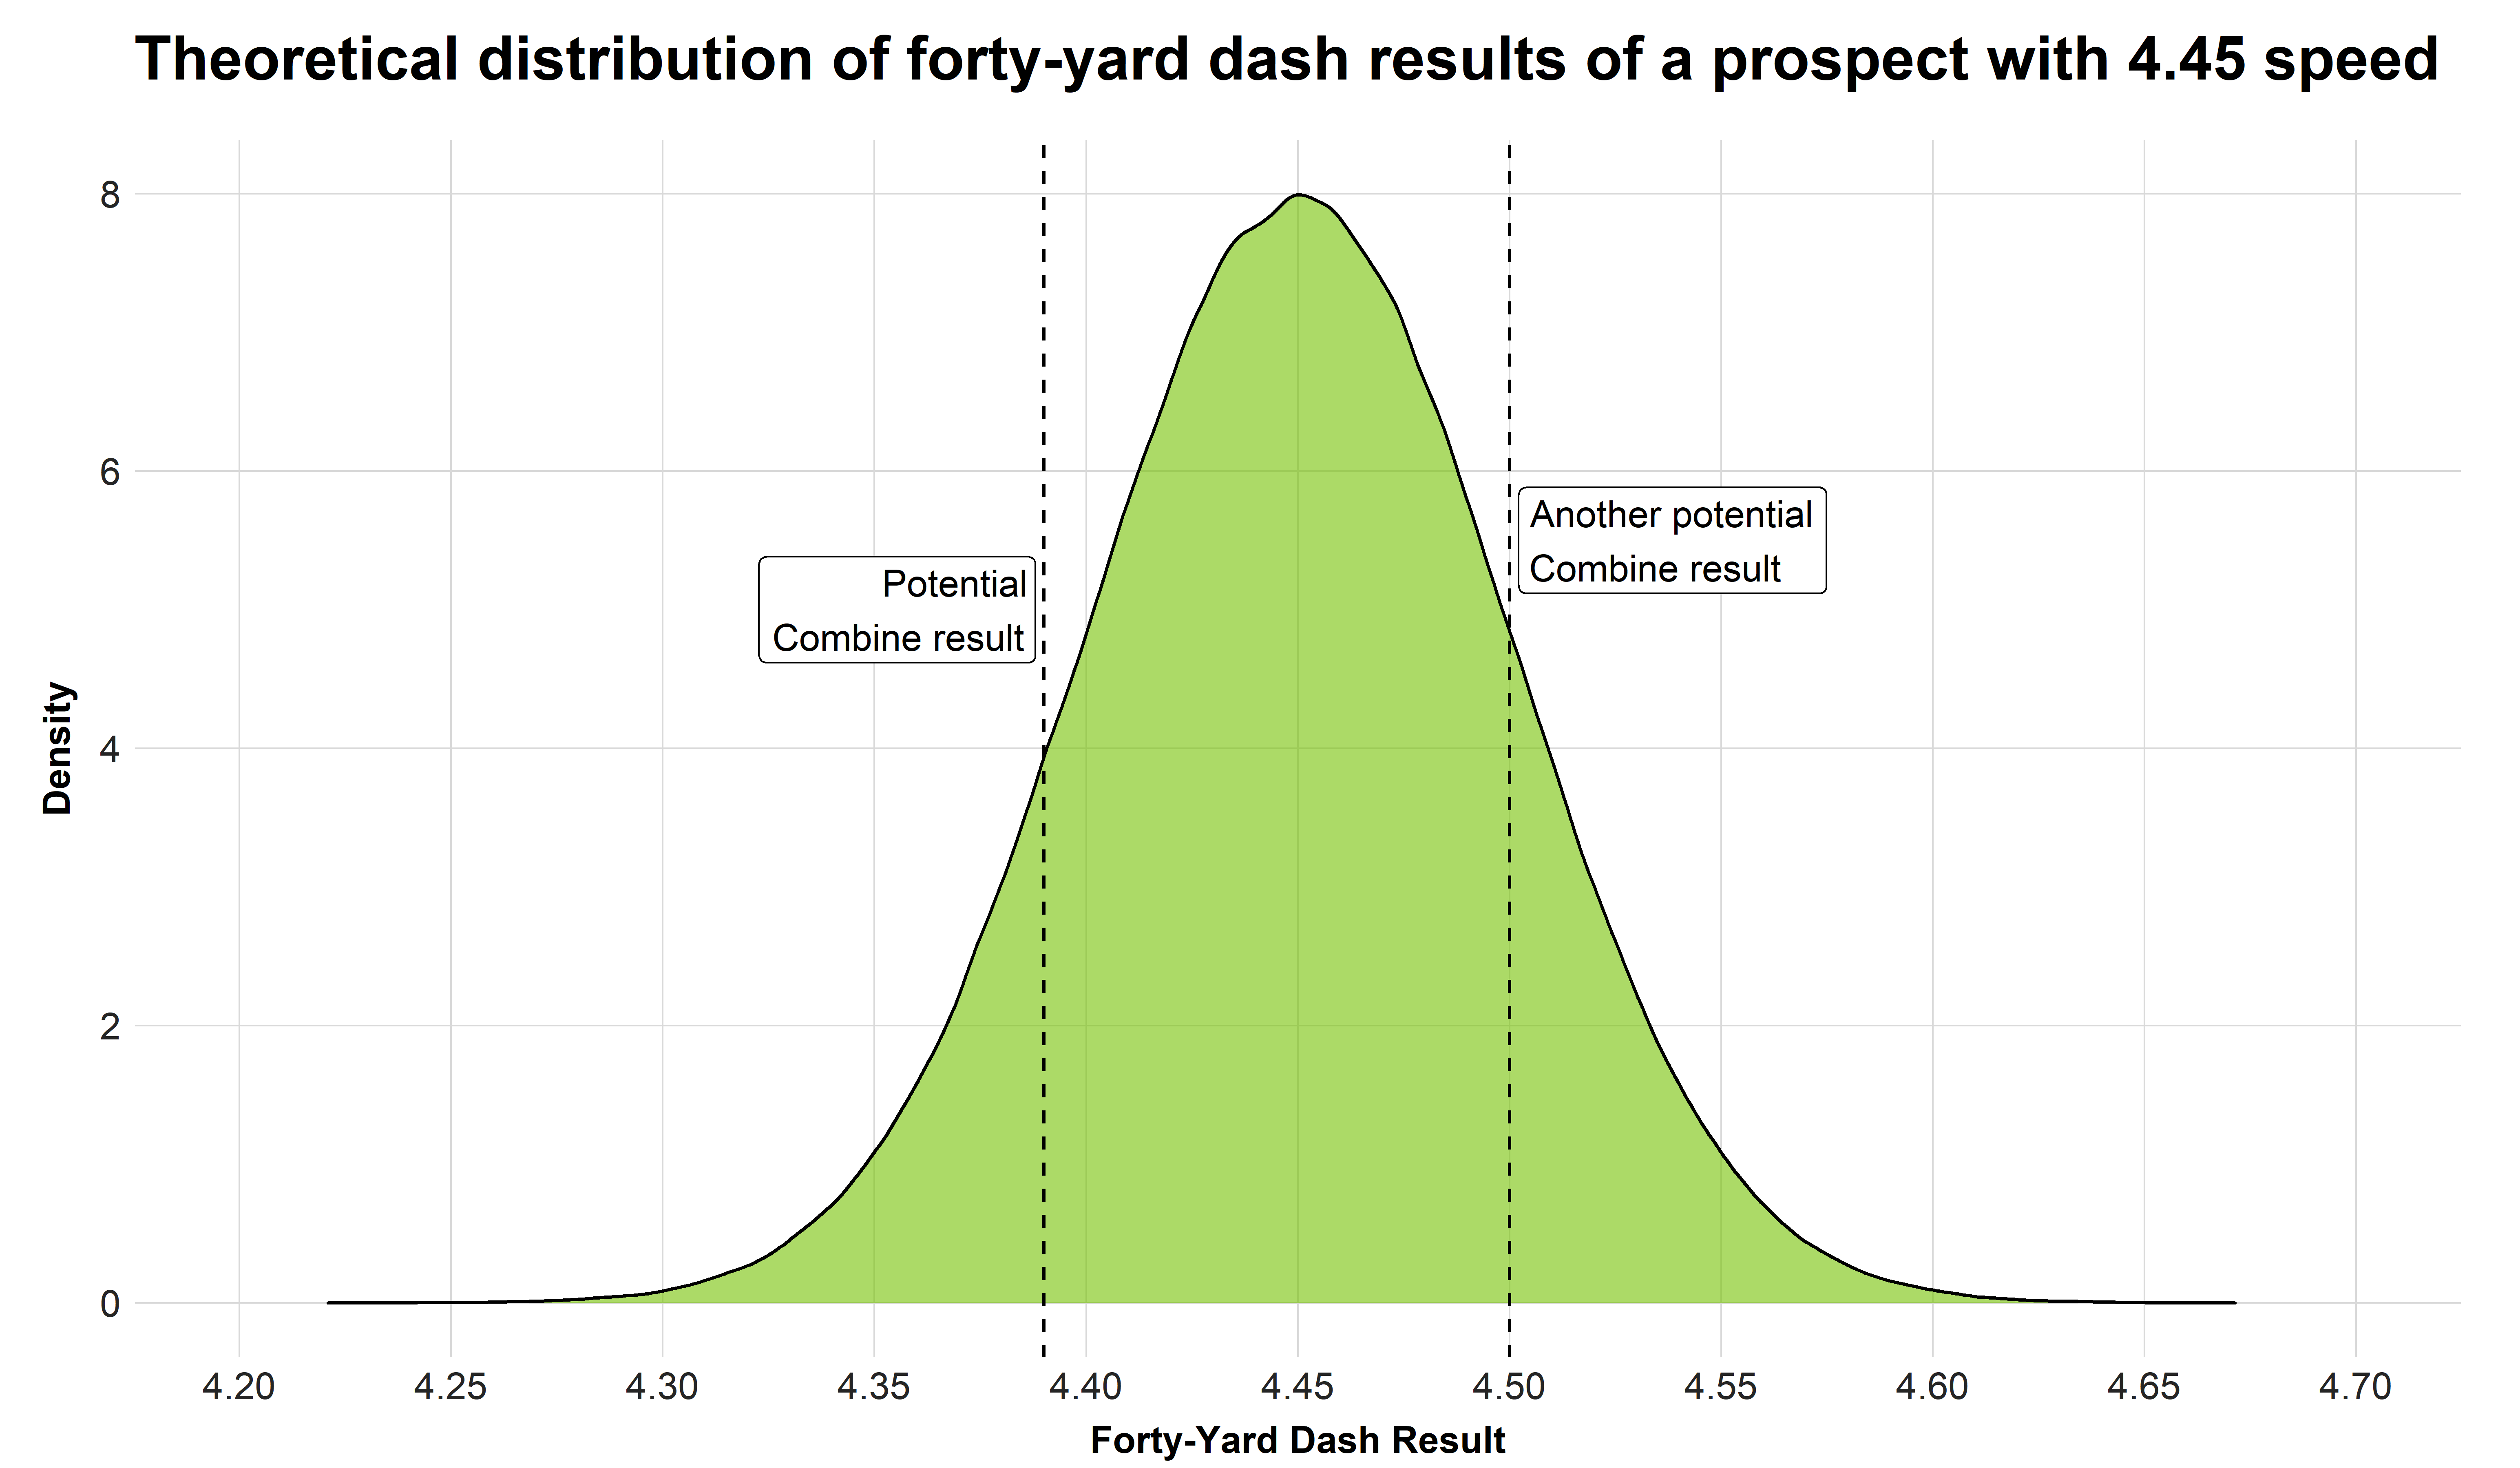
A possible and even very plausible Combine result of such a prospect would be 4.39 seconds, but he could also very well run only a 4.50. The practical problem we face with Combine results is that we only get to see the single observation but don’t know about the true athletic prowess of the prospect. Whether a prospect with 4.45 speed runs a 4.39 or a 4.50 is a huge difference in terms of what we think about his speed, but also in terms of his draft position, as the 40-yard dash is the single athletic testing result that determines draft position most among all Combine testing results.
After all, a 4.39 40-yard dash is the 85th percentile for wide receivers, while 4.50 would indicate only a 45th-percentile wide receiver in terms of speed, while the true speed of 4.45 falls in the 65th percentile.
With college tracking data still not widely available, let alone publicly, estimating the distribution above is practically impossible. However, there is a method to at least determine results that have most likely been falling in the tail ends of the distribution and should thus be taken with a grain of salt.
Relation between the athletic drills can help
The key: While we only have one single data point for each individual athletic drill, the prospects get tested at six athletic drills, which are (apart from bench press) measuring similar things. This is illustrated by the correlation matrix of the six drills, which is: How closely related are the testing drills on a pairwise basis?
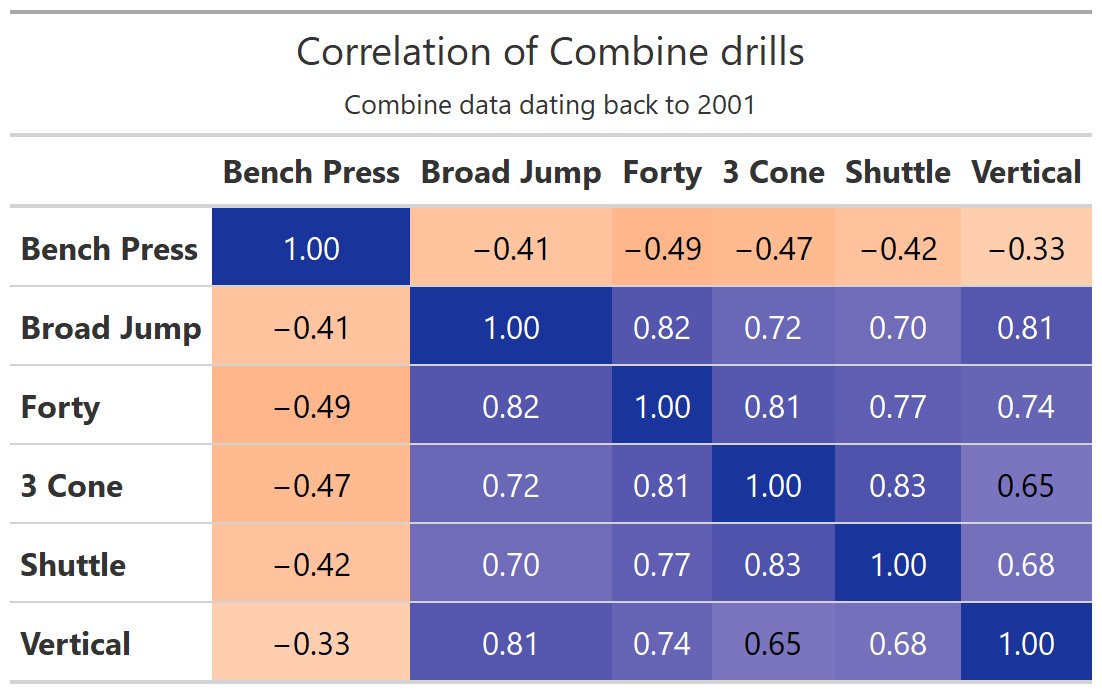
Using a principal component analysis, a statistical method to reduce the dimension of a data set, it turns out that 92% of the variance in the six-dimensional data set of all combine results of historic NFL prospects can be explained using only three principal components. In other words, the six athletic drills boil down to three tests.
Consequently, when given the results of all six drills for a given player, we are essentially given more information than we would need to determine the athleticism of said player. We can use this to identify Combine results that are most likely outliers and don’t represent the true athletic prowess of the prospect in a particular drill.
Anecdotally, it’s easy to find historic examples. Here are the results of the speed and agility drills of Darrius Heyward-Bey and Dri Archer from 2009 and 2014, respectively.
| Darrius Heyward-Bey | Dri Archer | |
| Forty | 4.30s (98th) | 4.26s (99th) |
| Broad Jump | 126in (82nd) | 122in (59th) |
| Vertical Jump | 38.5in (84th) | 38in (80th) |
| Shuttle | 4.18s (61st) | 4.06s (87th) |
| 3 Cone | 6.80s (77th) | 6.86s (89th) |
Both ran an excellent 40-yard dash, but the other results indicate that they are very unlikely to have 98th- or 99th-percentile speed.
The Pittsburgh Steelers selected Archer in the third round of the 2014 NFL Draft, but he never even got the opportunity to showcase his alleged speed because the Steelers apparently noticed in practice that his 40 time wouldn’t result in NFL success. Heyward-Bey was selected seventh overall by the Oakland Raiders in 2009, but the wide receiver ended up as a draft bust who topped 500 receiving yards in a season only once and finished his career with fewer than 3,000 yards total over 10 seasons.
To get an estimate of what their true 40 times would be, we do another principal component analysis after forgetting about the bench press results, since these are fairly uncorrelated to the 40 time. The first three principal components explain more than 94% of the variance among Combine results. We use these three components to train a model that predicts the 40 time. The result can be interpreted as: Given all results of a player in speed, explosion and agility drills (including the 40 itself), here is what we would expect his 40 to be.
It turns out that based on all their speed and agility drills, we would estimate Heyward-Bey’s true 40 speed at 4.38s (87th percentile among WRs) and Archer’s true forty speed at 4.42 (85th percentile among RBs). These are certainly still good results, but if these were their actual Combine results, it might have prevented their respective teams from drafting them so early in the draft. Of course, we don’t know the exact process that led the Raiders to choose Heyward-Bey over Michael Crabtree (10th overall in the same draft) or Jeremy Maclin (19th overall), but his 4.30 40 time stood out against Maclin’s 4.45, while Crabtree couldn’t do the athletic testing at all because he was injured at the time.
Players whose 40 time at the Combine was probably slower than their true speed include Cooper Kupp and Julio Jones. Jones ran a 4.34 during his Combine, but our analysis actually suggests that his true speed was a 4.29. This obviously didn’t hurt his draft stock, but it adds context to why Jones is probably the best wide receiver of the last decade. Kupp famously ran only a 4.62 40, ranking in the 8th percentile among wide receivers. According to reports, the Rams selected him in the third round because they used tracking data from the Senior Bowl to figure out that he was actually much faster than his slow 40 time. Using a principal component analysis, we would put his true 40 at the time of the combine at 4.53. This is still not particularly good (36th percentile), but it would have certainly shown other teams that his athleticism and speed isn’t a red flag for playing in the NFL.

This year’s class
Having looked at historical examples, here are some players whose 40 times should be taken with a grain of salt because they are probably outliers for the particular prospect.
Players who can probably run a faster 40 than they showed at the combine:
| Prospect | Forty | Forty based on PCA |
| S Kyle Hamilton | 4.59 | 4.44 |
| TE Austin Allen | 4.83 | 4.66 |
| T Bernhard Raimann | 5.05 | 4.91 |
| WR Devon Williams | 4.65 | 4.43 |
| LB Devin Lloyd | 4.66 | 4.56 |
| TE Greg Dulcich | 4.70 | 4.60 |
| WR Kyle Philips | 4.58 | 4.50 |
| WR Dontario Drummond | 4.65 | 4.57 |
| WR Kevin Austin Jr. | 4.43 | 4.36 |
| WR Michael Woods II | 4.55 | 4.50 |
Players who are probably not as fast as their 40 suggests:
| Prospect | Forty | Forty based on PCA |
| WR Bo Melton | 4.34 | 4.48 |
| WR Jahan Dotson | 4.43 | 4.56 |
| WR Velus Jones Jr. | 4.31 | 4.43 |
| RB Isaih Pacheco | 4.37 | 4.48 |
| WR Khalil Shakir | 4.43 | 4.51 |
| HB D’vonte Price | 4.38 | 4.46 |
| WR Wan’Dale Robinson | 4.44 | 4.52 |
| HB Kenneth Walker | 4.38 | 4.46 |
| HB Tyrion Davis-Price | 4.48 | 4.55 |
Conclusion
The NFL Scouting Combine is certainly not the best way to measure the athleticism of a player, and the athletic testing will basically become redundant when college tracking data becomes more widely available and teams get even better at using it. Until then, we have to use the somewhat flawed Combine results.
In this article we learned how to spot single drill results that might not be representative of the player’s true athletic prowess. We looked at this year’s Combine results and found some notable players like projected first-round draft picks Kyle Hamilton, Bernhard Raimann and Devin Lloyd who are probably faster than they showed during their 40-yard dash. This is especially good news for Hamilton, who is currently ranked second on the PFF Big Board and will most likely be a top-five pick. His 40 time was below the median of 4.54 for safeties and could raise concerns about his ability to play single-high in the NFL. Our analysis suggests that he could actually run a 4.44, meaning these concerns should only be minor.
Prepare for the offseason with PFF:
♦ 2022 Free Agency Rankings
♦ 2022 NFL Draft Guide
♦ 2022 NFL Draft Big Board
♦ 2022 NFL Mock Draft Simulator
♦ 2022 NFL QB Annual
♦ NFL & NCAA Player Grades
