• Miles Sanders has the most positive leverage for the CPT spot, with Jalen Hurts and the Eagles DST looking like the best values in the FLEX position among the highest-salaried options.
Estimated reading time: 5 minutes
This season, we'll analyze all of the NFL’s “island” games (TNF, SNF and MNF) and playoff matchups, utilizing PFF’s weekly projections, current betting lines and millions of simulated historical combinations to identify the best and worst values for upcoming Showdown contests.
There are five main components to this DraftKings Showdown slate analysis that you’ll find below:
• A breakdown of methodology and the most similar historical matchup to this game: 2020 Week 15, Baltimore Ravens–New York Giants, with Lamar Jackson as Jalen Hurts and Daniel Jones playing the role of Davis Mills.
• Optimal lineup allocations (CPT and total roster) for both teams based on the results of similar historical matchups.
• Comparison of player ownership projections for FLEX and CPT produced by a model trained on 2018-2022 Showdown contest results to optimal allocations.
• Recent CPT ownership trends illustrated for both starting lineups.
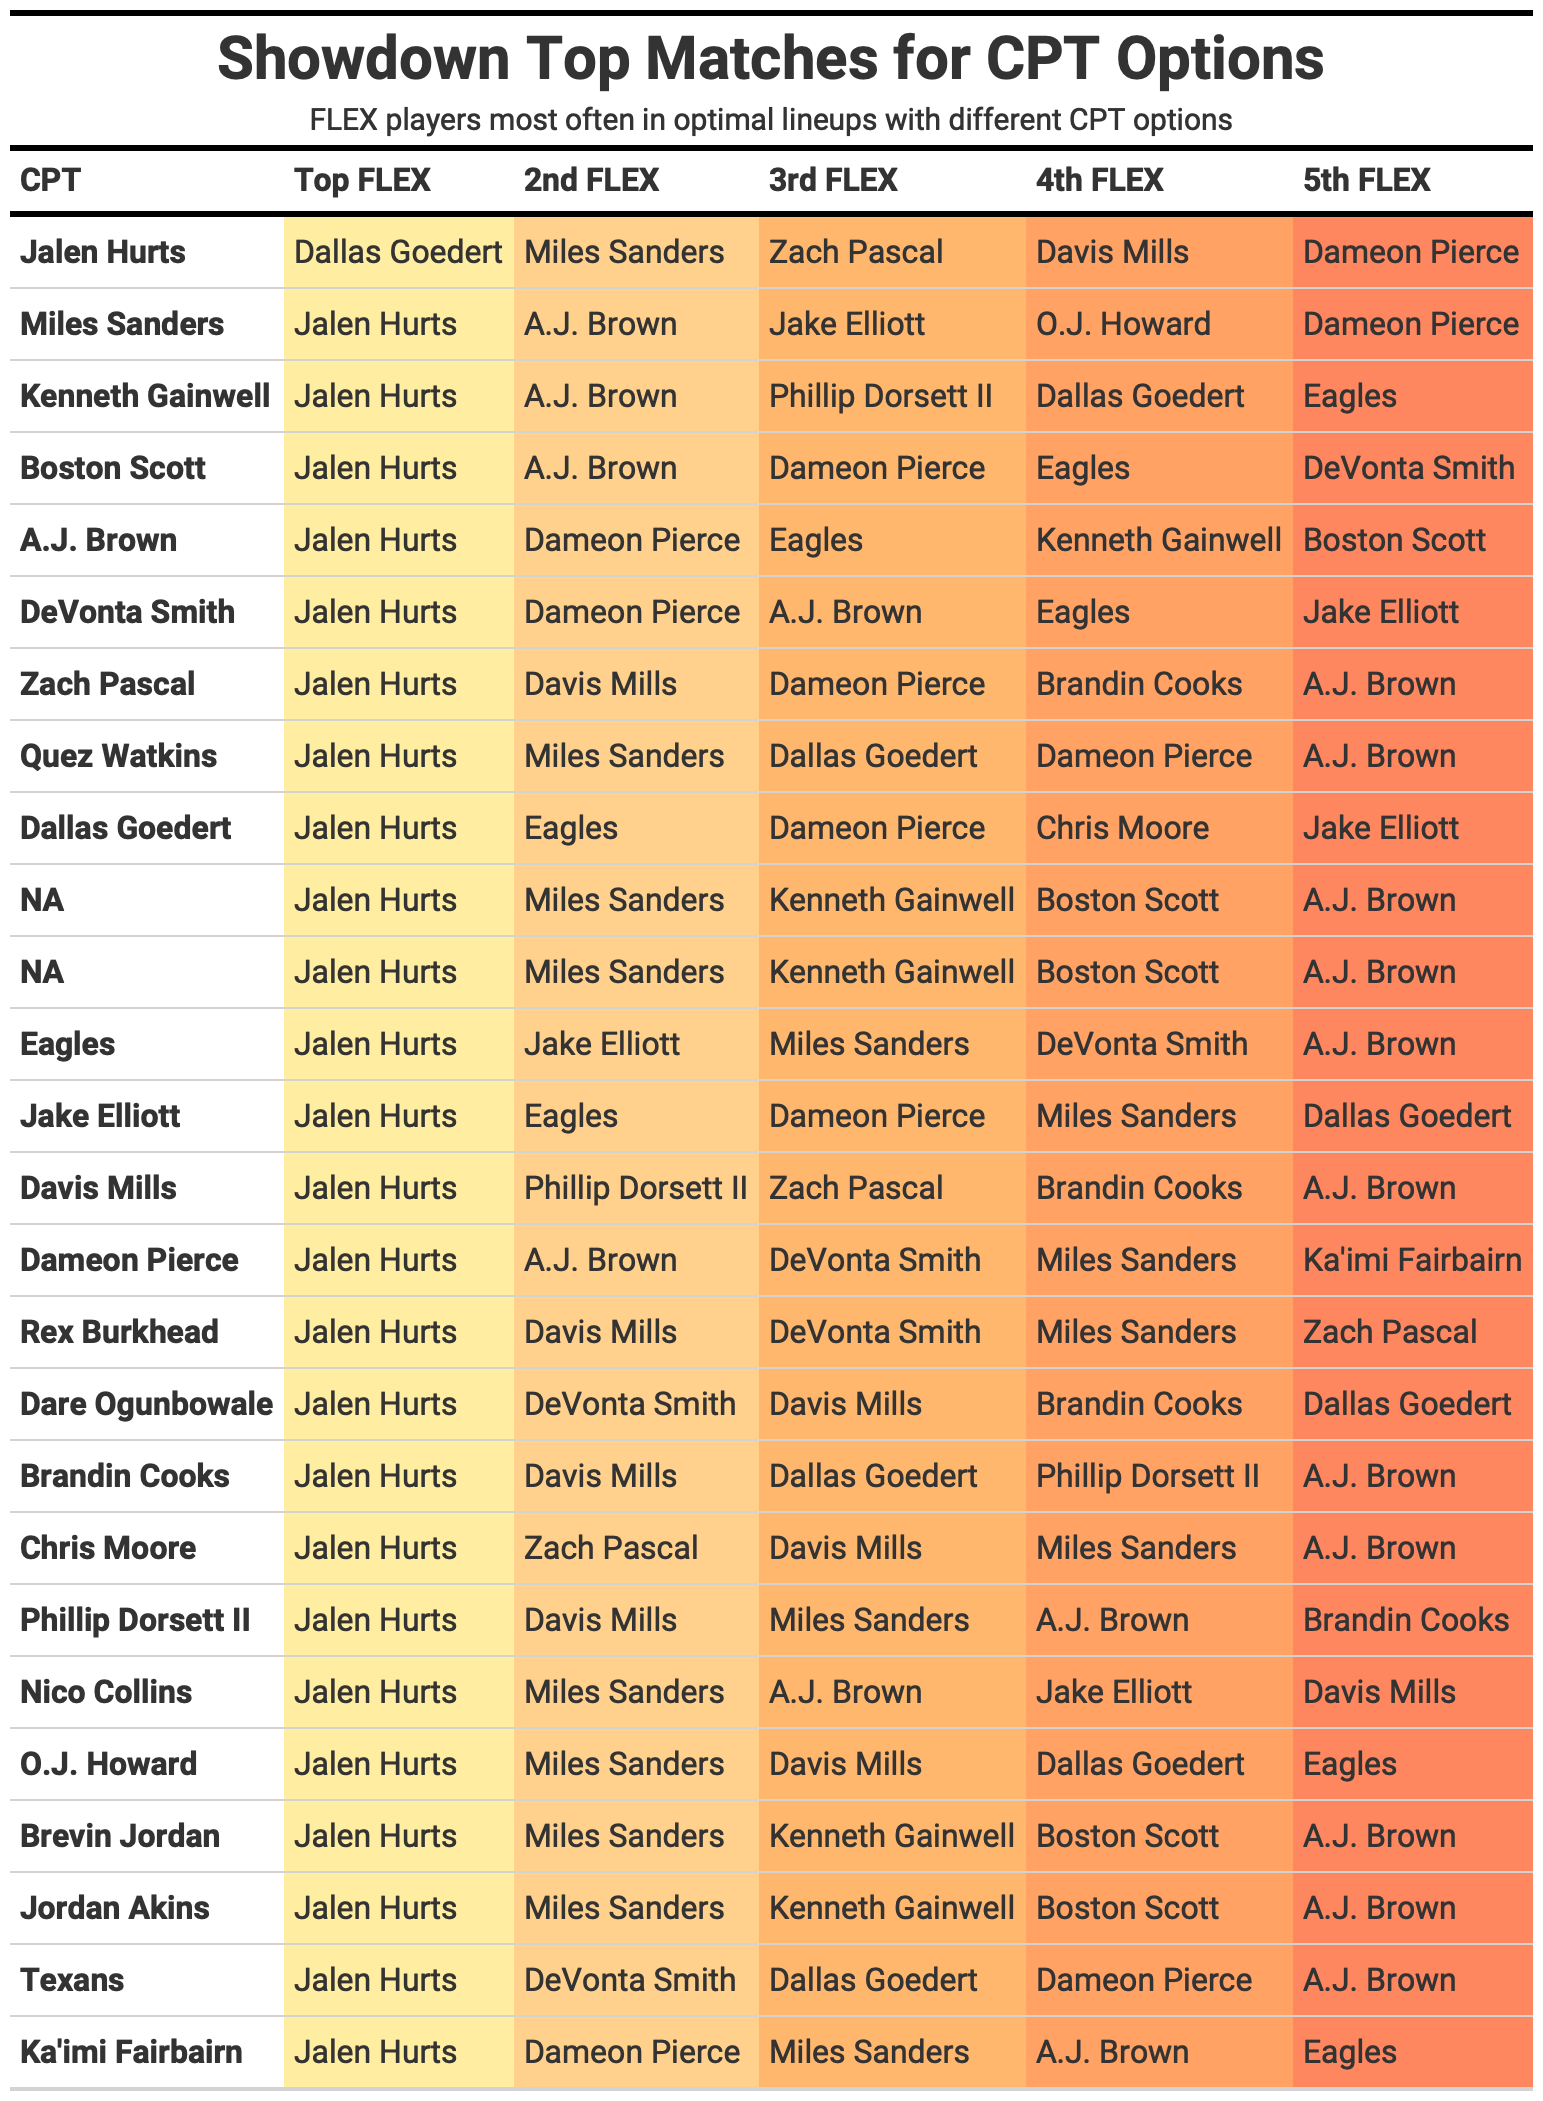
• A table showing the most common players on optimal lineups for each player. This allows you to see which other players are commonly found on the same optimal lineups as a player you’re interested in rostering.

METHODOLOGY
To analyze this specific Showdown slate, I looked through thousands of NFL matchups from 2014 to 2022 and found the closest analogies to this contest according to the following parameters: Betting spread, over/under and average fantasy points scoring for the top-ranked positional players of both rosters (QB1, RB1, WR1, TE1).
I won’t detail every matchup that falls into the top 100 for this game, but for illustration purposes, let’s look at the most similar matchup:
| Historical | Current | ||||
| Player | Pos | Team | Player | Pos | Team |
| Lamar Jackson | QB | BLT | Jalen Hurts | QB | PHI |
| J.K. Dobbins | RB | BLT | Miles Sanders | RB | PHI |
| Marquise Brown | WR | BLT | A.J. Brown | WR | PHI |
| Mark Andrews | TE | BLT | Dallas Goedert | TE | PHI |
| Daniel Jones | QB | NYG | Davis Mills | QB | HOU |
| Wayne Gallman | RB | NYG | Dameon Pierce | RB | HOU |
| Sterling Shepard | WR | NYG | Brandin Cooks | WR | HOU |
| Evan Engram | TE | NYG | O.J. Howard | TE | HOU |
The spread and over/under are similar in these matchups (Ravens -11, 45 O/U versus this matchup at Eagles -14, 45 O/U). All the players aren’t perfect matches, but that’s why we use 100 similar matchups and not just the single most similar.
The optimal roster for that historical matchup, assuming positional salaries equaled what they are for this showdown slate, would have been:
| Player | Team | Position | Roster Position | Fantasy Pts |
| Sterling Shepard | NYG | WR | CPT | 22.7 |
| Lamar Jackson | BLT | QB | FLEX | 22.3 |
| Daniel Jones | NYG | QB | FLEX | 14.4 |
| Gus Edwards | BLT | RB | FLEX | 14.2 |
| Evan Engram | NYG | TE | FLEX | 14.0 |
| J.K. Dobbins | BLT | RB | FLEX | 13.7 |
For this game and 99 other similar matchups, I calculated every possible combination that fits with Showdown rules (one CPT, at least one offensive player from each team) and would fall under the $50K salary threshold, assuming the salaries for the historical similar matchups are the same as those for this contest.
CHOOSING THE RIGHT CAPTAIN
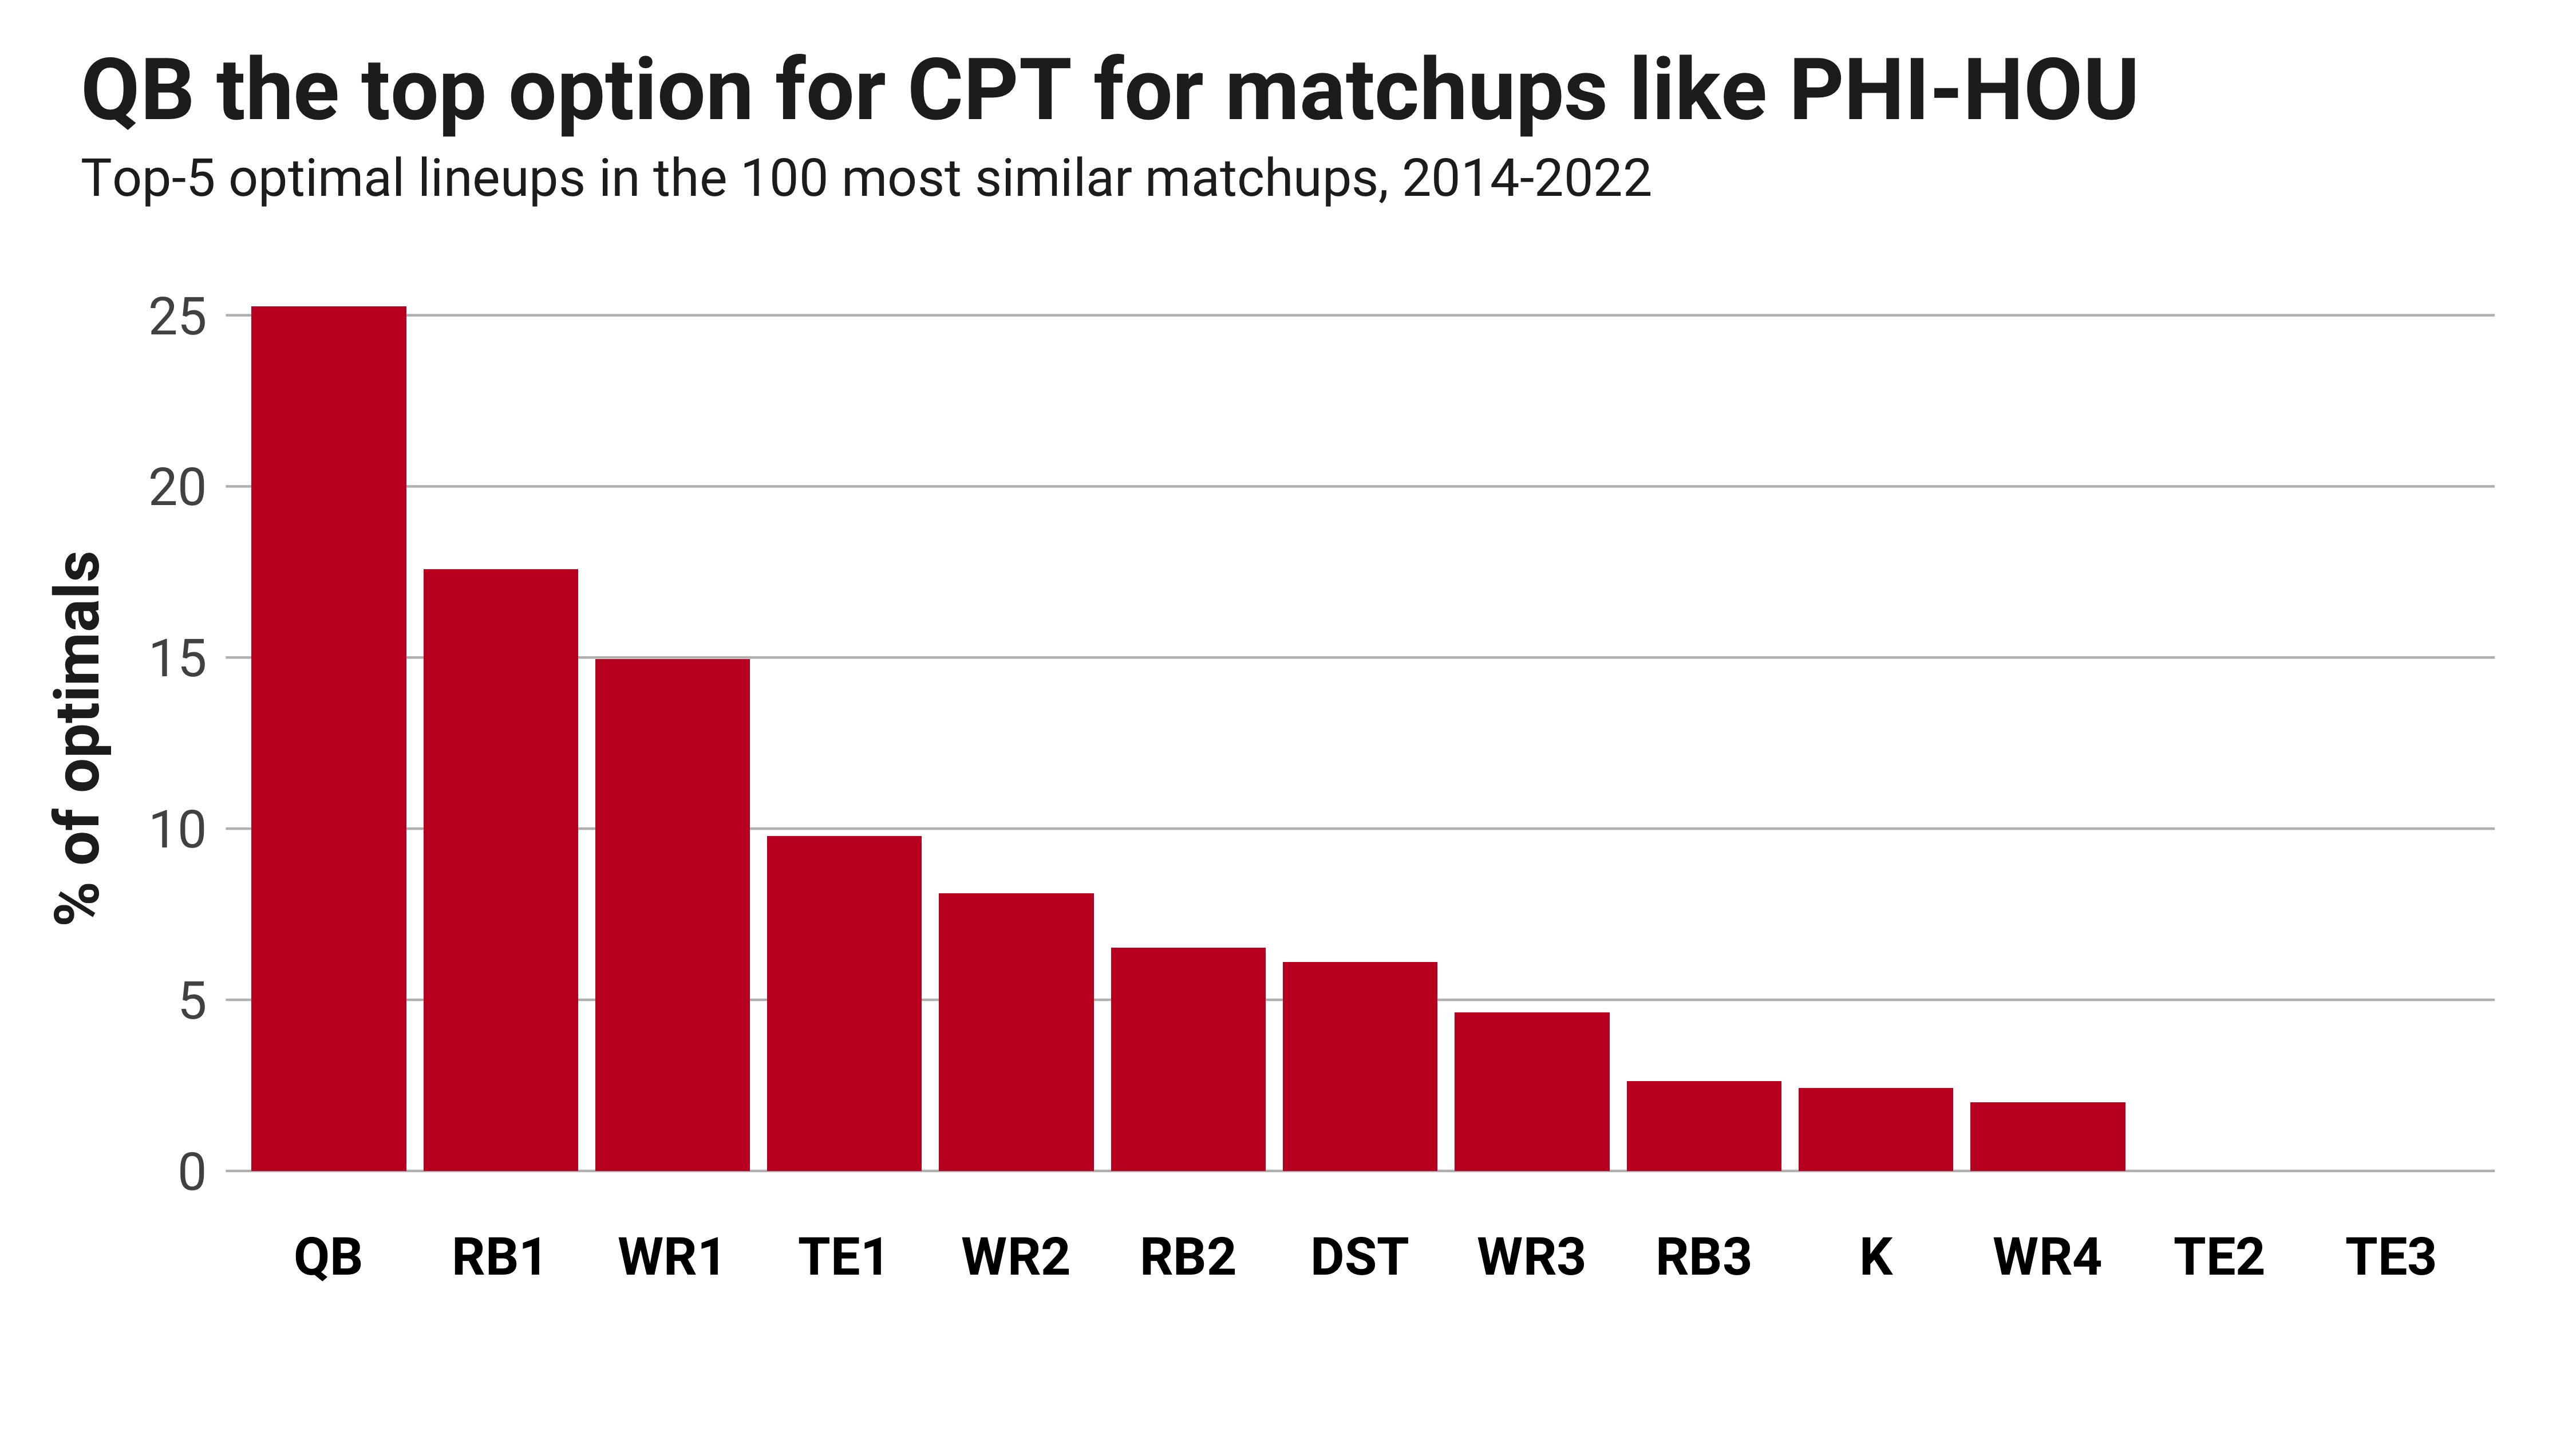
The most unique part of the format, and therefore the biggest opportunity for a competitive advantage, is choosing your CPT. Should you always choose a QB who typically has the highest absolute fantasy scoring? Are defenses and kickers viable options? RB versus WR?
I went through the millions of possible lineup combinations for the 100 most similar matchups and found who the CPT selections were on the top-five scoring lineups for each matchup. Here are the 500 CPT choices from those matchups by position rank according to salary.
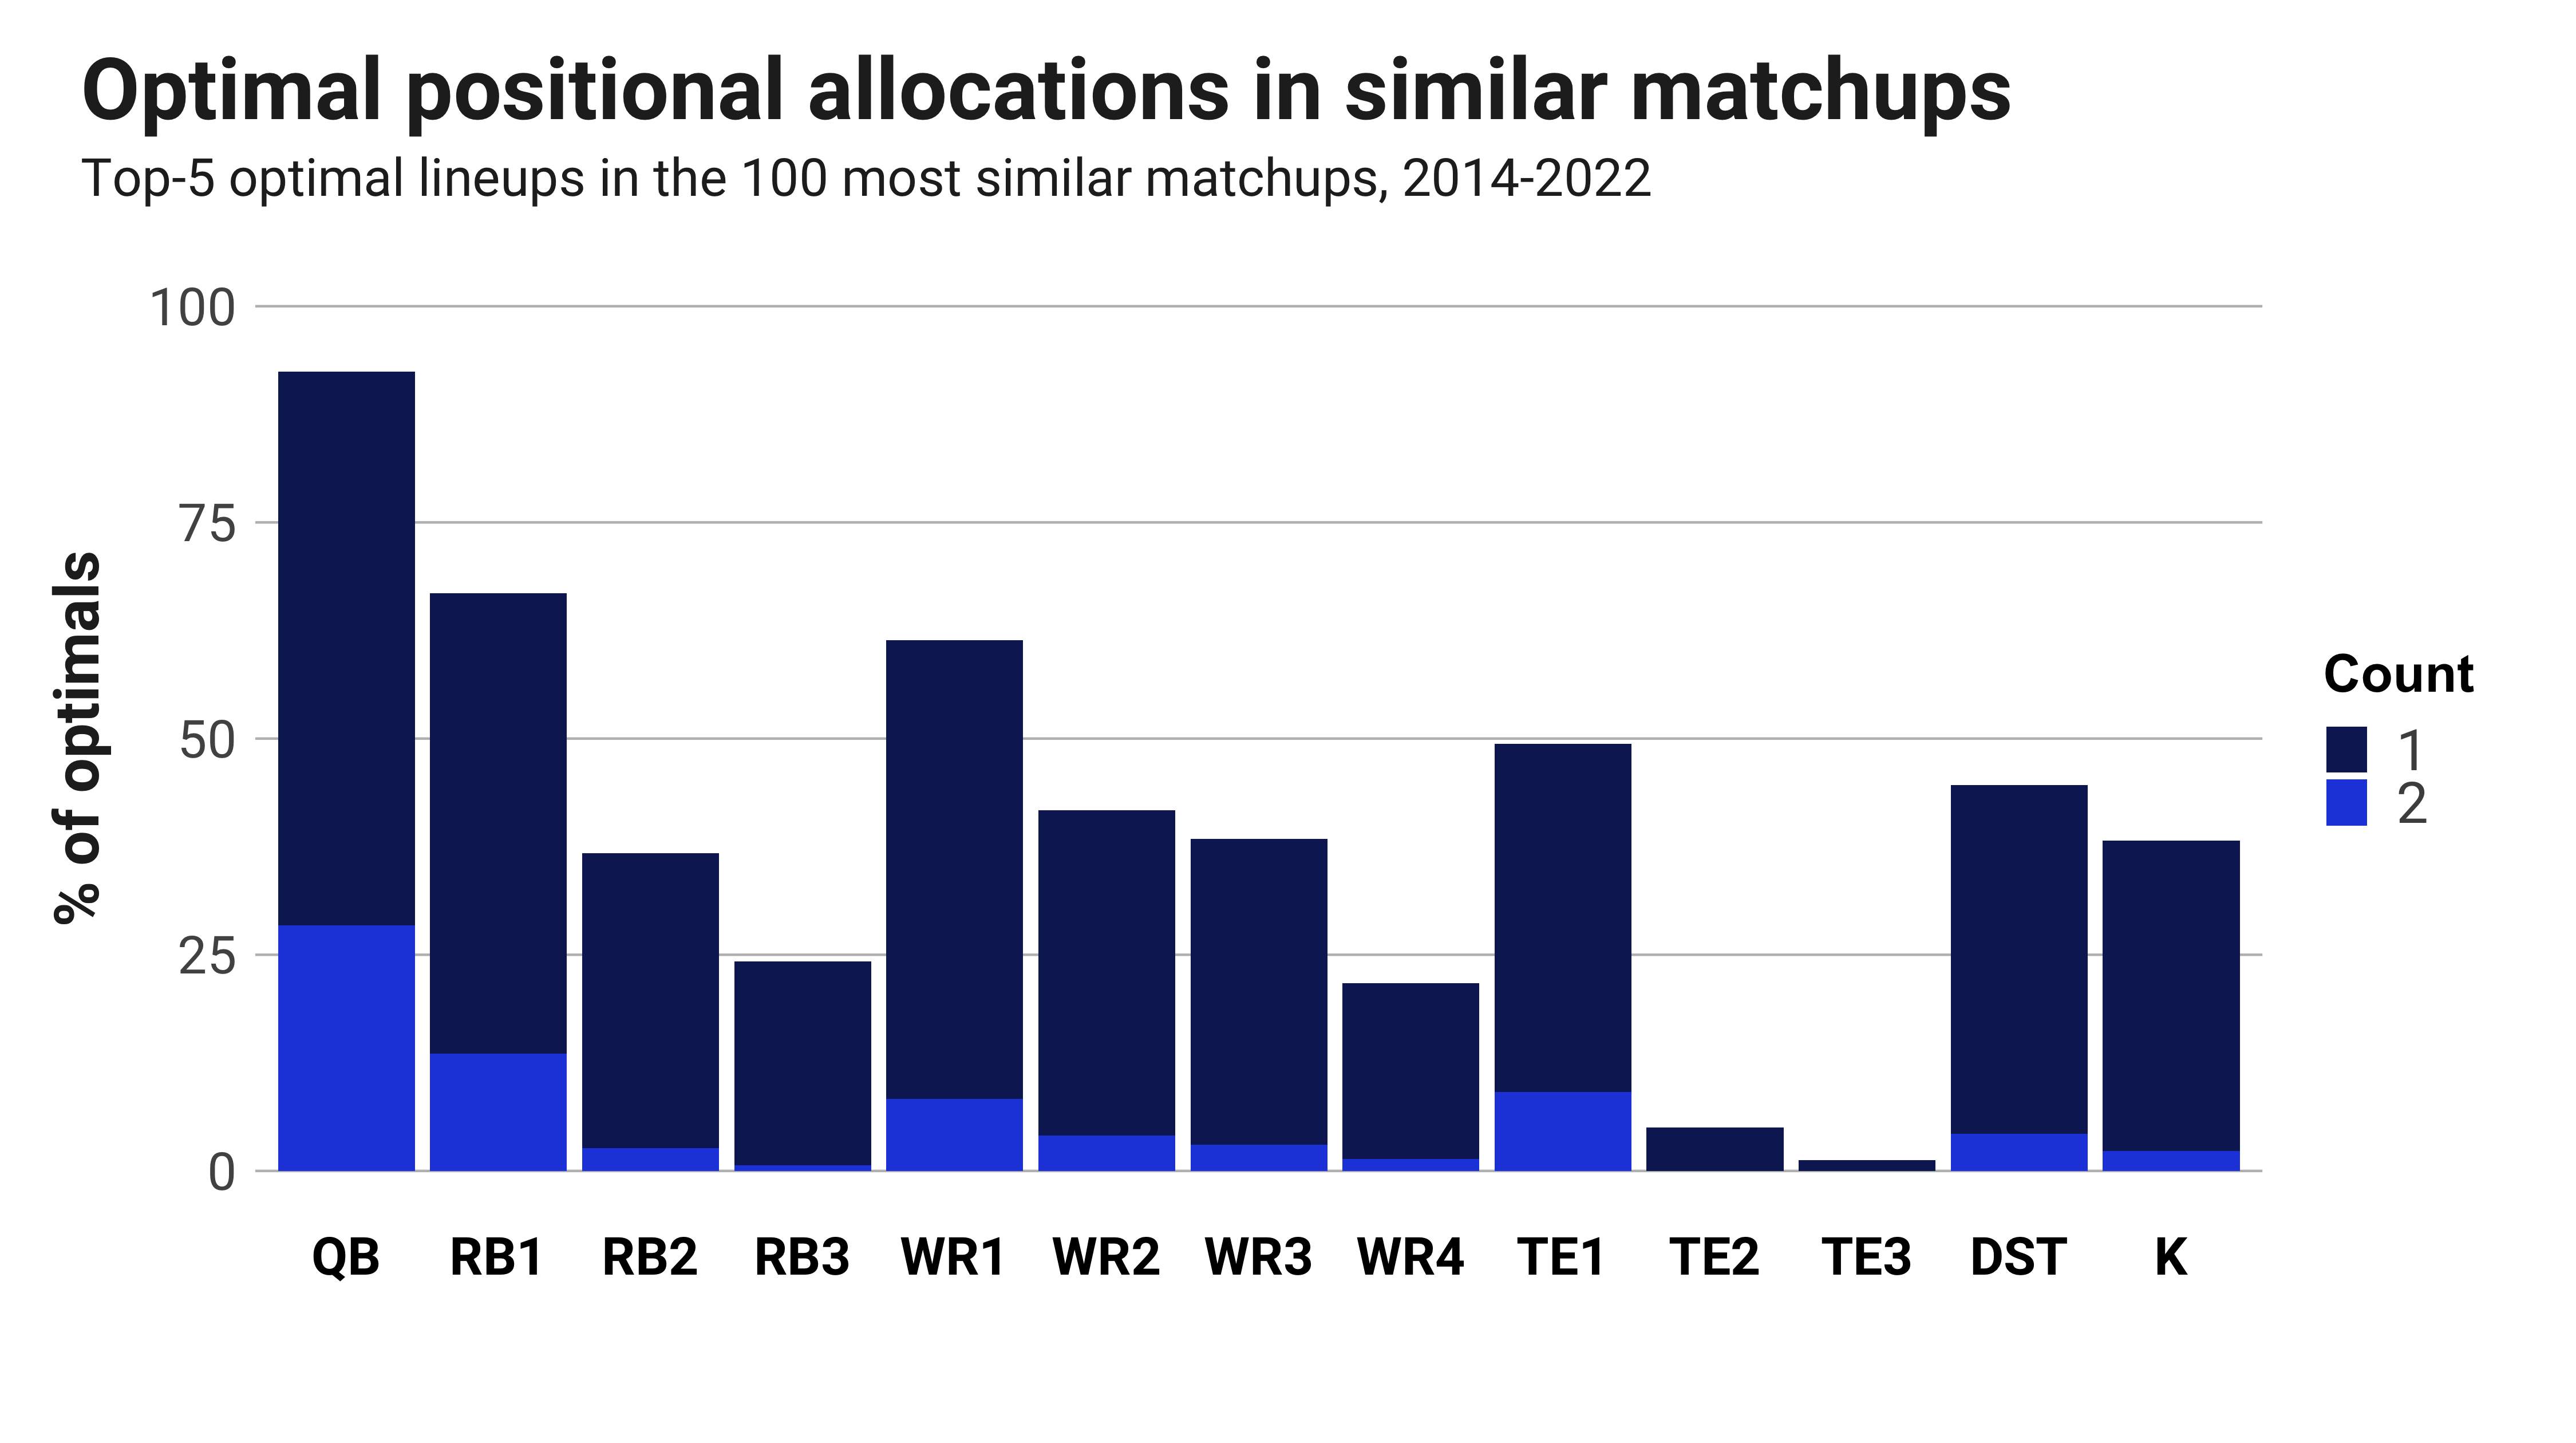
BREAKING DOWN TOTAL OPTIMAL ROSTERS
This graph illustrates the full range of allocations for the different positions to measure how many of the 500 optimal rosters had exactly zero, one or two of the given positions.
HISTORICAL OWNERSHIP
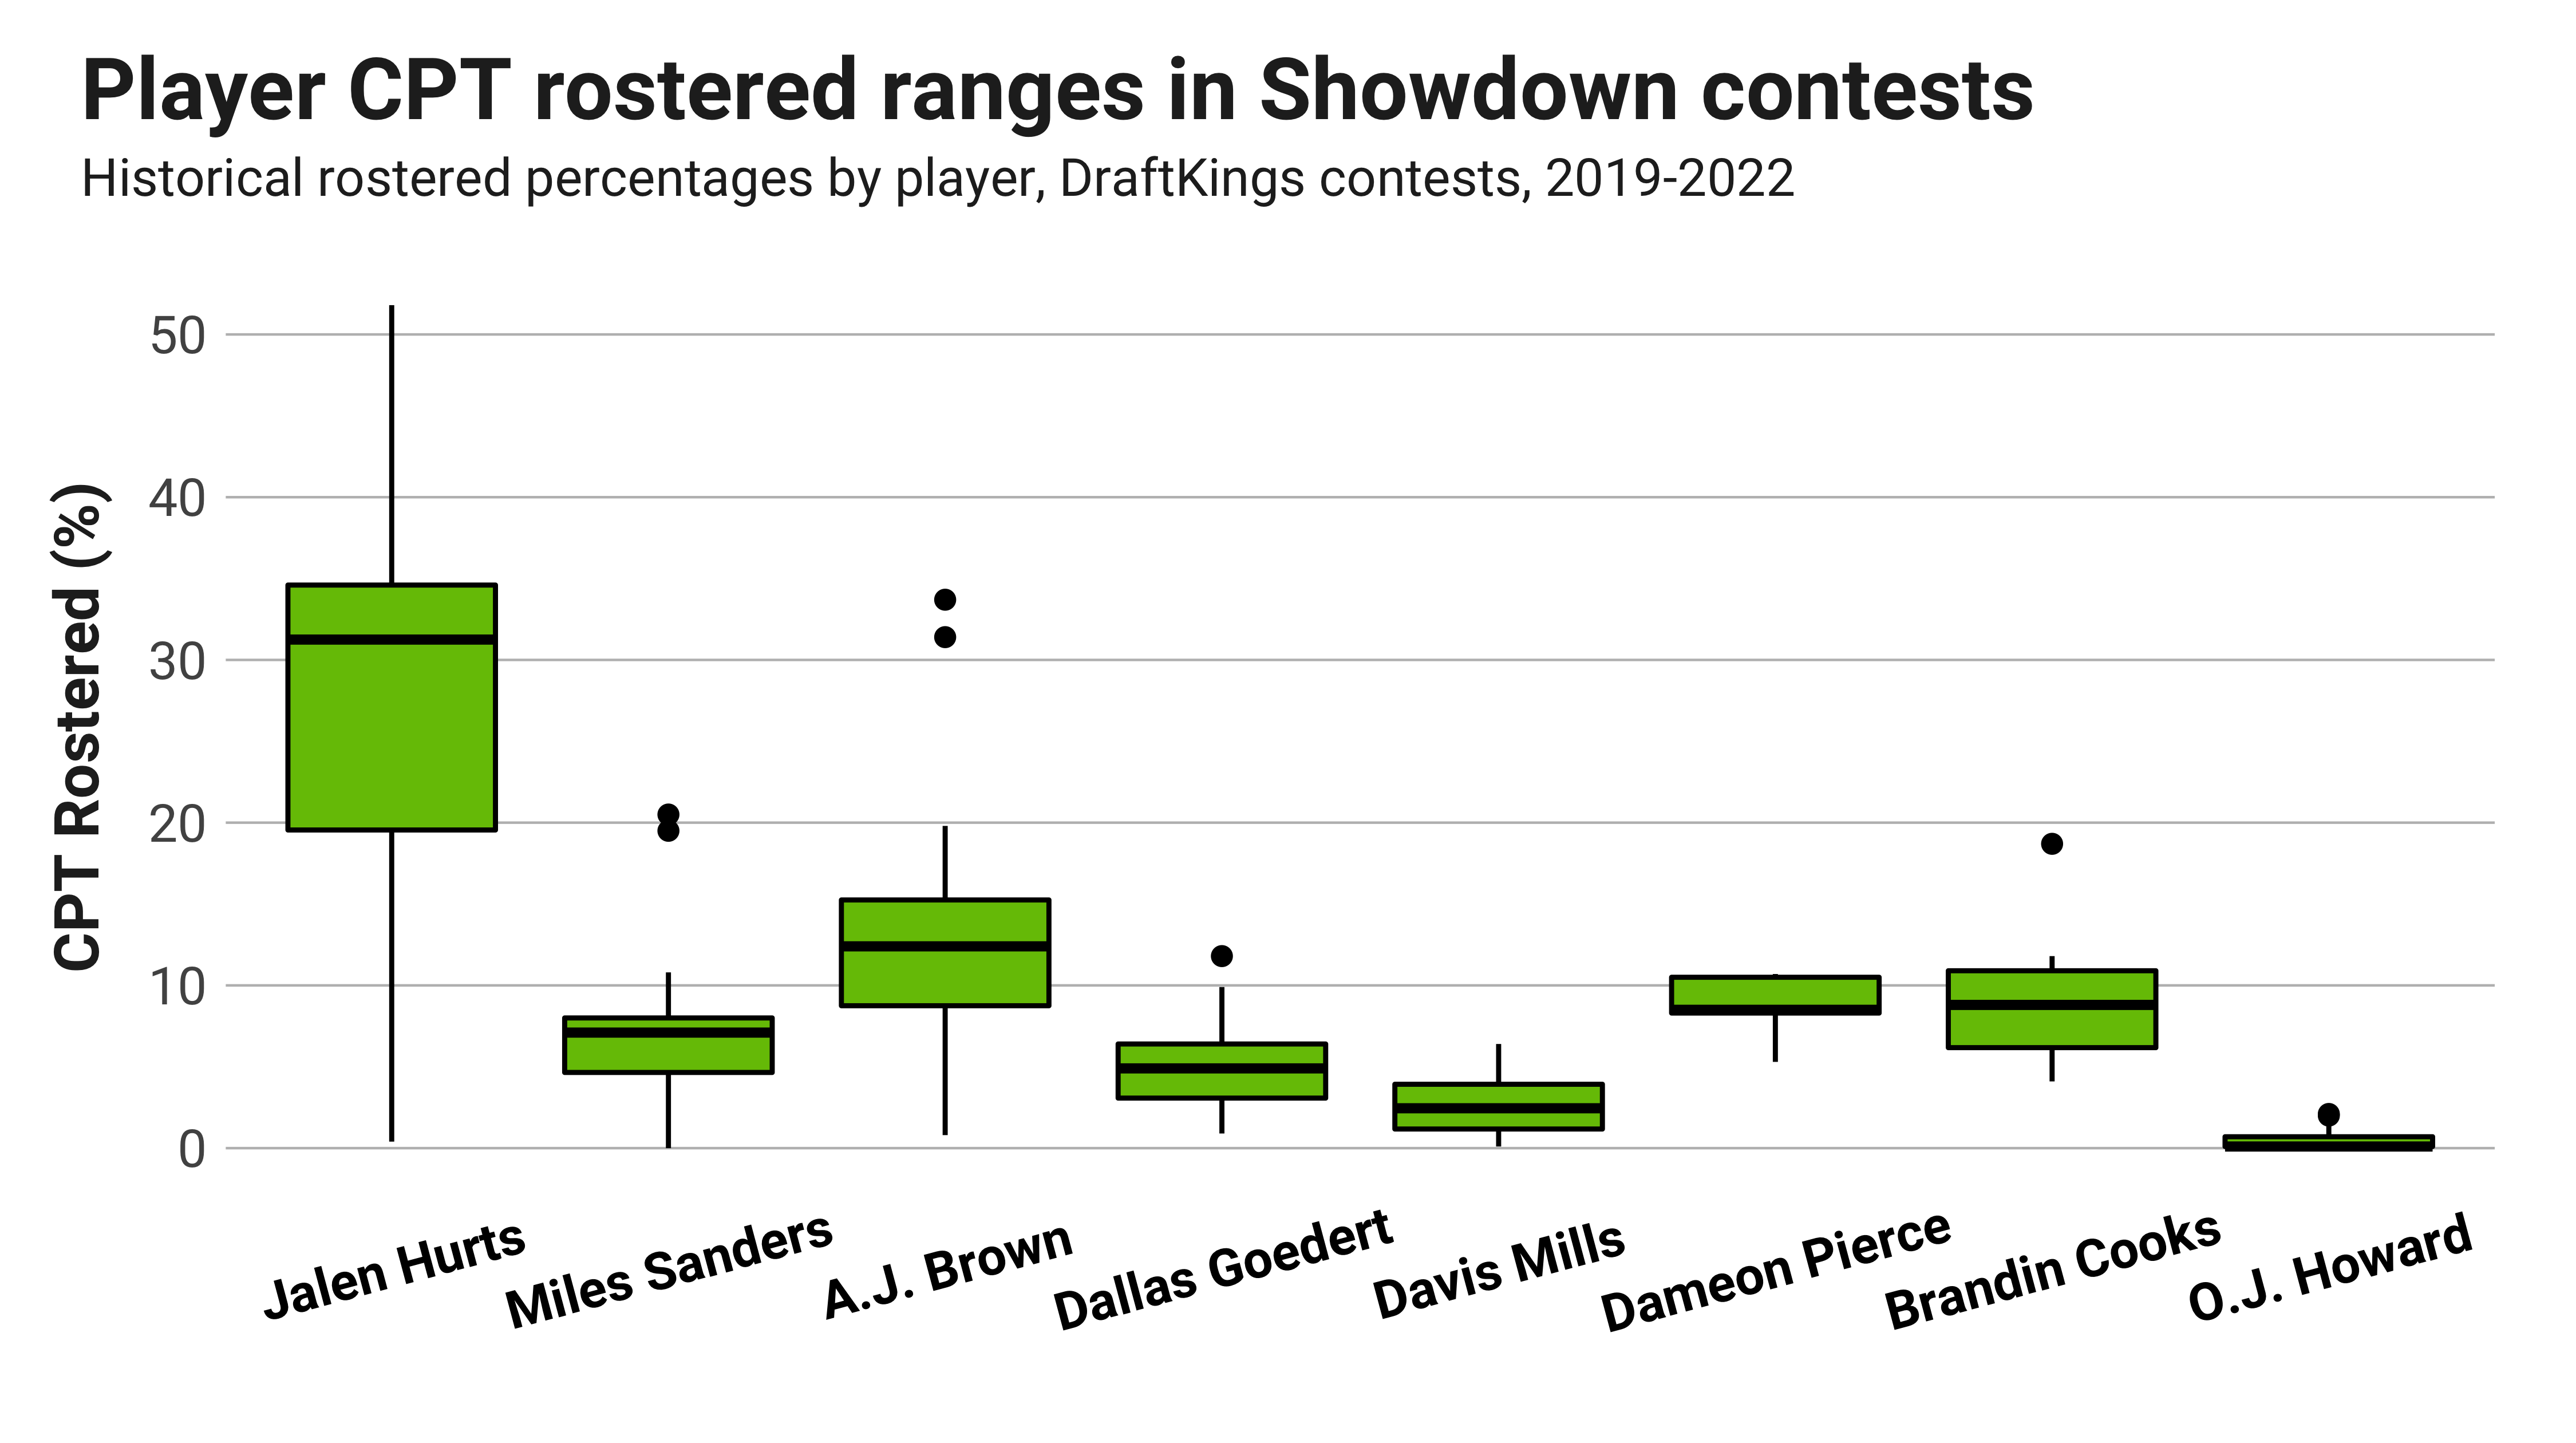
The boxplot above shows the ranges for CPT ownership for each starting player in contests since 2019.
Projected ownership versus optimal
This is where the analysis comes together and becomes actionable. What’s most important when viewing these numbers is to contrast them to the optimal numbers taken from the analysis above for different positions. Then, we see where the leverage may exist.
The two tables below compare the optimal allocations above, with adjustments for the personnel of this particular matchup, to our ownership projections for CPT and FLEX.
DRAFTKINGS SHOWDOWN CAPTAIN
| Player | Team | Pos | Salary | Optimal | Ownership | Diff | Leverage |
| Jalen Hurts | PHI | QB | $17,700 | 30.7% | 31.0% | -0.3% | 99% |
| A.J. Brown | PHI | WR | $16,800 | 12.2% | 12.9% | -0.7% | 95% |
| Miles Sanders | PHI | RB | $15,600 | 8.3% | 7.0% | 1.3% | 119% |
| Davis Mills | HOU | QB | $13,500 | 5.2% | 5.5% | -0.3% | 95% |
| Dameon Pierce | HOU | RB | $12,900 | 9.3% | 9.6% | -0.3% | 97% |
| DeVonta Smith | PHI | WR | $12,300 | 7.4% | 7.7% | -0.3% | 96% |
| Brandin Cooks | HOU | WR | $10,800 | 6.0% | 6.4% | -0.4% | 94% |
| Eagles | PHI | DST | $10,500 | 4.5% | 4.4% | 0.1% | 102% |
| Dallas Goedert | PHI | TE | $9,900 | 5.2% | 4.9% | 0.3% | 106% |
| Chris Moore | HOU | WR | $8,100 | 1.0% | 0.7% | 0.3% | 143% |
| Kenneth Gainwell | PHI | RB | $7,500 | 0.7% | 0.5% | 0.2% | 140% |
| Jake Elliott | PHI | K | $7,200 | 1.1% | 0.9% | 0.2% | 122% |
| Rex Burkhead | HOU | RB | $6,900 | 0.6% | 0.5% | 0.1% | 120% |
| Phillip Dorsett II | HOU | WR | $6,000 | 0.5% | 0.4% | 0.1% | 125% |
| Ka'imi Fairbairn | HOU | K | $5,700 | 0.7% | 0.8% | -0.1% | 88% |
| Texans | HOU | DST | $4,800 | 0.6% | 0.7% | -0.1% | 90% |
| Zach Pascal | PHI | WR | $4,200 | 1.0% | 0.8% | 0.2% | 125% |
| Nico Collins | HOU | WR | $3,600 | 1.4% | 1.5% | -0.1% | 93% |
| Dare Ogunbowale | HOU | RB | $3,000 | 0.5% | 0.6% | -0.1% | 88% |
| Boston Scott | PHI | RB | $2,700 | 0.5% | 0.4% | 0.1% | 125% |
| O.J. Howard | HOU | TE | $2,400 | 0.8% | 0.8% | 0.0% | 100% |
| Quez Watkins | PHI | WR | $2,100 | 0.6% | 0.5% | 0.1% | 120% |
| Brevin Jordan | HOU | TE | $1,500 | 0.6% | 0.9% | -0.3% | 67% |
| Jordan Akins | HOU | TE | $1,200 | 0.3% | 0.4% | -0.1% | 75% |
| Troy Hairston | HOU | RB | $600 | 0.1% | 0.1% | 0.0% | 100% |
| Mason Schreck | HOU | TE | $300 | 0.1% | 0.1% | 0.0% | 100% |
DRAFTKINGS SHOWDOWN FLEX
| Player | Team | Pos | Salary | Optimal | Ownership | Diff | Leverage |
| Jalen Hurts | PHI | QB | $11,800 | 55.2% | 52.8% | 2.4% | 104.5% |
| A.J. Brown | PHI | WR | $11,200 | 45.9% | 48.3% | -2.4% | 95.0% |
| Miles Sanders | PHI | RB | $10,400 | 35.9% | 36.6% | -0.7% | 98.1% |
| Davis Mills | HOU | QB | $9,000 | 32.0% | 32.5% | -0.5% | 98.5% |
| Dameon Pierce | HOU | RB | $8,600 | 37.3% | 38.5% | -1.2% | 96.9% |
| DeVonta Smith | PHI | WR | $8,200 | 35.5% | 38.5% | -3.0% | 92.2% |
| Brandin Cooks | HOU | WR | $7,200 | 29.8% | 30.5% | -0.7% | 97.6% |
| Eagles | PHI | DST | $7,000 | 27.0% | 26.0% | 1.0% | 103.8% |
| Dallas Goedert | PHI | TE | $6,600 | 26.4% | 25.9% | 0.5% | 101.9% |
| Chris Moore | HOU | WR | $5,400 | 15.2% | 14.7% | 0.5% | 103.4% |
| Kenneth Gainwell | PHI | RB | $5,000 | 10.1% | 8.1% | 2.0% | 124.7% |
| Jake Elliott | PHI | K | $4,800 | 20.9% | 19.5% | 1.4% | 107.2% |
| Rex Burkhead | HOU | RB | $4,600 | 12.5% | 11.8% | 0.7% | 105.9% |
| Phillip Dorsett II | HOU | WR | $4,000 | 7.5% | 6.8% | 0.7% | 110.3% |
| Ka'imi Fairbairn | HOU | K | $3,800 | 18.8% | 20.7% | -1.9% | 90.8% |
| Texans | HOU | DST | $3,200 | 7.5% | 6.9% | 0.6% | 108.7% |
| Zach Pascal | PHI | WR | $2,800 | 15.5% | 14.5% | 1.0% | 106.9% |
| Nico Collins | HOU | WR | $2,400 | 20.2% | 22.2% | -2.0% | 91.0% |
| Dare Ogunbowale | HOU | RB | $2,000 | 1.0% | 0.8% | 0.2% | 125.0% |
| Boston Scott | PHI | RB | $1,800 | 2.5% | 1.0% | 1.5% | 250.0% |
| O.J. Howard | HOU | TE | $1,600 | 13.5% | 12.3% | 1.2% | 109.8% |
| Quez Watkins | PHI | WR | $1,400 | 3.5% | 2.4% | 1.1% | 145.8% |
| Brevin Jordan | HOU | TE | $1,000 | 16.5% | 17.7% | -1.2% | 93.2% |
| Jordan Akins | HOU | TE | $800 | 8.6% | 9.6% | -1.0% | 89.6% |
| Troy Hairston | HOU | RB | $400 | 0.5% | 0.6% | -0.1% | 83.3% |
| Mason Schreck | HOU | TE | $200 | 0.7% | 0.8% | -0.1% | 87.5% |
Common optimal lineup matches
The table below lists each player and the five most commonly found players found on optimal lineups with each CPT option.