• Simulations and projections assume that Rams wide receiver Van Jefferson will not play.
• Josh Allen and Cooper Kupp are two of the most rostered players in Showdown contests. Kupp shows positive leverage as the CPT selection, while Allen is a better FLEX choice.
• Darrell Henderson projects as the most valuable mid-tier FLEX option.
Estimated reading time: 6 minutes
The changing DFS and fantasy football landscape is shifting toward single-game contests. At DraftKings Sportsbook, the biggest is their Showdown Captain Mode format. The format blends the ease of focusing on a single game with the ability to differentiate yourself from the competition by choosing six players.
You must choose one captain (CPT), who costs and is scored at 1.5 times the standard values. The CPT designation opens up another layer of strategy while exponentially increasing the number of possible lineup combinations, which is important for reducing duplicate winners and split prizes. I wrote a primer on playing this format, with details on historical positional trends and salary usage.
This season, I’m going to analyze all of the NFL’s “island” games (TNF, SNF and MNF) and playoff matchups, utilizing PFF’s weekly projections, current betting lines and millions of simulated historical combinations to identify the best and worst values for an upcoming matchup.
There are five main components to this Showdown slate analysis that you’ll find below:
• A breakdown of methodology and the most similar historical matchup to this game: 2014 Week 5 Indianapolis Colts–Baltimore Ravens, featuring Andrew Luck as Josh Allen and Steve Smith Sr. as Cooper Kupp.
• Optimal lineup allocations (CPT and total roster) for both teams based on the results of similar historical matchups.
• Comparison of player ownership projections for FLEX and CPT, produced by a model trained on 2018-2022 Showdown contest results to optimal allocations.
• Recent CPT ownership trends for both starting lineups.
• A table showing the most common players on optimal lineups for each player. This allows you to see which other players are commonly found on the same optimal lineups as a player you’re interested in rostering.
The optimal roster
To analyze this specific Showdown slate, I looked through thousands of NFL matchups from 2014 to 2022 and found the closest analogies to this contest according to the following parameters: Betting spread, over/under and average fantasy points scoring for the top-ranked positional players of both rosters (QB1, RB1, WR1, TE1).
I won’t detail every matchup that falls into the top 100 for this game, but for illustration purposes, let’s look at the most similar matchup:
| Historical | Current | ||||
| Player | Pos | Team | Player | Pos | Team |
| Andrew Luck | QB | IND | Josh Allen | QB | BUF |
| Ahmad Bradshaw | RB | IND | Devin Singletary | RB | BUF |
| Reggie Wayne | WR | IND | Stefon Diggs | WR | BUF |
| Dwayne Allen | TE | IND | Dawson Knox | TE | BUF |
| Joe Flacco | QB | BLT | Matthew Stafford | QB | LAR |
| Justin Forsett | RB | BLT | Cam Akers | RB | LAR |
| Steve Smith | WR | BLT | Cooper Kupp | WR | LAR |
| Owen Daniels | TE | BLT | Tyler Higbee | TE | LAR |
The spread and over/under are similar in these matchups (Colts -2.5, 49.5 O/U versus this matchup at Bills -2.5, 52 O/U). All the players aren’t perfect matches, but that’s why we use 100 similar matchups and not just the single most similar.
The optimal roster for that historical matchup, assuming positional salaries equaled what they are for this showdown slate, would have been:
| Player | Team | Position | Roster Position | Fantasy Pts |
| Andrew Luck | IND | QB | CPT | 24.7 |
| Justin Forsett | BLT | RB | FLEX | 22.7 |
| T.Y. Hilton | IND | WR | FLEX | 18.1 |
| Dwayne Allen | IND | TE | FLEX | 15.9 |
| Reggie Wayne | IND | WR | FLEX | 14.7 |
| Ahmad Bradshaw | IND | RB | FLEX | 12.5 |
For this game and 99 other similar matchups, I calculated every possible combination that fits with Showdown rules (one CPT, at least one offensive player from each team) and would fall under the $50K salary threshold, assuming the salaries for the historical similar matchups are the same as those for this contest.
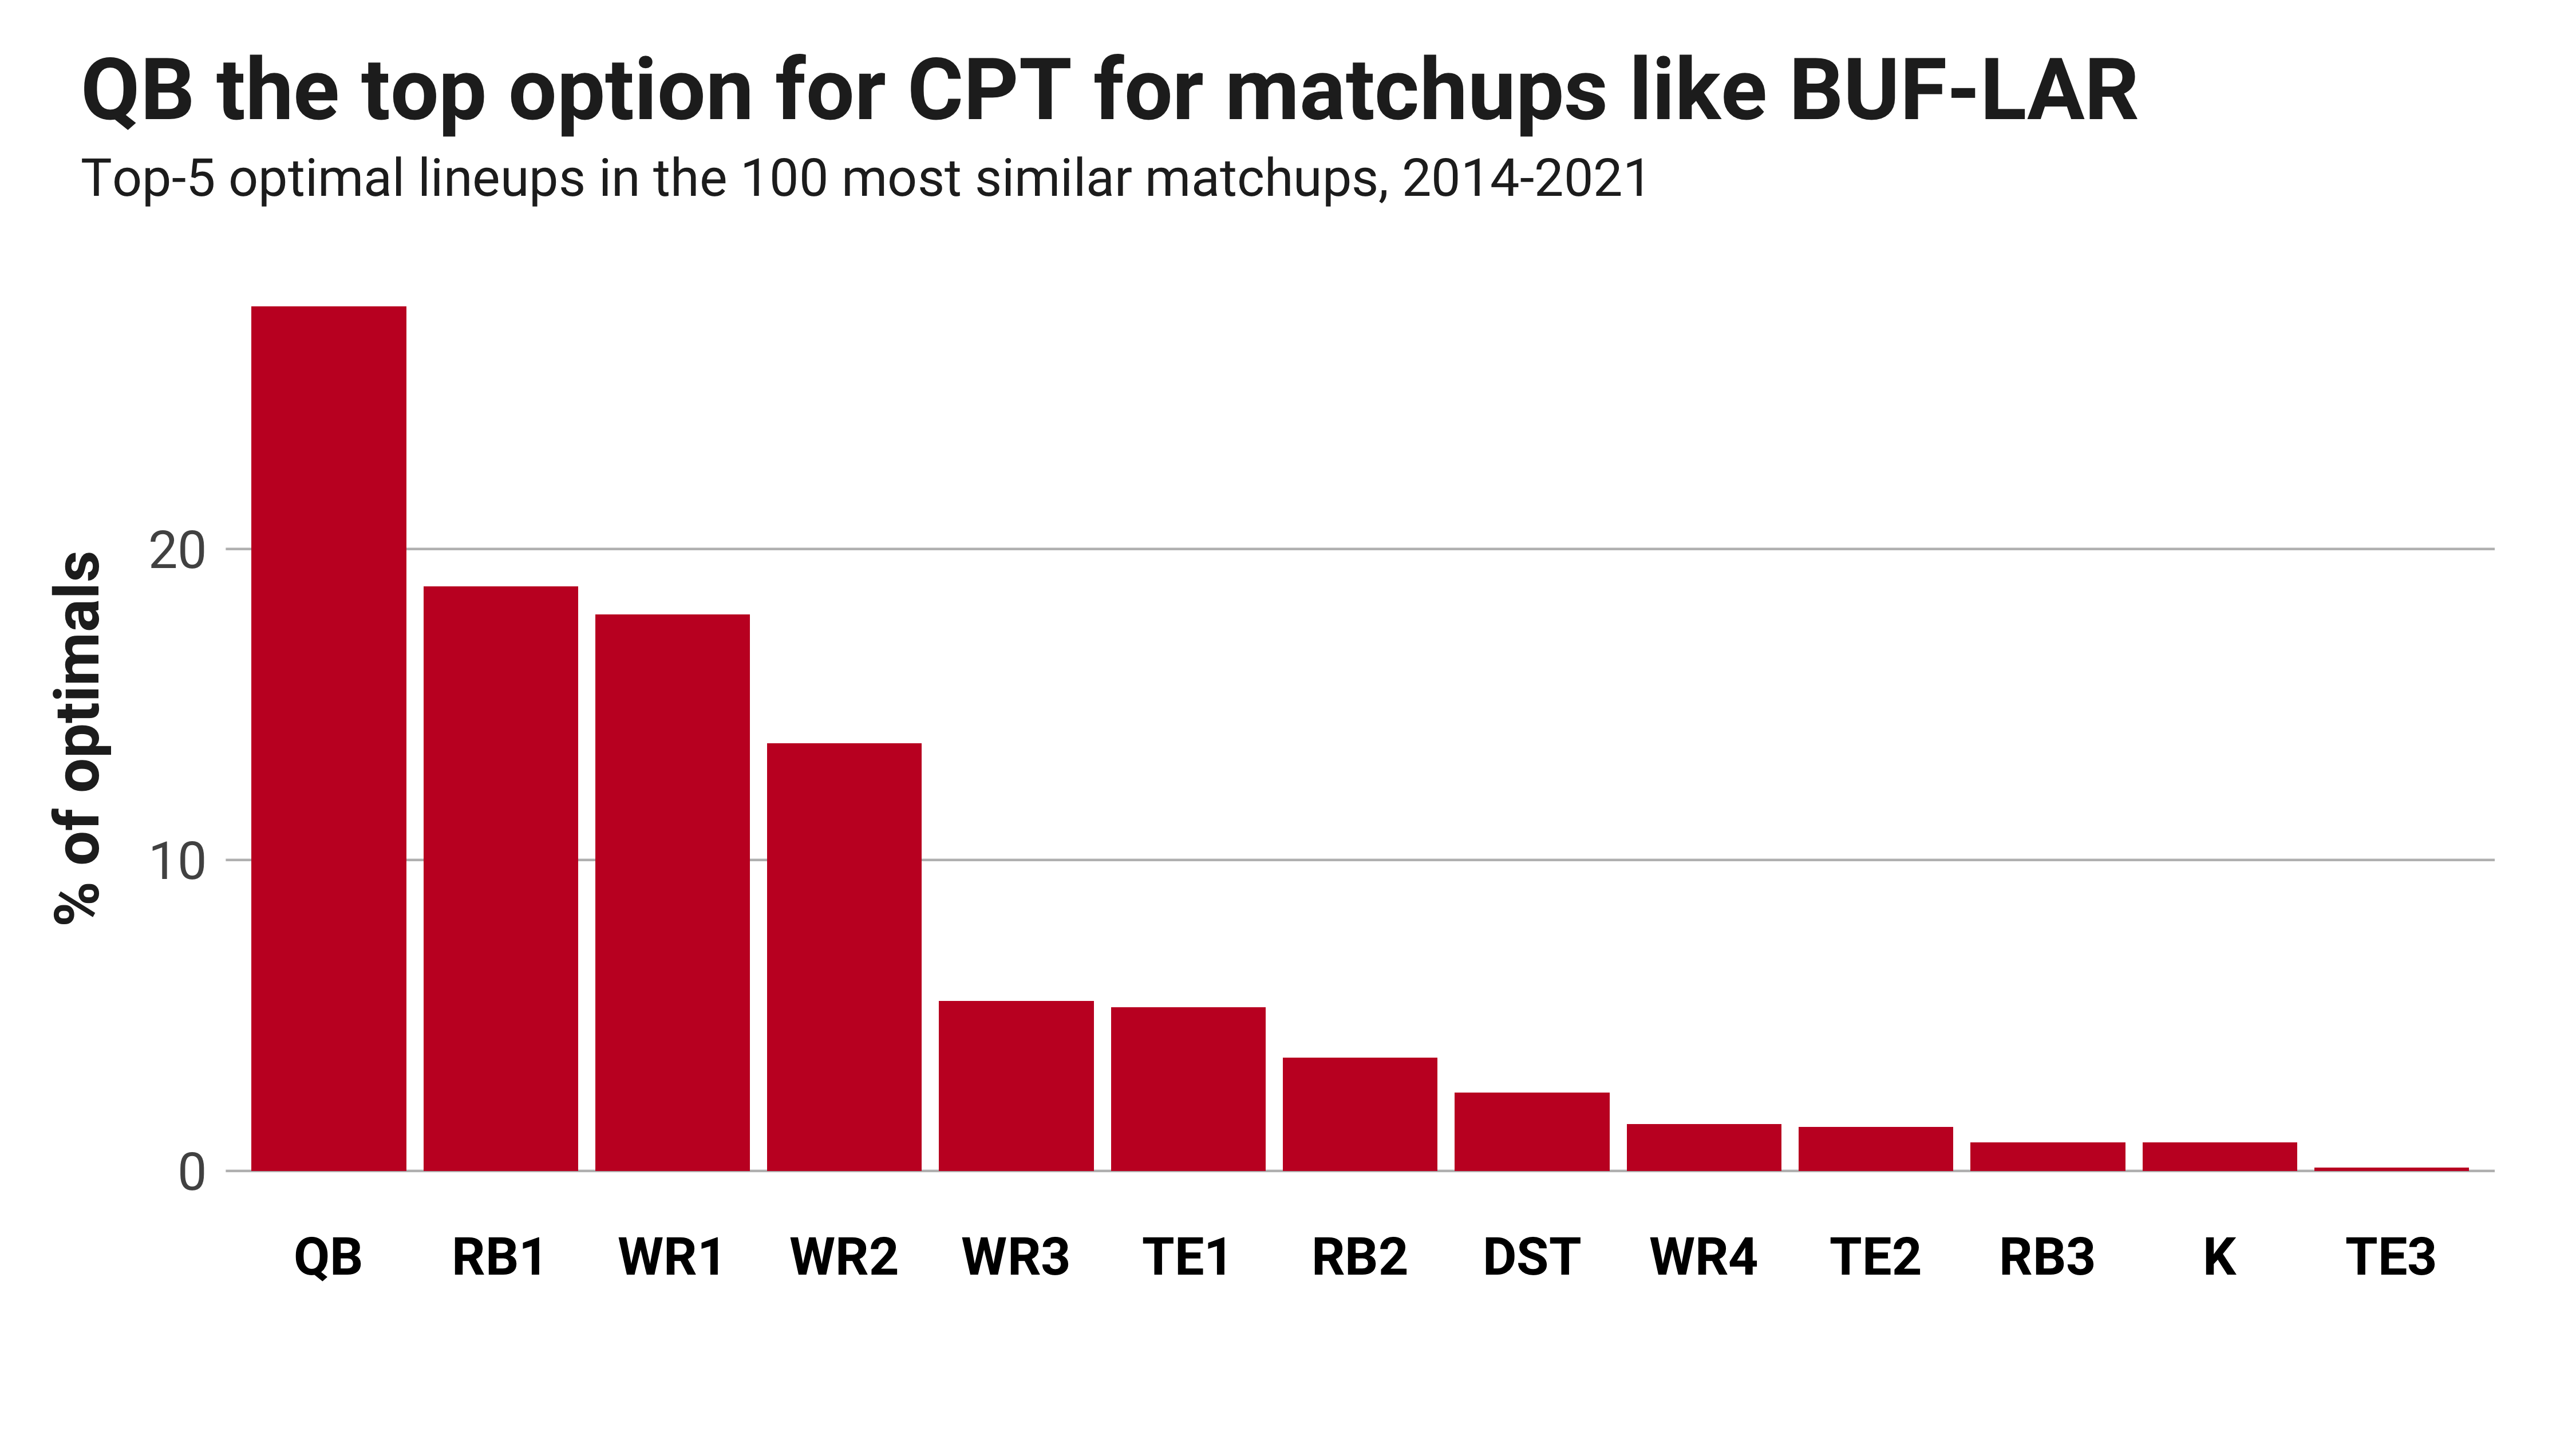
CHOOSING THE RIGHT CAPTAIN
I went through the millions of possible lineup combinations for the 100 most similar matchups and found who the CPT selections were on the top-five scoring lineups for each matchup. Here are the 500 CPT choices from those matchups by position rank according to salary.
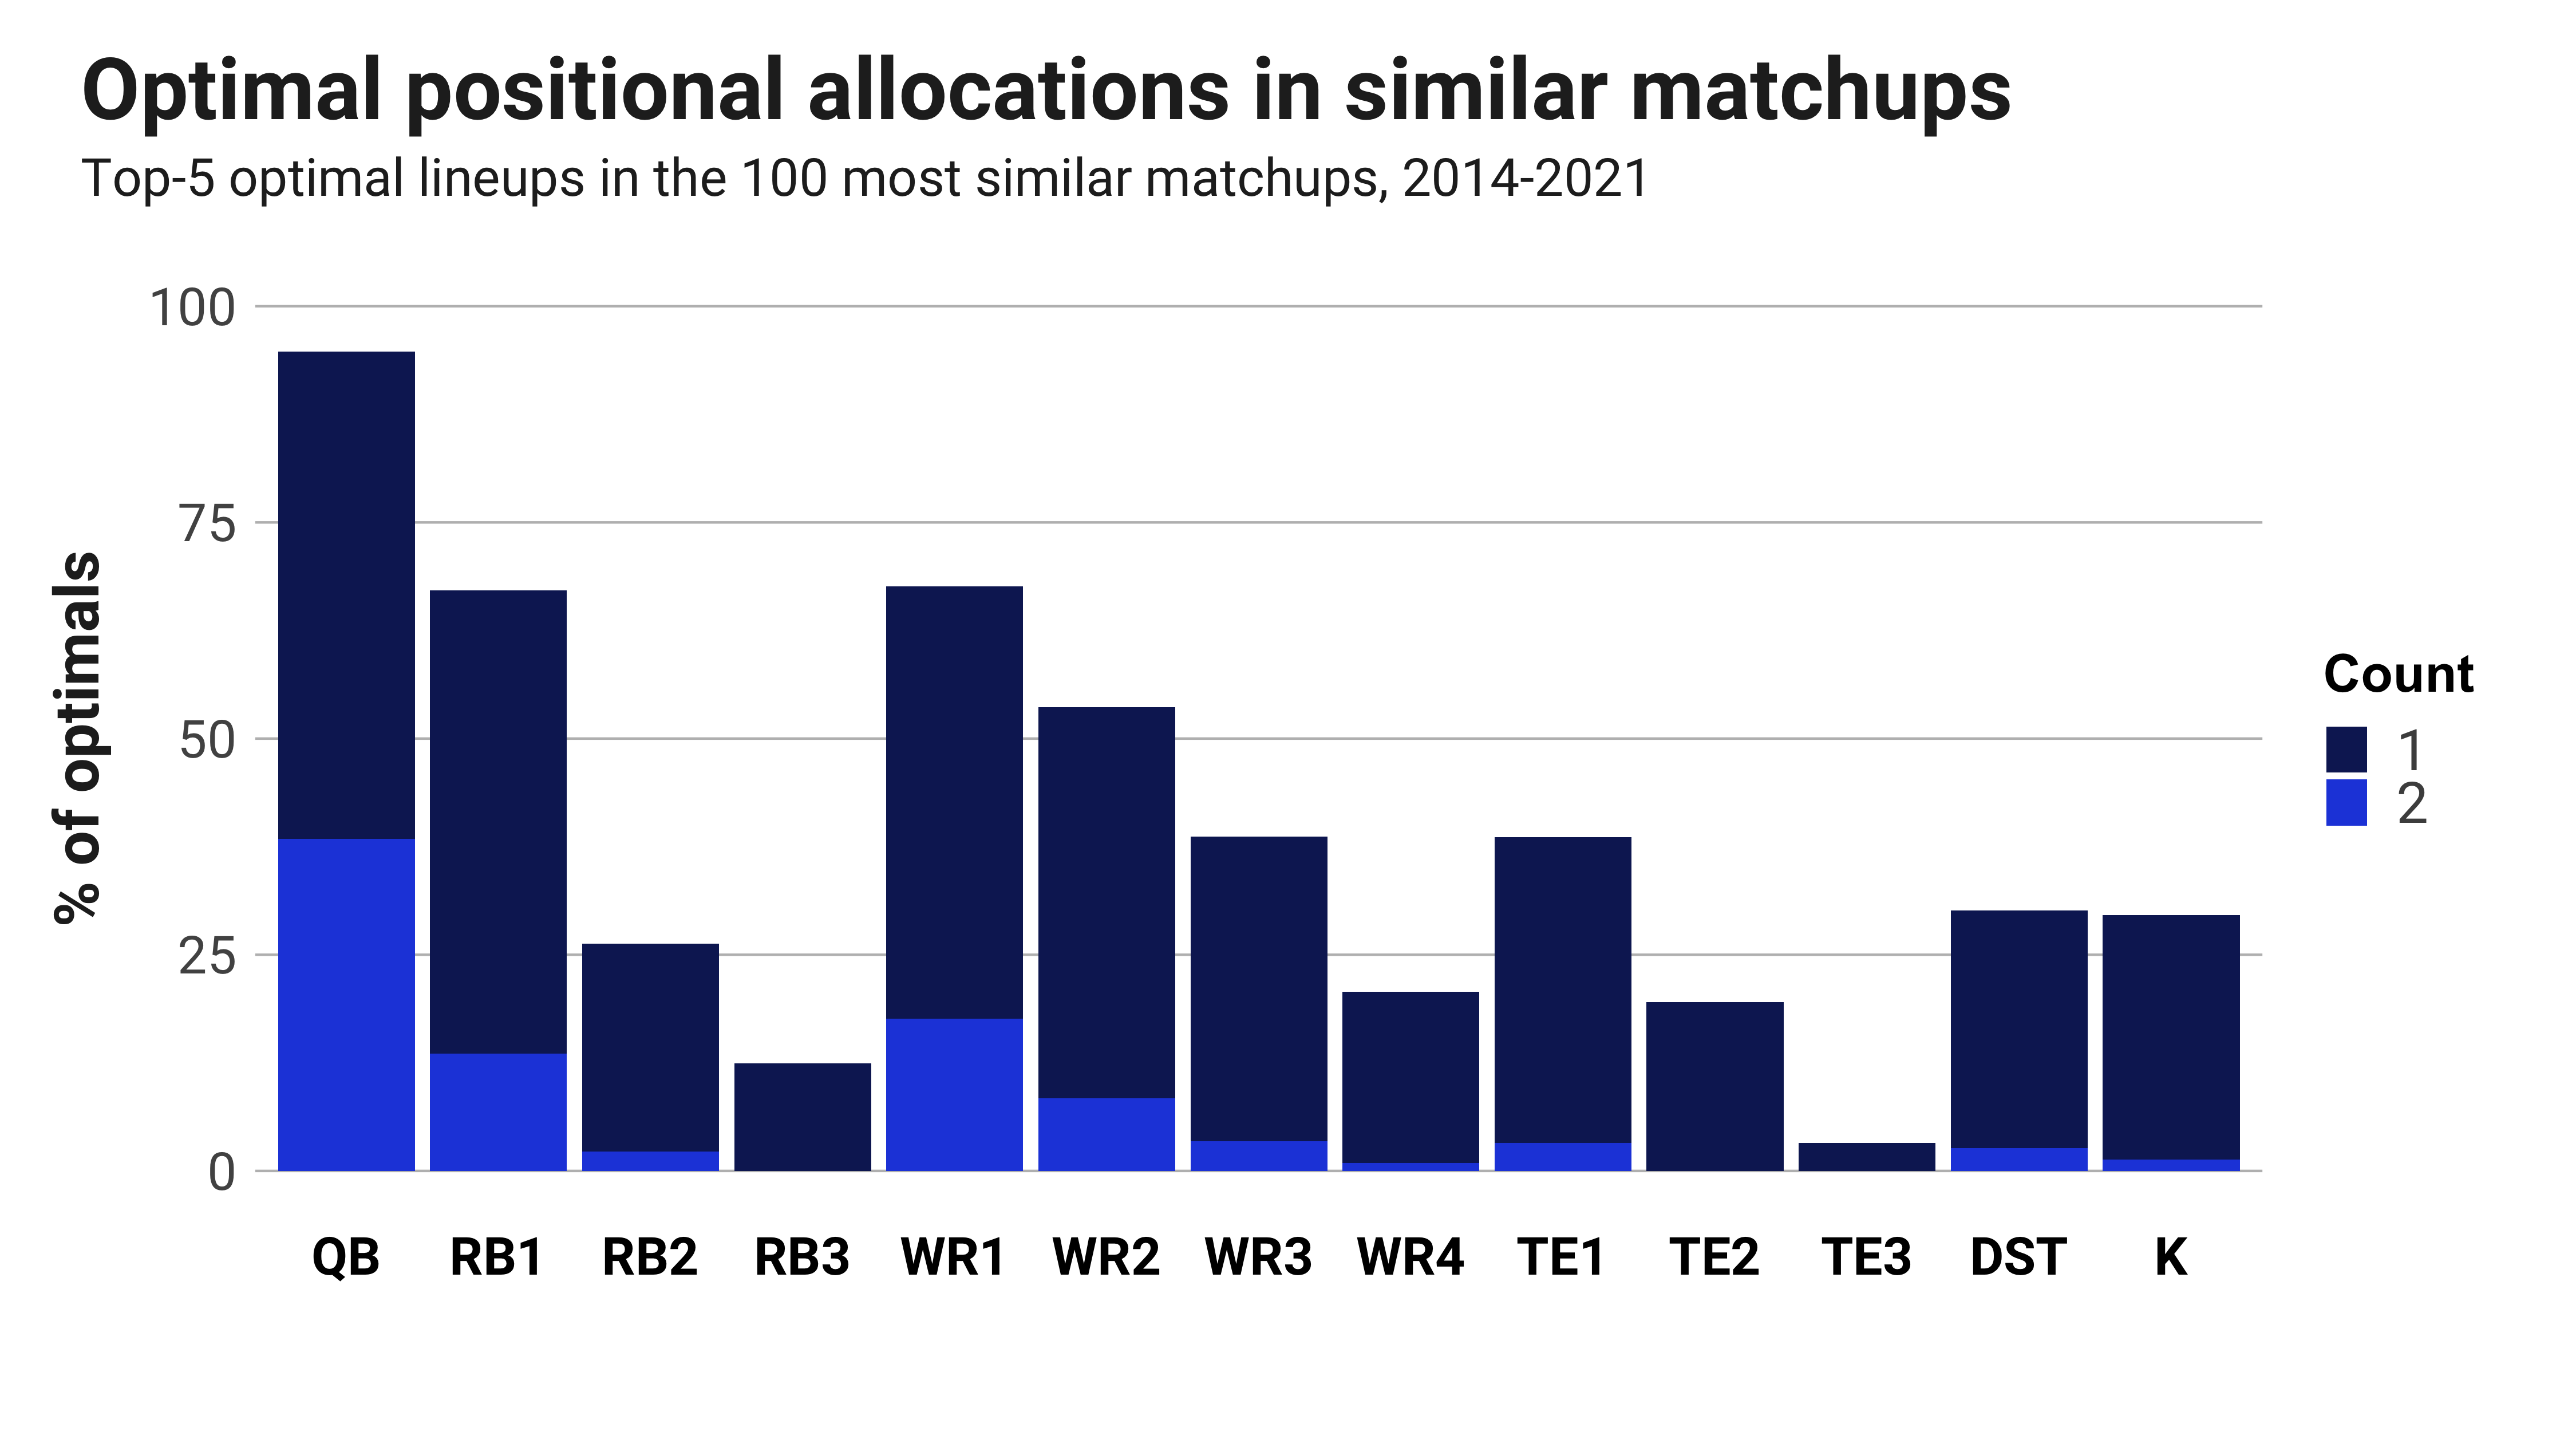
BREAKING DOWN TOTAL OPTIMAL ROSTERS
This graph illustrates the full range of allocations for the different positions to measure how many of the 500 optimal rosters had exactly zero, one or two of the given positions.
HISTORICAL OWNERSHIP
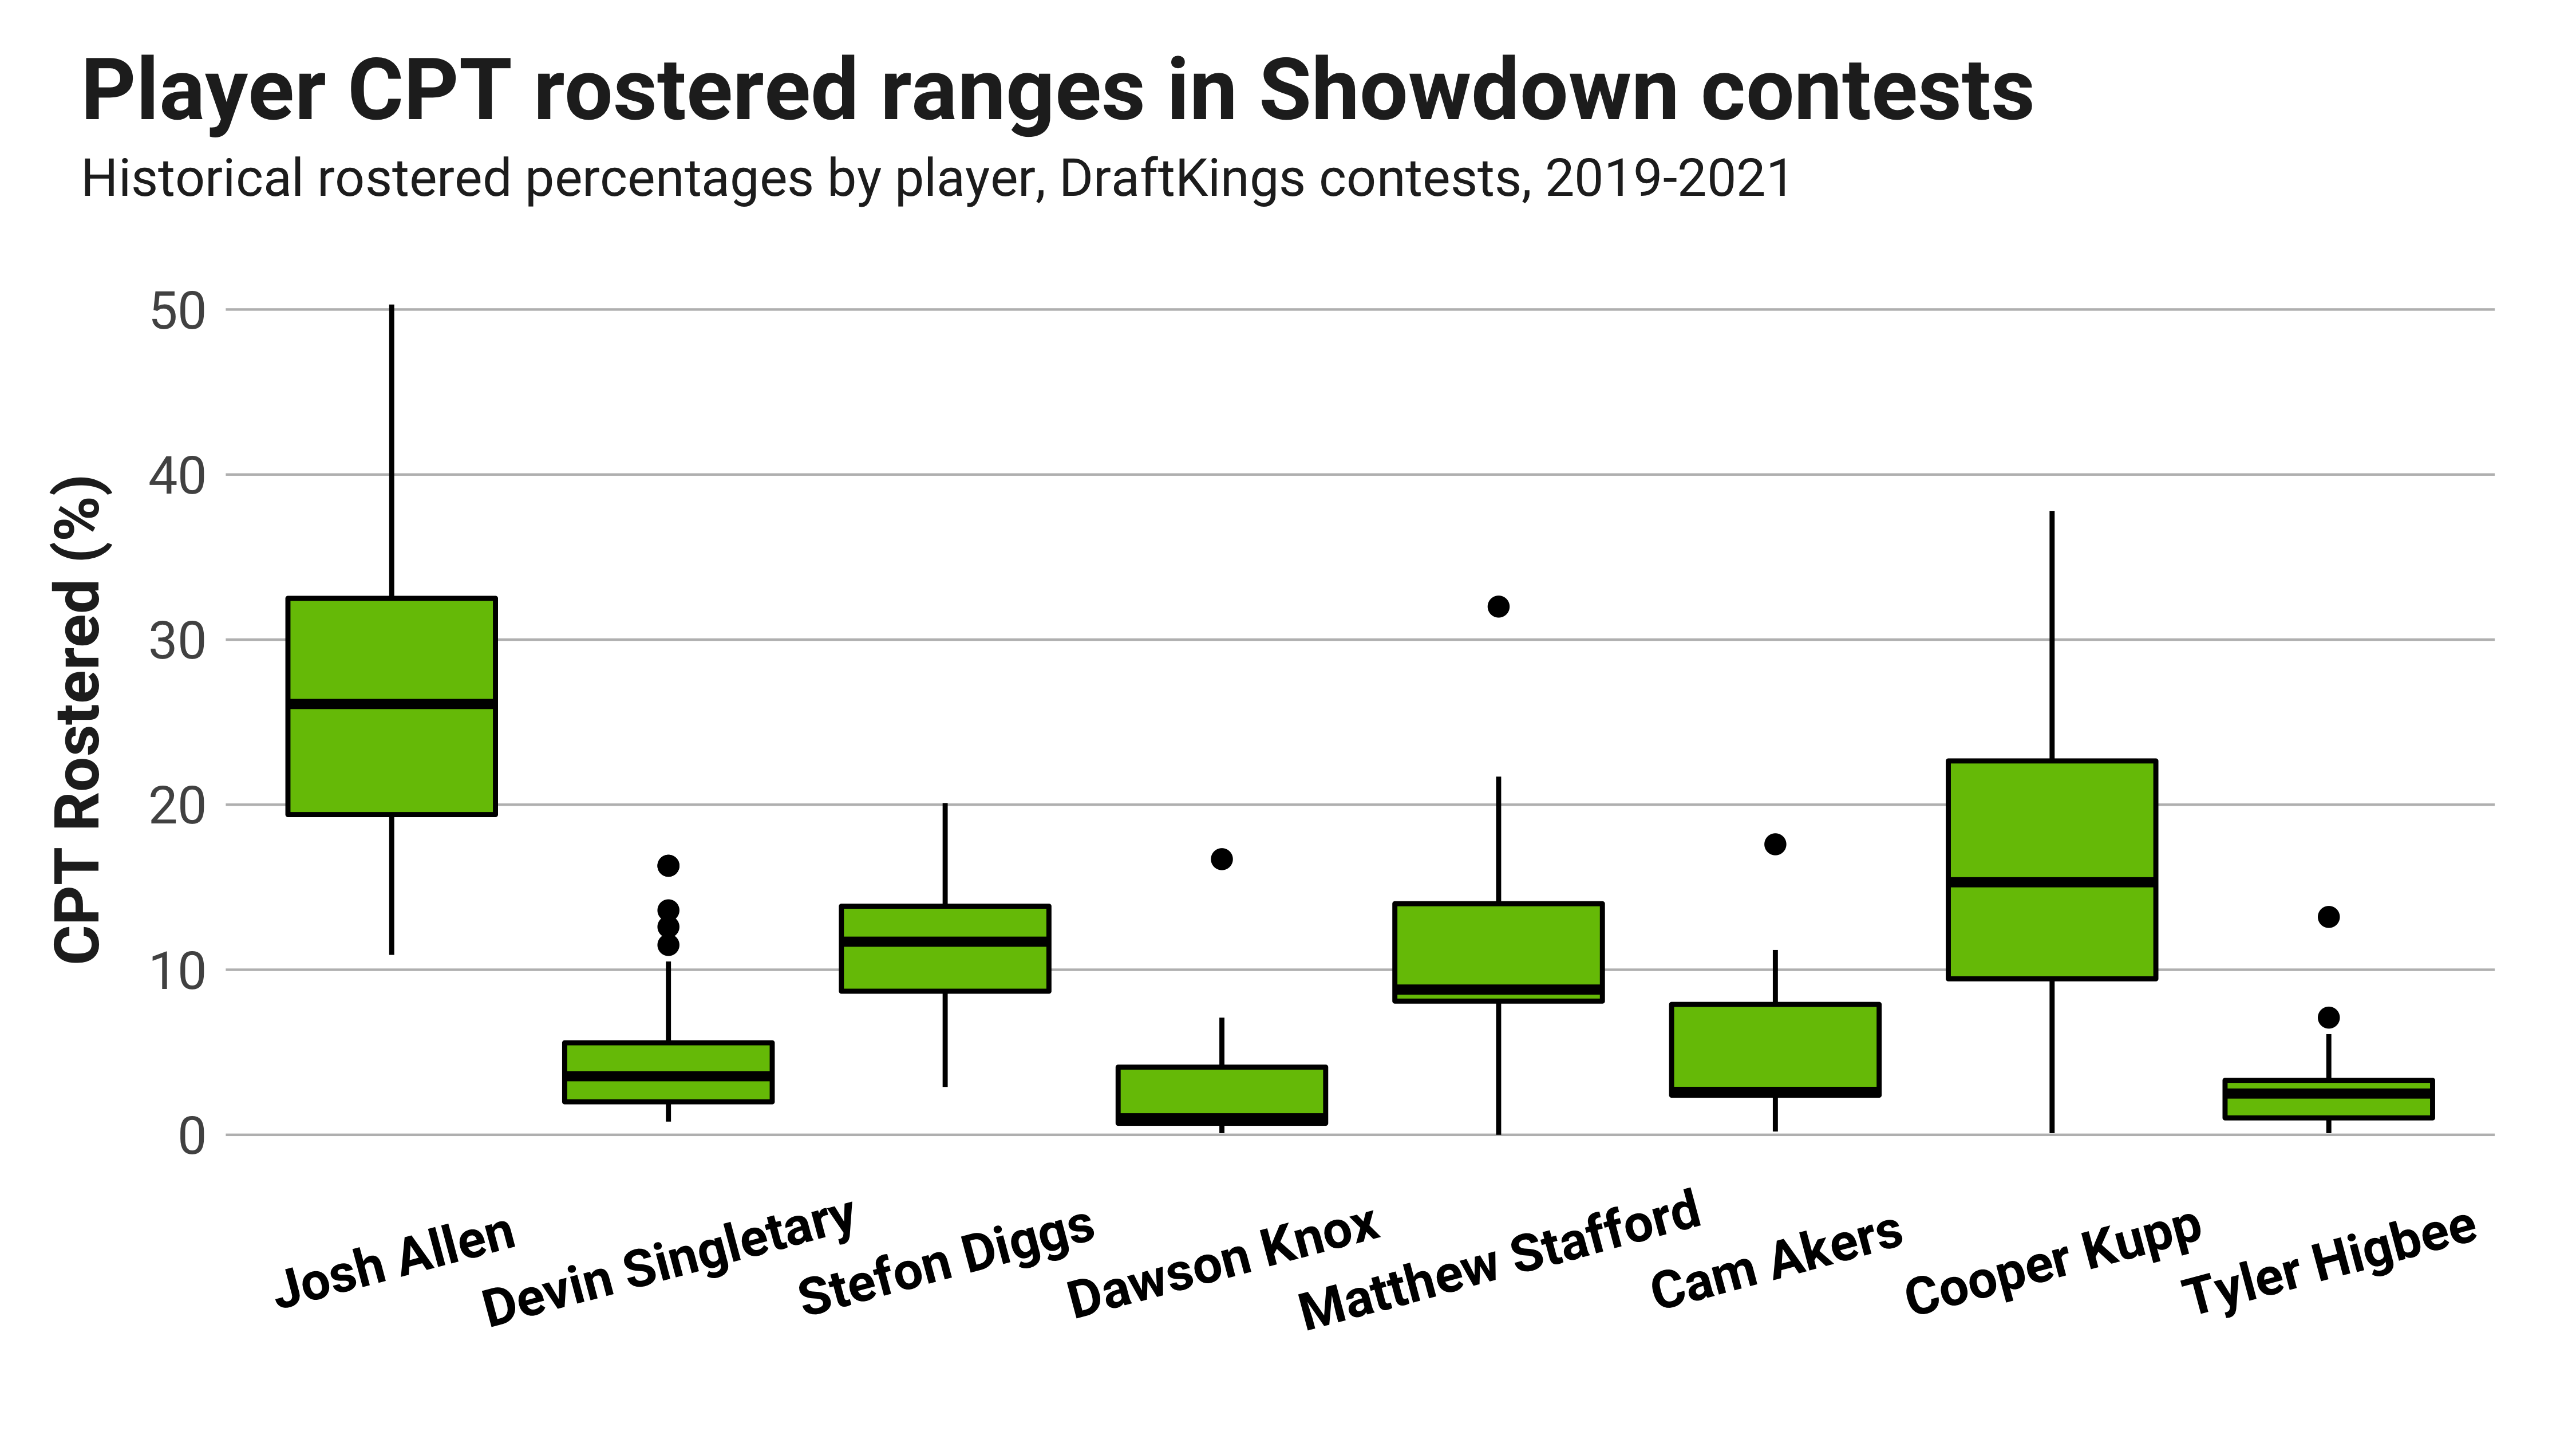
The boxplot above shows the ranges for CPT ownership for each starting player in contests since 2019.
Projected ownership versus optimal
This is where the analysis comes together and becomes actionable. What’s most important when viewing these numbers is to contrast them with the optimal numbers taken from the analysis above for different positions. Then, we see where the leverage may exist.
The two tables below compare the optimal allocations above, with adjustments for the personnel of this particular matchup, to our ownership projections for CPT and FLEX.
DRAFTKINGS SHOWDOWN CAPTAIN
