This analysis of DFS main-slate stacks is a variation of the methodology used in analyses on the single-game DraftKings showdown slates. It uses the combination of current projections, historical game results and similarity algorithms to simulate an upcoming game by looking back at the most similar historical matchups. In this analysis, I’m taking the same outline and applying it instead to the DFS main slate by projecting the likelihood each team’s QB-WR, RB-DST, QB-WR-TE, QB-RB-WR stacks will be the highest scoring of the slate. These are some of the most popular stack combinations employed in DFS strategy.
Click here for more PFF tools:
Rankings & Projections | WR/CB Matchup Chart | NFL & NCAA Betting Dashboards | NFL Player Props tool | NFL & NCAA Power Rankings
Best Bets Tool
British statistician George E.P. Box once said, “All models are wrong, but some are useful,” and that’s the mind frame you should bring to this analysis. The numbers below are not “right” in the traditional sense of maximizing accuracy, which would only mimic the recommendations you’ll find throughout the DFS toutersphere. The numbers below are harnessing the unexpected connections and reactions between players that have actually happened over the past several years, and thereby points to under/overvalued stacks that won’t be identified through traditional projections and logical deduction.
The information below is entirely in the form of plots and tables. If you’d like additional information and analysis on the same methodology broken out by position, please refer to the positional piece that also comes out every week.
METHODOLOGY
For each game on the DFS wild-card slates, I looked through thousands of NFL matchups from 2014-2021 and found the closest analogies according to the following parameters: betting spread, over/under, average fantasy points scoring for the top-ranked positional players of both rosters (QB1, RB1, WR1, TE1).
After I find the 75 most similar matchups for each upcoming game, I then simulate the main slate 10,000 times by randomly choosing one of the 75 matchups for each game and then find the highest scoring QB-WR, RB-DST, QB-WR-TE and QB-RB-WR stacks on the entire simulated slate.
Every match of historical and current games is not perfect, but by matching 75 different matchups to each game and simulating 10,000 times we can smooth out the bumps and get a strong picture of how a slate of similar games would have played out.
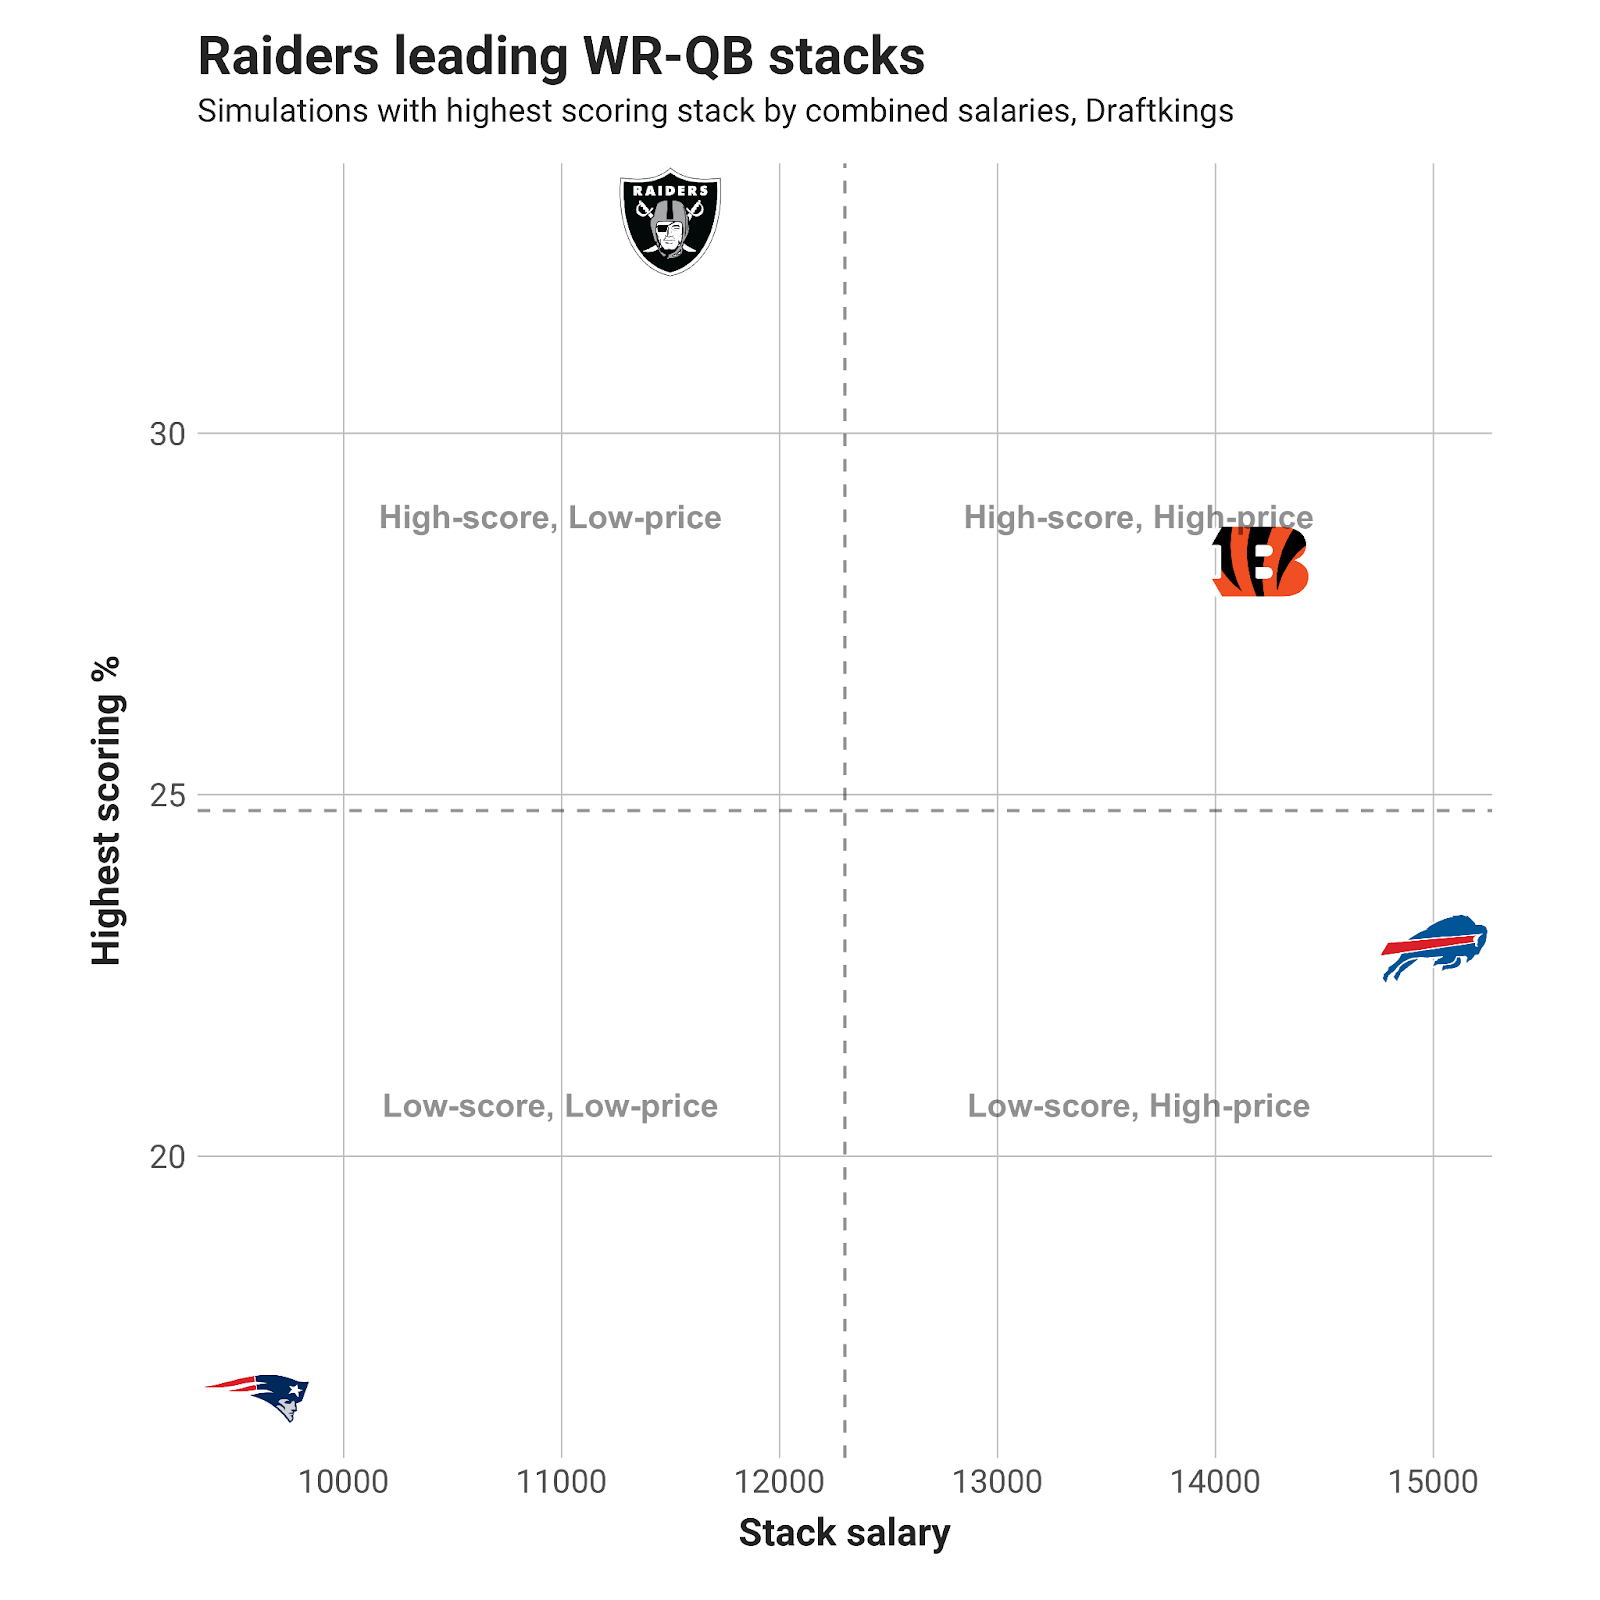
The last step is totaling up the number of times a particular team shows up as the top stacks for each of the three stacks projected, and then divide that number by the total simulations. That number is what I call “Highest scoring %” on the y-axis of the plots below labeled by team logo. Below the plots by team, I join the highest projected players that make up the stacks for that team and list their projected fantasy points and salaries for DraftKings and FanDuel.
HOW TO VIEW THE PLOTS
Each plot below has every team on the main slate positioned by the combined salary of the stack and the percentage of time that team’s stack was the highest scoring in the 10,000 simulations.
A way to look at them is that anything above the dashed horizontal line is a good scoring stack, and anything to the right of the dashed vertical line is a high-priced stack. You should pay most attention to the upper-right (high-scoring and high-priced) and upper-left (high-scoring and low-priced) quadrants. Ideally, you’ll find something in the upper-left that you’re confident in, but often paying up and moving into the upper-right can be beneficial.
Saturday Slate
Quarterback/Wide Receiver Stack
QB/WR Players
| Team | Highest % | Player | Pos | DK Fpts | DK Salary | FD Fpts | FD Salary |
| LV | 32.9 | Derek Carr | QB | 18.3 | 5,500 | 17.0 | 6,800 |
| LV | 32.9 | Hunter Renfrow | WR | 14.5 | 6,000 | 11.2 | 7,300 |
| CIN | 28.2 | Joe Burrow | QB | 24.0 | 6,800 | 22.1 | 7,800 |
| CIN | 28.2 | Ja'Marr Chase | WR | 20.2 | 7,400 | 16.1 | 8,200 |
| BUF | 22.9 | Josh Allen | QB | 25.4 | 7,800 | 23.7 | 8,800 |
| BUF | 22.9 | Stefon Diggs | WR | 19.3 | 7,200 | 15.0 | 8,000 |
| NE | 16.6 | Mac Jones | QB | 17.8 | 5,100 | 16.6 | 6,500 |
| NE | 16.6 | Jakobi Meyers | WR | 12.8 | 4,500 | 9.9 | 5,900 |
Running Back/DST Stack
