Despite the COVID-19 pandemic significantly changing all 32 teams’ preparations for the draft, we still expect to see a number of trades throughout the three-day event. While the way the board unfolds can alter the evaluation of draft trades to some extent, the basis of the evaluation is the range of outcomes of the players drafted at a given position.
[Editor’s note: Check out PFF’s 2020 Mock Draft Hub, NFL Draft Big Board and NFL Mock Draft Simulator. PFF Elite subscribers can also download the 1,100-page 2020 NFL Draft Guide.]
To study these, we created a draft-trade simulator that can compute how often a given team wins a given trade. We used shape constrained additive models and quantile regression to predict the distribution of the four-year WAR of players drafted at each draft spot.
Other than being based on PFF WAR — probably the best metric to measure the impact of an individual NFL player — there is one major and crucial advantage over other draft charts: We obtain not only expected values but the whole distribution of outcomes. This allows us to compute percentages or to investigate how the outlook changes when we assume a certain percentile in the range of outcomes.
For example, here are the distributions for the fifth overall pick, the 50th overall pick and the 100th overall pick.
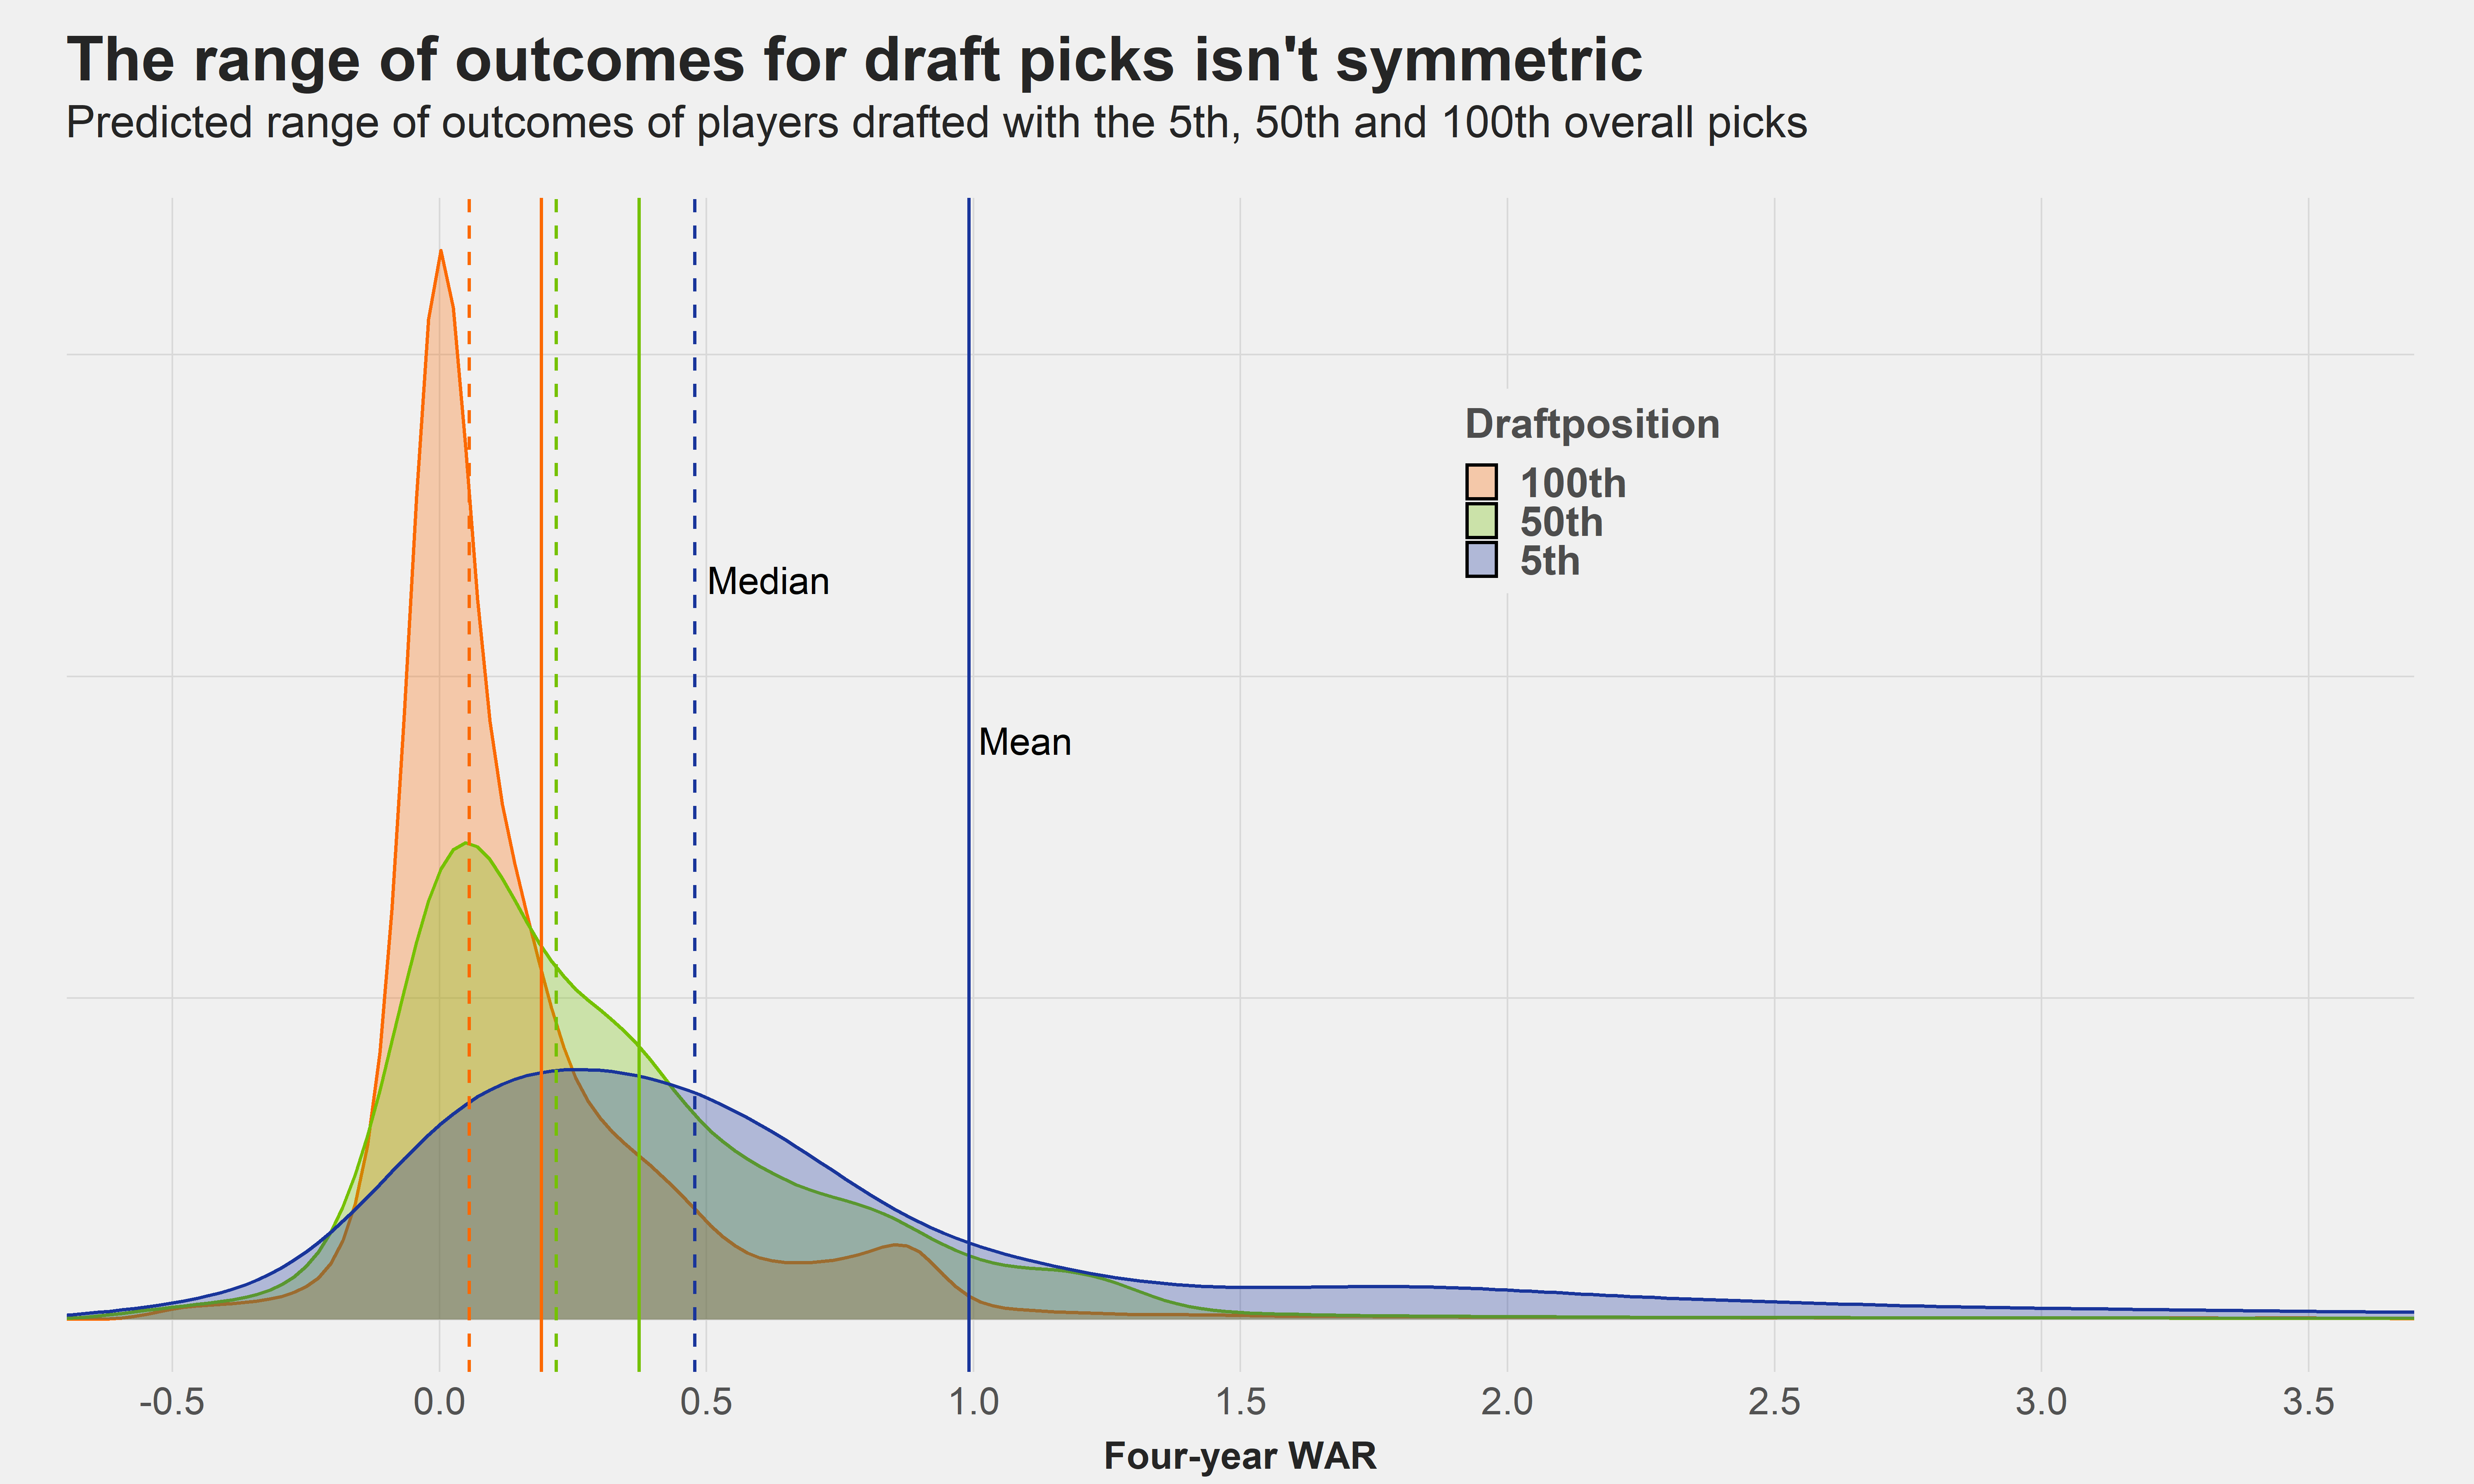
These distributions are position-agnostic, i.e., they are derived from all draft picks (including quarterbacks, who are mostly responsible for the tail end of outcomes on the right). If a quarterback is selected, one can also use the distribution for quarterbacks, as they have a much higher density at higher WAR numbers.
The main observation is that the distributions are not symmetric since good players can gain a lot of WAR, but bad players can’t generate much less than zero WAR, not only because players who turn out below replacement level will not see the field for very long but also because of how WAR is defined.
Below-replacement-level players are fairly rare. It seems paradoxical that the distributions imply that the fifth overall pick has a higher chance to bottom out, yet that’s logical after giving it a second thought: Bad players with a high draft stock will get more chances on the field than bad players who were drafted later.
A consequence is that the median outcome and the mean outcome differ a lot, especially for early draft picks. While the mean outcome for the fifth overall pick is roughly 1 WAR over four years, approximately 50% of those draft picks actually end up producing less than 0.5 wins above replacement. The mean outcome of 1 WAR represents the 73rd percentile of outcomes.
While the mean is additive (i.e., if you know the mean outcome of all of your draft picks, the overall mean outcome is just the sum of the individual mean outcomes), that’s not true for the median. In particular, in our case, the overall median is greater than the sum of individual medians, illustrating how having more picks is a crucial step to win the draft.
Another consequence is that trades that one team wins more often (median outcome), but the other teams gain more WAR on average (mean outcome) exist. Should teams strive to win by the median outcome or the mean outcome? The answer is, of course, both, but if that’s not the case, the goal of a trade can differ from team to team.
If you already have a good team, you might want to strive for the higher median outcome — the more safe approach. If you lack superstars or feel you need a lot of luck in the draft to close the gap to the top teams anyway, you might want to strive for the higher mean outcome — maximizing your value when the drafted players end up in the 80th or 90th percentile of their range of outcomes.
As an example, let’s consider the first overall pick and the combination of the 20th and 30th overall pick. Both scenarios have (roughly) the same mean outcome.
| First overall | 20th + 30th overall | |
| Mean | 1.13 | 1.12 |
| 10th percentile | -0.02 | 0.12 |
| 25th percentile | 0.18 | 0.40 |
| Median | 0.51 | 0.81 |
| 75th percentile | 1.23 | 1.38 |
| 90th percentile | 3.35 | 2.19 |
Across almost the whole spectrum of outcomes, the combination of the two lower picks is better. One can also see the effect of hedging against outcomes in the lower percentiles with more picks. However, the luckier a team gets with draft picks, the better the first overall pick becomes in comparison to the two lower picks. And at the 90th percentile, the result has clearly flipped.
In conclusion, while analytical results mostly suggest trading up (for non-quarterbacks) is rarely a good idea in the current trade market, if you have the mindset that ending up with median outcomes won’t get you far anyway, trading up might look better through your eyes.
It might make sense to differentiate between to types of trading up:
- You lose the trade on average and especially at the median or the lower percentiles, but you win the trade at say the 90th percentile. That is a high risk. Occasionally, taking a high risk is ok.
- You lose the trade on average and basically throughout the whole spectrum of outcomes, including the 90th or even the 95th percentile. That is a flat-out mistake.
So now that we’ve addressed the theoretical background let’s illustrate how the draft-trade simulator works by investigating five historical trades.
The Chiefs made the best move in their franchise history
