Season-long NFL player props have been booming of late, with DraftKings Sportsbook offering a number of enticing options for NFL bettors over the past two weeks.
With the 2021 NFL season looming ever closer and training camps getting underway, PFF has taken an in-depth look at the best player props to bet and the approaches on how to bet them at both the season-long and week-to-week timeframe.
Let’s turn our attention to the receiving touchdown prop market to find what is most relevant when it comes to projecting future outcomes for pass-catchers.
RECEIVING TOUCHDOWNS
Establishing the “base rate” — a distribution that expresses established beliefs before new evidence is taken into account — is the best way to start researching individual stat categories. We can check the R-squared value of prior receiving touchdown rate to the season N+1 rate (min. 50 targets each year).
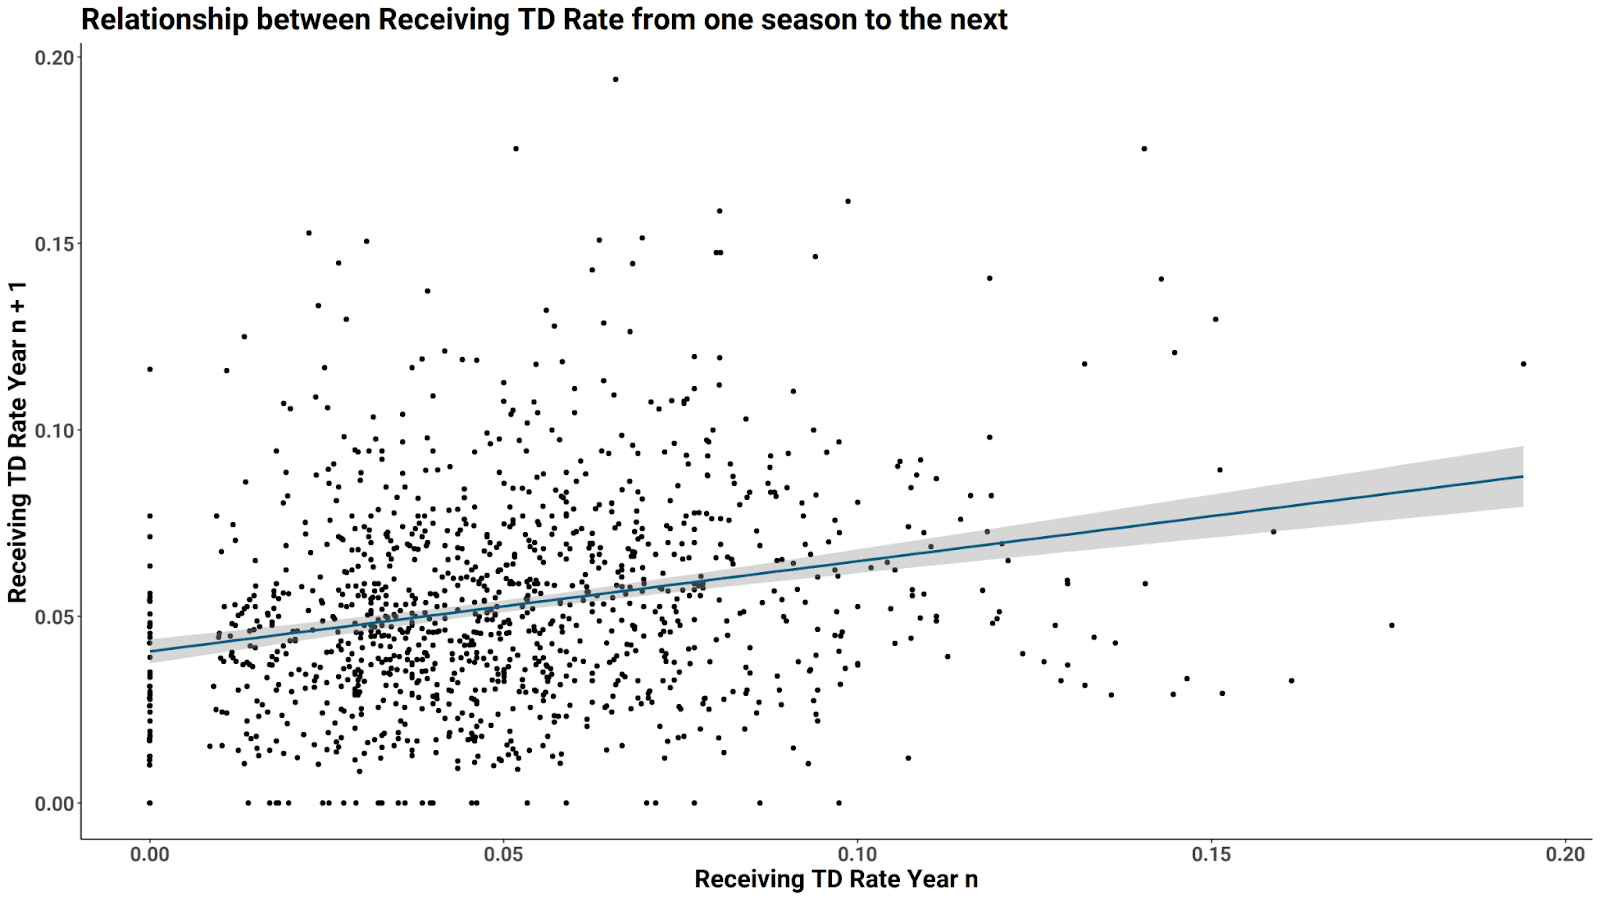
As most would expect, receiving touchdown rate is almost completely random, as it yields a lower R-squared value than rushing touchdown rate. In fact, it is the lowest R-squared base rate across our series of articles, making it the hardest to project over any given timeframe.
Even more frustrating is the lack of explanation we get from all of the stats tested. Receiving grade is the closest in R-squared value to receiving touchdown rate, but it also barely moves the needle when explaining receiving touchdown rate.
Once you adjust raw touchdowns on a volume metric such as targets or routes run, it becomes increasingly difficult to predict.
| Stat | Touchdown Rate r^2 |
| Touchdown Rate | 0.058 |
| Receiving Grade | 0.051 |
| Total Air Yards | 0.041 |
| Percent of Team Air Yards | 0.033 |
| Total Routes Run | 0.022 |
| Total Receiving Yards | 0.016 |
| Total Team Passing Touchdowns | 0.015 |
| Percent of Routes Run to Total Dropbacks | 0.011 |
| Total Targets | 0.007 |
| Total Yards After Catch | 0.006 |
We can look at raw touchdowns scored at the season-long level, which have a higher R-squared value than the metrics listed above. The problem is that the Poisson Distribution of touchdowns at the game level makes raw touchdown totals worthless. Therefore, we need to establish a rate that can then be multiplied against our receiving target (volume) projection.
For pass-catchers who receive at least one target in a game and run at least 20 routes, the mean outcome for touchdowns is 0.347. This is slightly lower than the figure we saw for rushing touchdown rate, which is compounded in difficulty when you add in how many more pass-catchers are in on a given play.
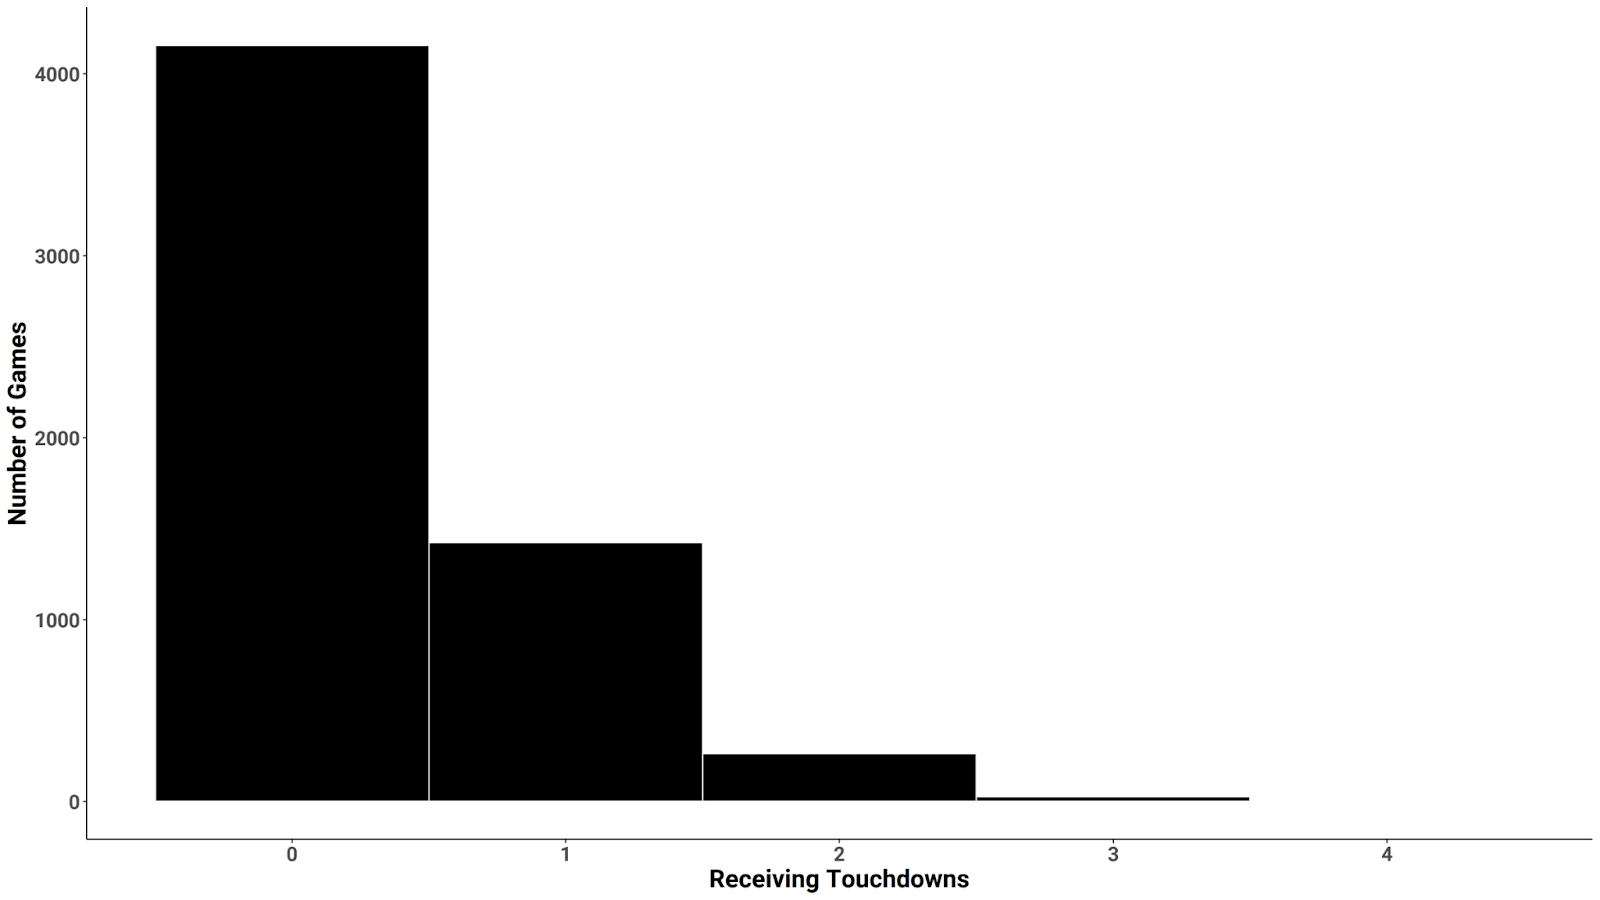
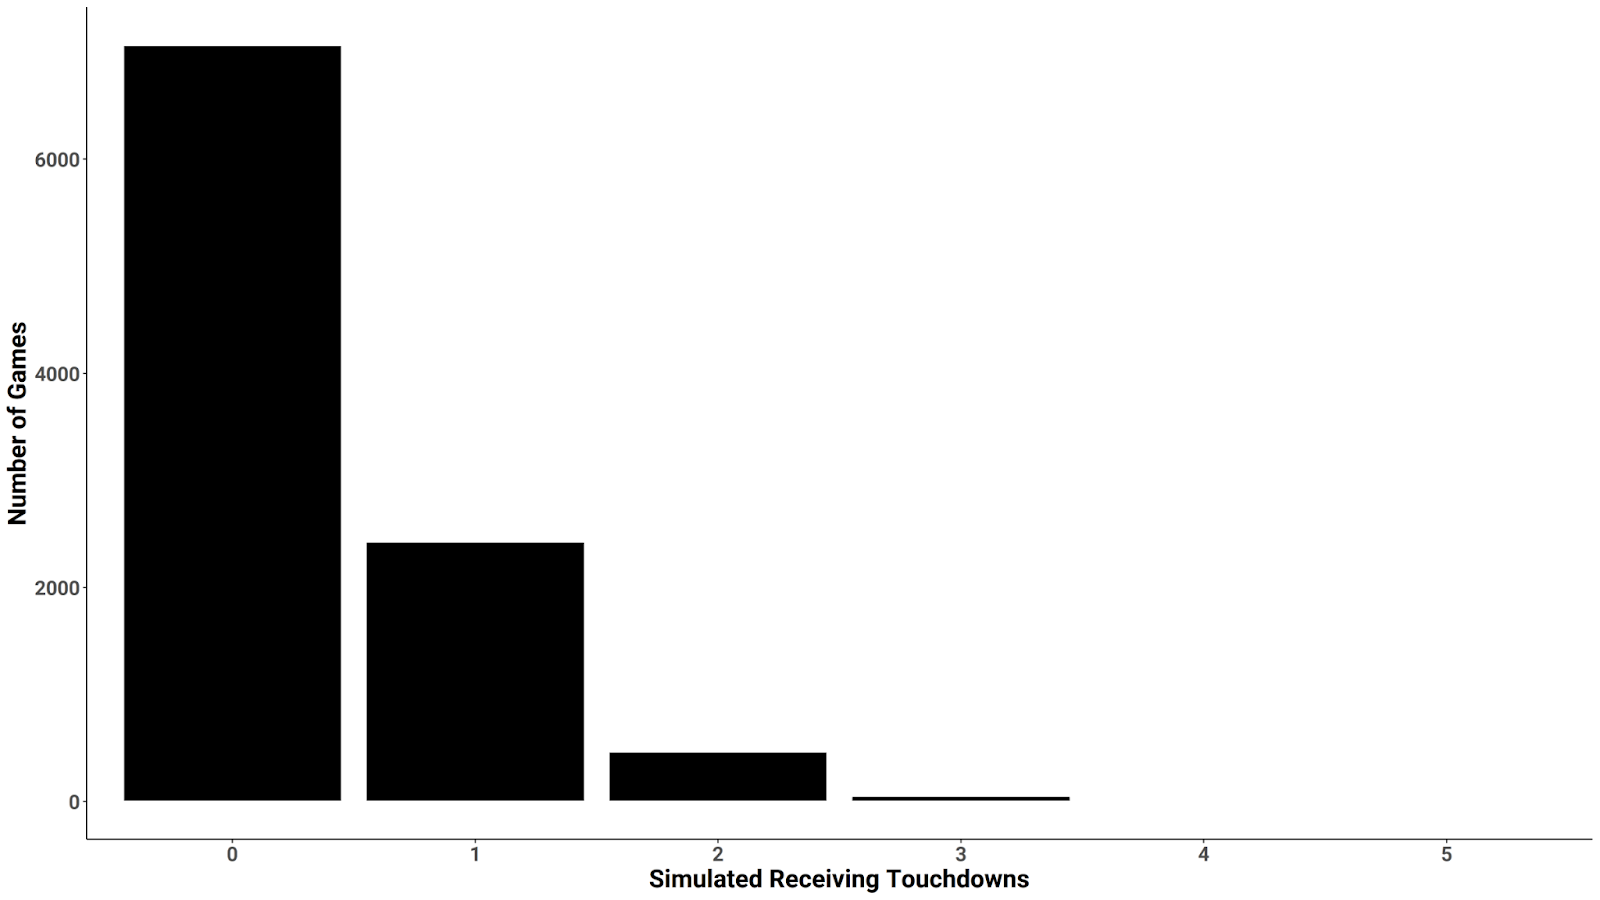
Building a Poisson-distributed simulation builds a close approximation to the historical data but is actually more pessimistic about receiving touchdowns at the game level. This reinforces the idea that anytime touchdown scorers are some of the most difficult bets to beat consistently across the prop menu.
Books also tend to list these as one-sided propositions, which tilt the odds even more in the bookmakers' favor. Avoiding these bets for more worthwhile opportunities appears to be the most prudent decision.
At the season-long level, we see volume-based metrics carry the most predictive power from season to season. There are several mispriced season-long offerings compared to PFF's fantasy projections. The bets where the volume might not be accurately reflected in the line are the best opportunities to bet.