Collecting thousands of data points for every game puts PFF in a unique place to analyze the game. One of the difficult questions you’re faced with when looking at this copious data is what exactly to do with it. Our research and development team has done some of the most complex and insightful analysis on football. We’ve mapped routes and calculated expected target rates, figured out that pressure rates are mostly owned by the quarterbacks and found that pass coverage may be more important for a defense than pass-rush.
![]()
This analysis will look specifically at the question of pass timing, the best way to visualize how a quarterback is working in the context of his offense and how he develops with more experience and different offensive coordinators. Below I’m going to look at some of the most intriguing combinations of quarterback and coordinator, with a keen interest on how changes to that mix affect the distribution of quarterbacks’ time-to-throw.
Most analyses that incorporate time-to-throw (i.e. the amount of time the quarterback hold the ball from snap to throw, sack or scramble) do so looking at averages. For a stat that ranges from 0.5 to well over six seconds, looking at simple averages can give undue weight to outliers and lose context of the entire passing game.
Below I’ve visualized the density, or the concentration of passes by time-to-throw, for four quarterbacks with changing dynamics this season: Lamar Jackson, Dak Prescott, Aaron Rodgers and Baker Mayfield. I’ve compared the year-over-year distributions for each to get an idea of how they’ve changed this season and also looked into previous team for their new offensive coordinators to see how much quarterback or scheme affects the time-to-throw distribution.
[Editor's Note: All ELITE subscribers can access time-to-throw metrics among several other advanced statistics in Premium Stats. Subscribe today to gain access.]
Lamar Jackson, Baltimore Ravens
| Season | Player | Team | Time-to-Throw | TTT Rank |
| 2018 | Lamar Jackson | BAL | 3.23 | 37 |
| 2019 | Lamar Jackson | BAL | 2.98 | 31 |
Lamar Jackson was the buzz of the first couple weeks this season before cooling off a little in losses to the Chiefs and Browns. Jackson’s average time-to-throw has improved, while his rank among qualifying quarterbacks (min. 100 dropbacks in 2019; 200 dropbacks in 2018) has gone from the league’s lowest to slightly higher.
Digging into the distribution of throws, we see how details on how and why Jackson has improved that can’t be gleaned from averages.
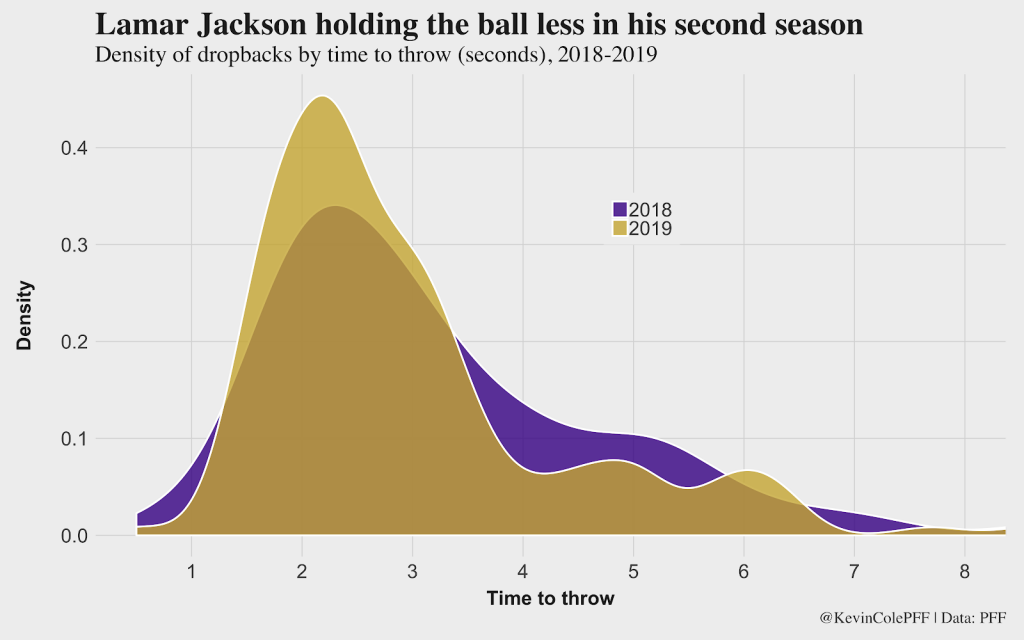
Jackson has shifted many passes earlier in his reads to the 1.5- to 3.5-second range and away from 3.5-plus seconds. This is likely due to a combination of factors: better acclimation to the NFL, the new system under Greg Roman, a lower sack rate (6.5% of dropbacks from 7.4%) and less reliance on scrambling (7.1% from 8.9%).
Exactly how much of Jackson’s quicker time-to-throw is difficult to parse. We can get a better idea by comparing Jackson’s 2019 distribution to that of the 2015 Bills, the last full season Roman was a coordinator with a similar quarterback, Tyrod Taylor.
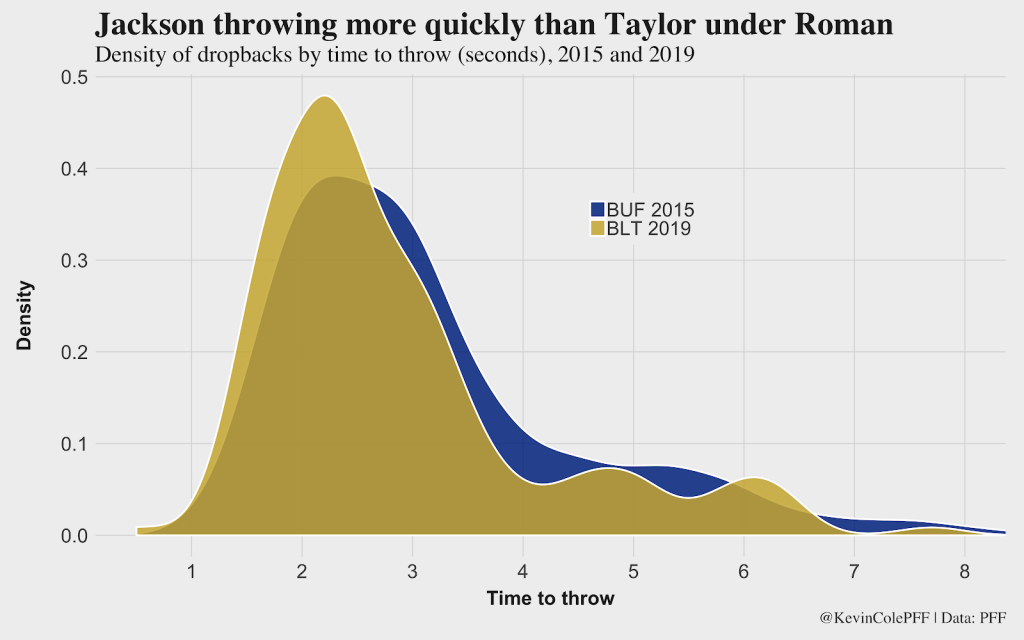
Taylor’s 2015 season time-to-throw distribution looks similar to that of Jackson’s rookie season, giving some indication that Jackson is on the trajectory to be a more reliable pocket passer than Taylor.
