• Myles Garrett posts big numbers across the board: The Browns star ranks top-three among his peers in PFF pass-rush grade, total pressures and PFF's pass-rush productivity metric.
• Rookie Jalen Carter leads first-year pass-rushers: Carter is the highest-graded rookie defensive lineman ever through three games.
• The San Francisco 49ers boast two of the top-five-graded defensive linemen: Nick Bosa (92.4) and Javon Hargrave (91.4) have each earned elite pass-rush grades this season.
• Dig into the numbers for yourself: PFF's Premium Stats is the most in-depth collection of NFL and NCAA player performance data. Subscribe today to get full access!
Estimated reading time: 6 minutes
Pass-rushing numbers have always interested me, even dating back to when PFF was just a baby. The sacks, the hits, the hurries and the grades — I could spend an unreasonable amount of time parsing through it all because it was all so new.
Now, it’s not quite as new, and there’s much more to look at. We have stats and different types of grades presented in a way I could only dream of back in 2008. But here we are now, and here I am, still writing about the NFL's most productive pass-rushers.
Rather than just looking at the PFF-derived pass-rushing productivity score, I will go on a journey to look at some of the other metrics we capture.

Blunt-Force Statistics: Total Pressures
What is a blunt-force statistic to me? It is something that smacks you in the face with its crudeness in an attempt to explain something it frankly cannot, given its lack of depth and context.
It used to be the sack stat. Fans used to see who had the most sacks and crown them the best pass-rusher. Over time, the sack stat has lost some of its value, and people have looked at something that can be almost as crude — total pressures.
| RANK | PLAYER | TEAM | TOTAL PRESSURE |
| 1 | Aidan Hutchinson | DET | 19 |
| 1 | Maxx Crosby | LV | 19 |
| 1 | T.J. Watt | PIT | 19 |
| 4 | Myles Garrett | CLV | 18 |
| 5 | Micah Parsons | DAL | 17 |
| 6 | George Karlaftis | KC | 16 |
| 7 | Nick Bosa | SF | 15 |
| 7 | Trey Hendrickson | CIN | 15 |
| 7 | Jalen Carter | PHI | 15 |
| 10 | Cameron Jordan | NO | 14 |
| 10 | Aaron Donald | LA | 14 |
It’s not completely without value. It does point you in the right direction, and we should applaud those with the biggest numbers. But what is ultimately better: 10 pressures on 1,000 pass-rushing snaps or five on 100?
(Answer: neither is great, but one is certainly better than the other).
Opportunity Matters: Pass-rushing productivity
You absolutely must look at opportunities before making any big proclamations. And that is what led to us creating the pass-rushing productivity metric. It does exactly what it was designed to do — measure how productive a pass-rusher is relative to the opportunities he had.
| RANK | PLAYER | TEAM | PASS RUSHES | SACKS | HITS | HURRIES | PRP |
| 1 | Rashan Gary | GB | 44 | 4 | 1 | 8 | 19.3 |
| 2 | Victor Dimukeje | ARZ | 38 | 3 | 1 | 5 | 15.8 |
| 3 | Myles Garrett | CLV | 77 | 5 | 4 | 9 | 14.9 |
| 4 | Josh Uche | NE | 48 | 1 | 1 | 11 | 14.6 |
| 5 | Leonard Floyd | BUF | 43 | 4 | 1 | 3 | 14 |
| 6 | Micah Parsons | DAL | 78 | 4 | 4 | 9 | 13.5 |
| 7 | Tuli Tuipulotu | LAC | 70 | 5 | 3 | 5 | 12.9 |
| 8 | Osa Odighizuwa | DAL | 44 | 3 | 1 | 4 | 12.5 |
| 9 | Matthew Judon | NE | 69 | 4 | 3 | 6 | 12.3 |
| 10 | T.J. Watt | PIT | 104 | 6 | 6 | 7 | 12 |
But here is where things do get a bit more interesting. You can argue about how to weigh sacks vs. hits vs. hurries, but from a numerical perspective, there is now evidence of who the most productive pass-rushers are.
What’s interesting is that we have only three players who make both lists up to this point, as the more information we add in our attempt to decipher the problem gives us a clearer picture of what we’re looking at.
Pressure isn’t everything: Pass-rush win rate
However, pass-rush productivity presumes that pressure is everything when determining the best pass-rushers. Fundamentally, though, if we only look at pressures, we’re judging pass-rushers on something they cannot control — how quickly the ball comes out.
You can have two identical play calls on offense, and the ball can come out at two very different times. In one instance, it’s released at 2.5 seconds, and the quarterback is free of pressure. In the other, it’s released at 3.0 seconds, and the quarterback is taken down. In both these scenarios, the pass-rusher may have beaten the pass-blocker at the same time, but on one occasion, he is rewarded with the stat and on the other, he is not.
So, we started collecting a data point called “BD,” or beaten defender. In its rawest form, it allows us to look at how successful a pass-rusher is at beating his man.
| RANK | PLAYER | TEAM | PASS RUSHES | PASS RUSH WINS | PASS RUSH WIN % |
| 1 | Myles Garrett | CLV | 77 | 25 | 32.5 |
| 2 | Rashan Gary | GB | 44 | 14 | 31.8 |
| 3 | Nick Bosa | SF | 99 | 28 | 28.3 |
| 4 | David Onyemata | ATL | 56 | 15 | 26.8 |
| 5 | Trey Hendrickson | CIN | 78 | 20 | 25.6 |
| 6 | Aaron Donald | LA | 95 | 24 | 25.3 |
| 7 | Micah Parsons | DAL | 78 | 18 | 23.1 |
| 8 | DeMarcus Lawrence | DAL | 61 | 14 | 23 |
| 9 | Josh Uche | NE | 48 | 11 | 22.9 |
| 10 | Dexter Lawrence | NYG | 72 | 16 | 22.2 |
I was part of the process that created the pass-rushing productivity metric, but I cannot tell a lie: I like this statistic a lot more and find it a lot more explanatory. And as for the names you’re seeing; there's nothing overly surprising, except maybe a couple that are missing.
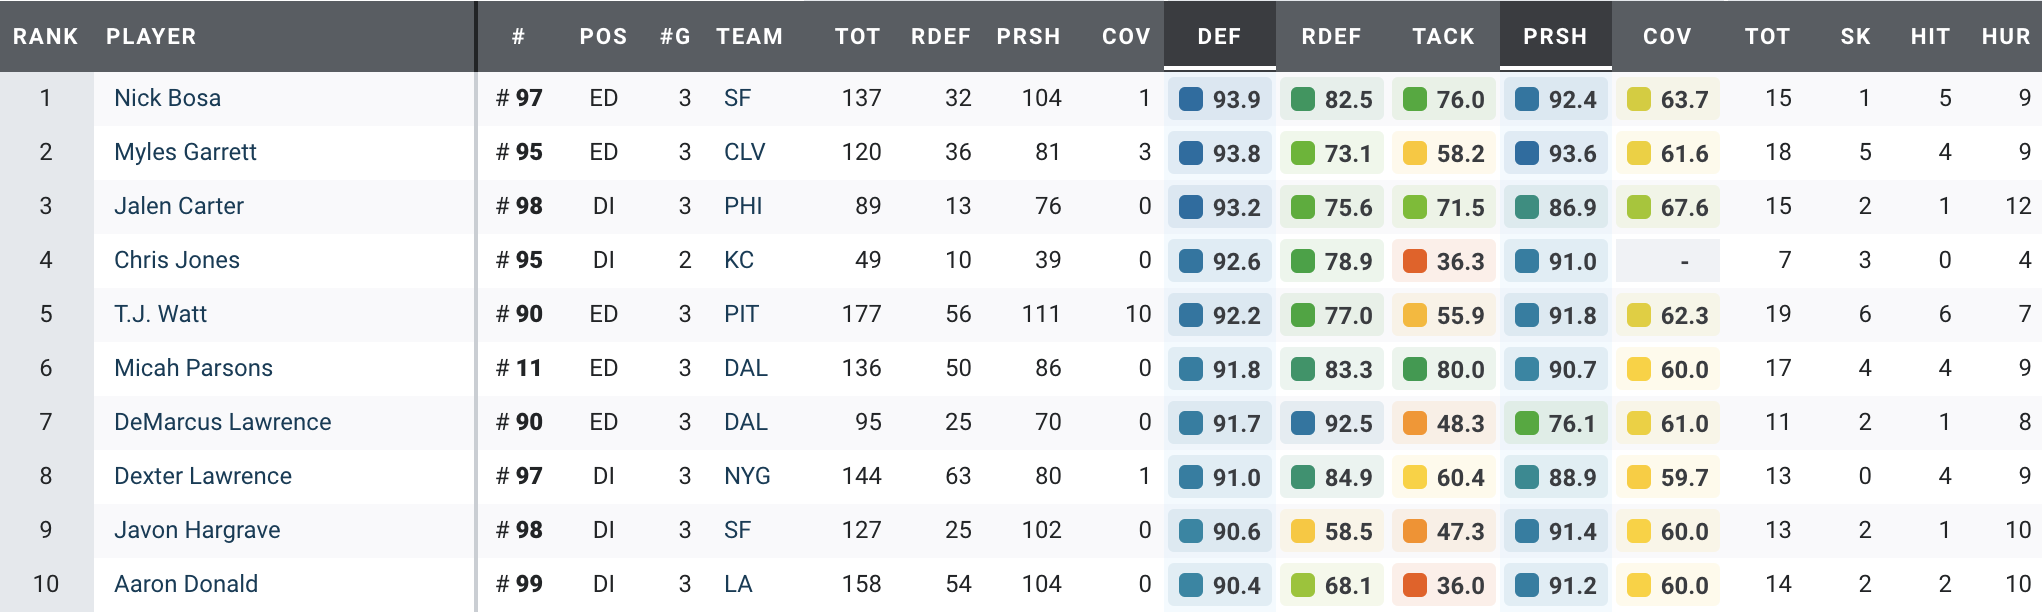
The Ultimate Metric: PFF pass-rush grade
So that’s it, right? Win percentage is the winner? Not for me. And that's because win percentage still has some flaws, the same flaws as pretty much any other stat we’ve produced and will produce around pass-rushing. The flaw is that it lacks context.
It doesn’t just lack context, but it also treats every pressure or every win as exactly the same when they are most definitely not. But our grades? The grades can.
They look at the nature of win or pressure. They look at how quickly it happened or whether the pass-rusher was the beneficiary of a mental error from a lineman or a quarterback running straight into them. There is a nuance there.
To me, the stats above help explain the grade, and the grade exists to help explain who the best pass-rushers are.
| RANK | PLAYER | TEAM | TOTAL PRESSURE | PRP | PASS RUSH WIN % | PASS RUSH GRADE |
| 1 | Myles Garrett | CLV | 18 | 14.9 | 32.5 | 93.6 |
| 2 | Nick Bosa | SF | 15 | 8.1 | 28.3 | 92.4 |
| 3 | T.J. Watt | PIT | 19 | 12 | 16.3 | 91.8 |
| 4 | Javon Hargrave | SF | 13 | 7.7 | 21.4 | 91.4 |
| 5 | Aaron Donald | LA | 14 | 8.4 | 25.3 | 91.2 |
| 6 | Micah Parsons | DAL | 17 | 13.5 | 23.1 | 90.7 |
| 7 | David Onyemata | ATL | 9 | 8 | 26.8 | 90.3 |
| 8 | Trey Hendrickson | CIN | 15 | 11.5 | 25.6 | 90.1 |
| 9 | Dexter Lawrence | NYG | 13 | 9 | 22.2 | 88.9 |
| 10 | Leonard Williams | NYG | 8 | 6.5 | 17.4 | 88.5 |
It is those grades that produce this list — my favorite list, and the one each year I look upon with fondness because, at my core, I love watching football and going “whoa,” and nothing makes me go “whoa” more than watching what these pass-rushers are capable of.
It’s obviously early in the season, so I’ll check back in as our sample size increases. If you don’t want to wait, log in to Premium Stats yourself for this and a host of other unique information you can only find at PFF.
