Everyone's favorite speculative market has once again produced the goods, just when football fans needed it most.
We may still be two months away from the kickoff to the 2021 college football season, but SimBull's recently released college football shares market allows fans to get an early helping of value before the betting season kicks into high gear.
The best place to get into most investments is at the ground floor, making SimBull’s college football shares something along the lines of a once-in-a-lifetime opportunity. It may not completely change your life, but the 10% discount in shares offers immediate value for those interested in getting involved with SimBull for the first time. Another key feature of SimBull is the individual time outlook — unlike futures that force you to wait until the end of the season (or take a vig-heavy buyout), SimBull shares can be cashed out immediately.
Let’s take a closer look at the price through the lens of PFF data by using our College Football Preview Magazine to find the best short- and long-term value opportunities.
INITIAL OFFERING
The initial share offering opens Thursday, July 1 at 7 p.m. EST.
The first 50 shares will receive a 10% discount, and only 100 shares are sold for each of the 65 Power Five teams (including Notre Dame). This lasts for one month until the shares are released for live trading on Aug. 2.
The dividend payouts after each win match the SimNFL at $0.50 per share for any game your team plays. With non-conference schedules, a varying number of games and easy opponents, the dividends in college football have added benefits to focus on, making it a unique SimBull market. It also provides the most value, especially when paired with PFF’s vast college dataset.
PFF COLLEGE DATA
PFFELO is a core piece of our gambling models and provides an up-to-date way of evaluating every team in a market setting.
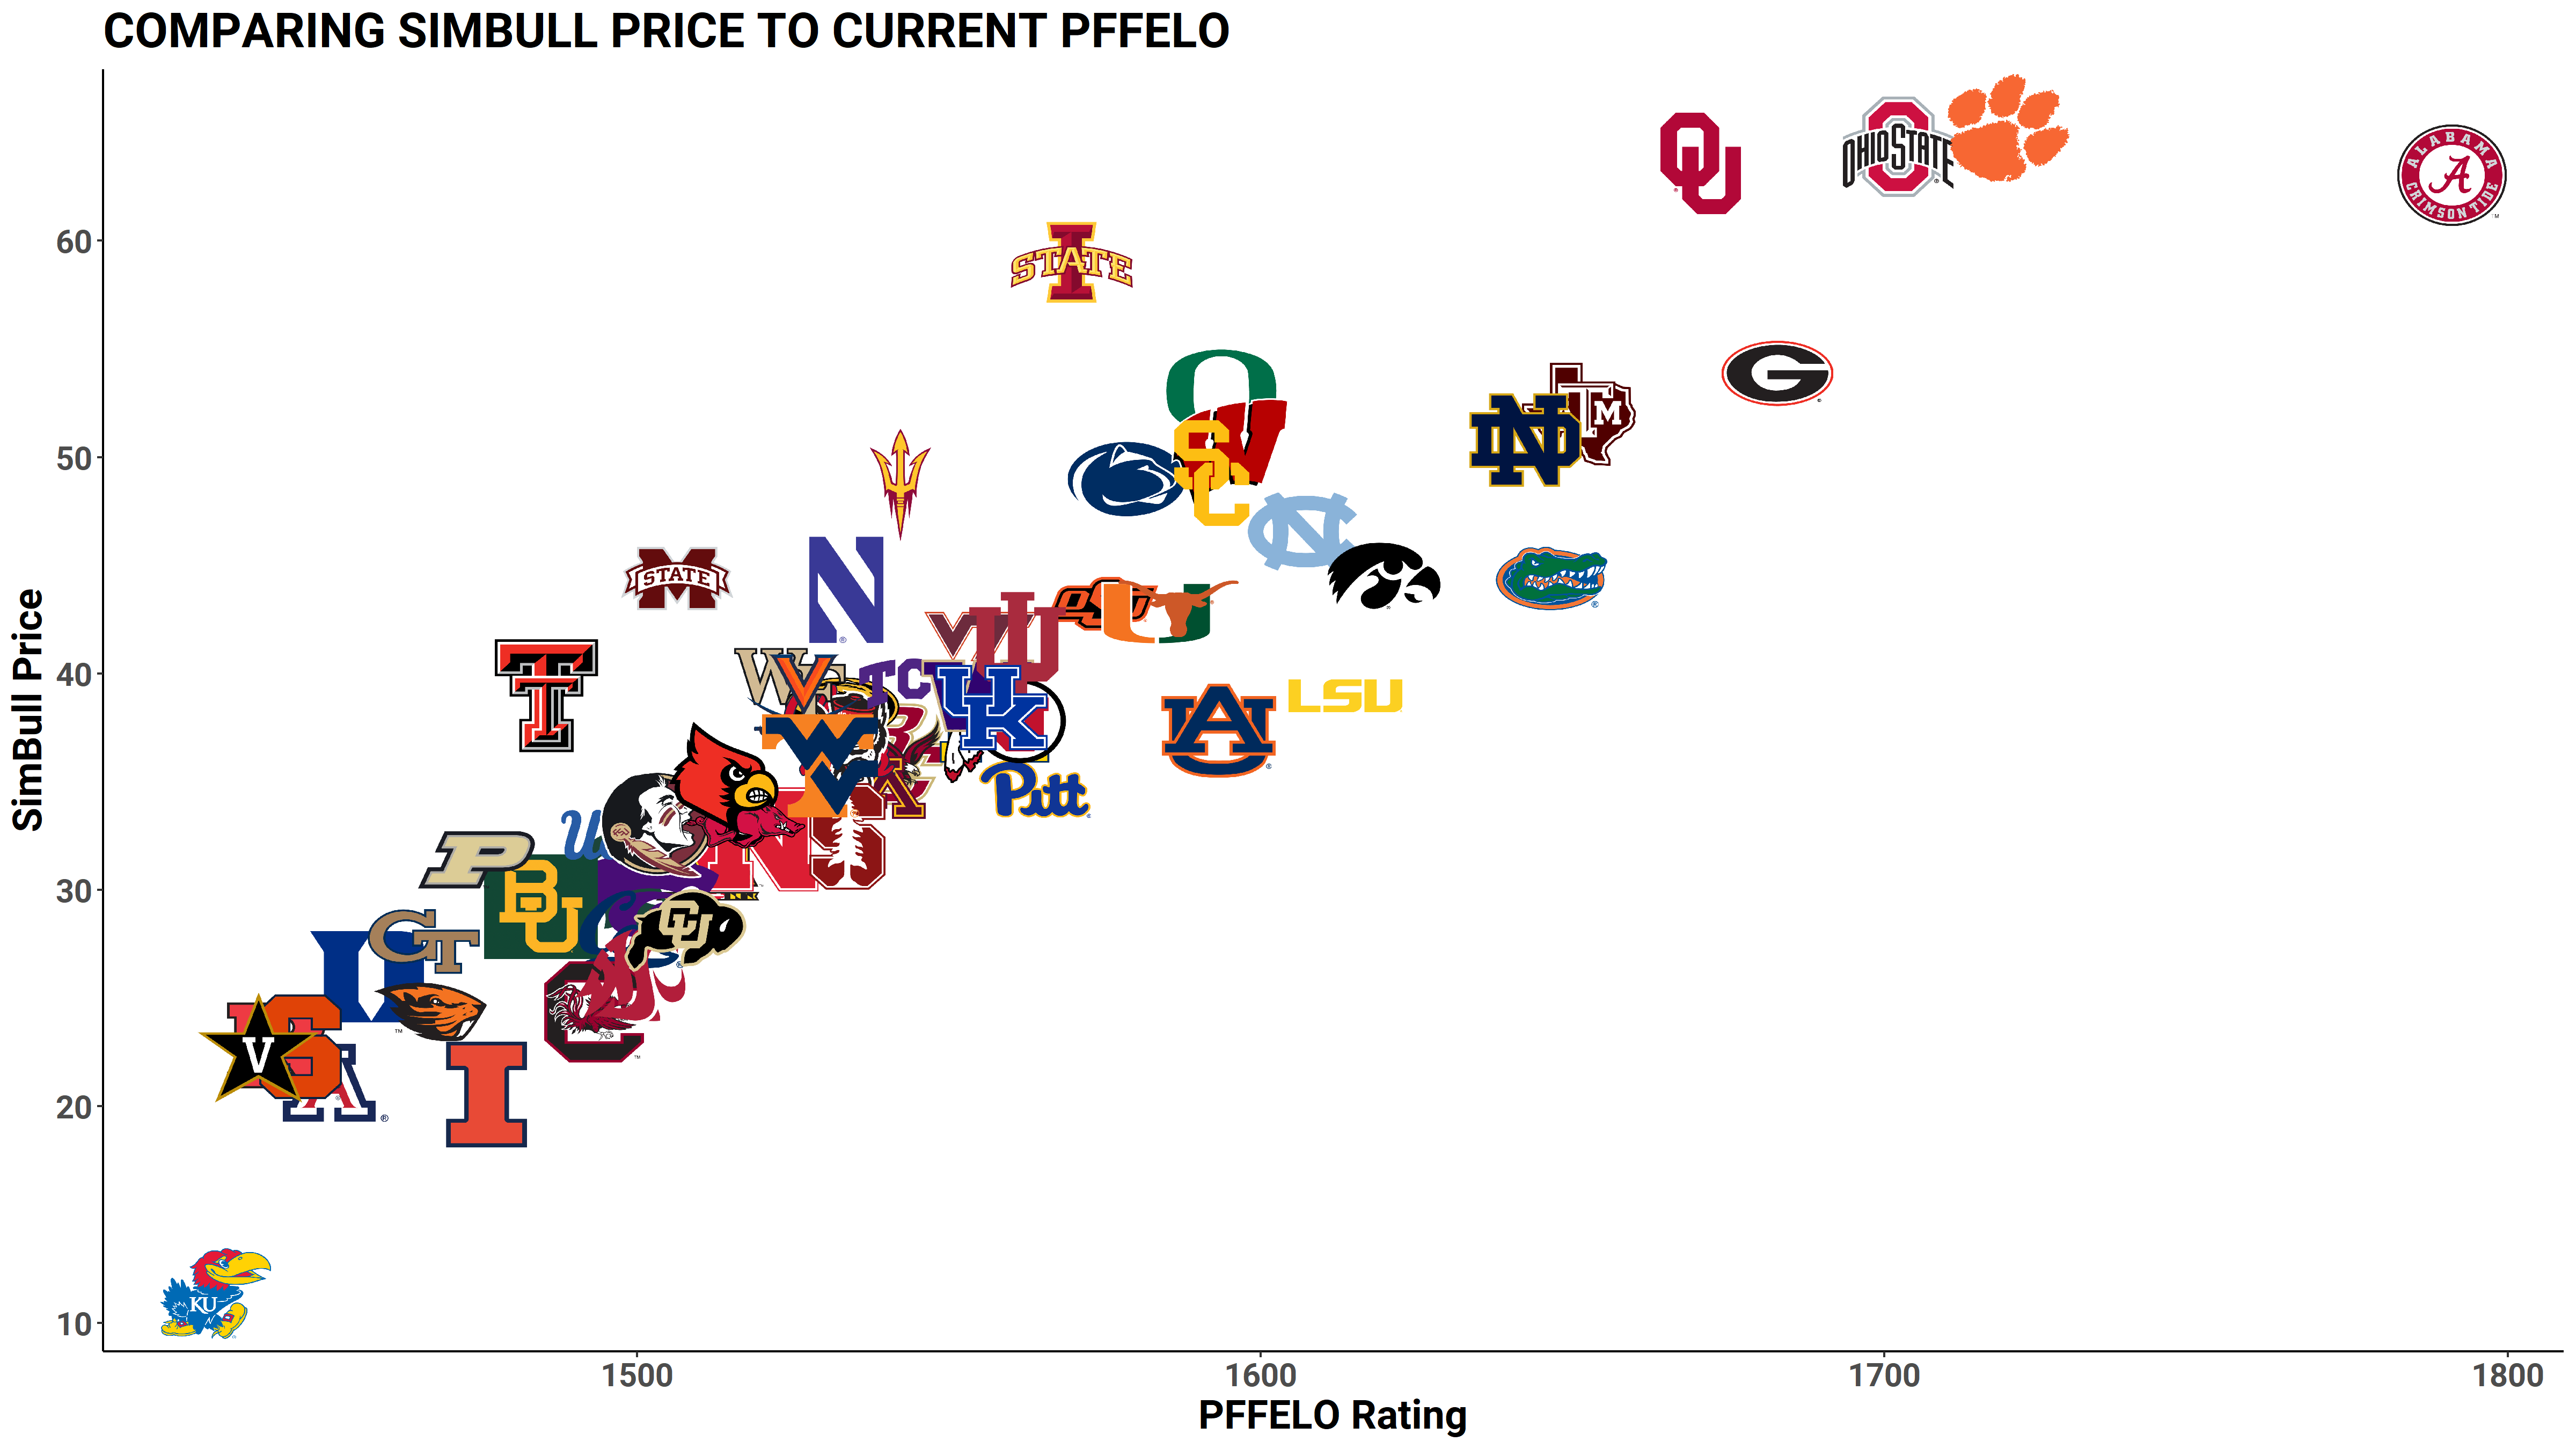
PFFELO is heavily correlated to the initial SimBull price. The SEC teams in the bottom-middle appear to offer value before the season begins.
We can gain more insight by leveraging our season simulation to derive expected outcomes for each team that gives probabilities for potential bonus games. Using each team's betting win total, we can also calculate an expected dividend payout. The table below provides key data points to evaluate each team’s short- and long-term SimBull outlooks.
| Team | Price | Conference Title | Per Playoffs | Implied Market Win Total |
Value Per Elo |
Payout Per Price |
Recruiting |
| Clemson | 65.2 | 54.3% | 56.3% | 11.2 | 26.4 | 8.0% | 4 |
| Ohio State | 64.4 | 47.2% | 51.3% | 11.2 | 26.5 | 8.0% | 3 |
| Oklahoma | 63.6 | 59.8% | 49.4% | 11.0 | 26.3 | 8.0% | 9 |
| Alabama | 63.1 | 52.5% | 68.2% | 11.3 | 28.4 | 8.5% | 1 |
| Iowa State | 59.0 | 11.0% | 4.1% | 9.2 | 26.6 | 6.5% | 53 |
| Georgia | 53.9 | 22.0% | 25.0% | 10.7 | 31.2 | 8.8% | 2 |
| Oregon | 53.1 | 21.3% | 6.0% | 9.2 | 30.0 | 7.8% | 8 |
| Texas A&M | 52.0 | 5.6% | 15.1% | 9.3 | 31.7 | 8.6% | 7 |
| Notre Dame | 50.8 | 0.0% | 5.2% | 8.8 | 32.3 | 7.3% | 11 |
| Wisconsin | 50.2 | 10.1% | 7.4% | 9.5 | 31.8 | 8.1% | 25 |
| USC | 49.3 | 27.4% | 13.2% | 8.3 | 32.3 | 8.6% | 16 |
| Penn State | 49.0 | 1.8% | 2.1% | 8.8 | 32.2 | 7.3% | 13 |
| Arizona State | 48.8 | 9.6% | 2.3% | 0.0 | 31.6 | 7.8% | 32 |
| North Carolina | 46.6 | 20.5% | 13.4% | 9.7 | 34.5 | 9.7% | 19 |
| Iowa | 44.5 | 16.8% | 9.5% | 8.3 | 36.4 | 9.3% | 35 |
| Florida | 44.4 | 9.4% | 11.6% | 8.8 | 37.1 | 9.7% | 10 |
| Mississippi State | 44.4 | 0.3% | 0.2% | 6.0 | 33.9 | 6.0% | 24 |
| Northwestern | 43.9 | 3.4% | 1.0% | 6.2 | 34.9 | 8.3% | 54 |
| Oklahoma State | 43.3 | 9.1% | 4.0% | 7.5 | 36.3 | 9.0% | 36 |
| Texas | 43.0 | 10.5% | 5.4% | 7.7 | 36.9 | 8.9% | 6 |
| Miami (FL) | 42.8 | 6.8% | 3.3% | 9.2 | 37.0 | 8.9% | 15 |
| Virginia Tech | 41.7 | 3.1% | 2.0% | 6.8 | 37.3 | 8.8% | 38 |
| Indiana | 41.2 | 7.1% | 4.3% | 7.6 | 37.9 | 8.8% | 52 |
| TCU | 39.5 | 2.9% | 1.0% | 7.7 | 39.1 | 8.6% | 31 |
| Wake Forest | 39.5 | 2.6% | 1.0% | 6.7 | 38.6 | 8.7% | 62 |
| LSU | 39.0 | 5.5% | 7.7% | 8.3 | 41.4 | 10.4% | 5 |
| Texas Tech | 39.0 | 0.6% | 0.1% | 4.9 | 38.1 | 6.9% | 64 |
| Virginia | 39.0 | 1.6% | 1.0% | 6.2 | 39.1 | 8.6% | 47 |
| Washington | 39.0 | 12.9% | 4.4% | 8.7 | 39.9 | 10.0% | 18 |
| Kentucky | 38.5 | 1.0% | 1.1% | 7.3 | 40.5 | 9.5% | 30 |
| Missouri | 38.5 | 1.0% | 0.8% | 7.3 | 39.9 | 8.9% | 43 |
| Michigan | 37.6 | 5.1% | 2.8% | 7.9 | 41.4 | 9.4% | 14 |
| Auburn | 37.4 | 1.1% | 2.3% | 6.6 | 42.6 | 9.7% | 12 |
| Mississippi | 37.4 | 0.6% | 0.7% | 7.8 | 41.0 | 8.8% | 23 |
| Utah | 37.4 | 12.4% | 4.4% | 8.7 | 41.7 | 10.4% | 34 |
| North Carolina State | 36.8 | 1.4% | 0.9% | 6.4 | 41.6 | 9.2% | 33 |
| Boston College | 36.3 | 4.3% | 1.7% | 7.3 | 42.5 | 10.7% | 56 |
| Tennessee | 35.8 | 0.6% | 0.3% | 5.7 | 42.8 | 9.2% | 17 |
| West Virginia | 35.8 | 2.3% | 0.8% | 6.8 | 42.8 | 8.4% | 41 |
| Louisville | 35.2 | 1.0% | 0.3% | 6.6 | 43.0 | 8.3% | 48 |
| Minnesota | 34.8 | 3.8% | 1.8% | 7.0 | 44.2 | 9.9% | 40 |
| Pittsburgh | 34.7 | 3.7% | 2.2% | 7.2 | 45.1 | 10.9% | 46 |
| Arkansas | 33.0 | 0.2% | 0.1% | 5.5 | 45.9 | 8.0% | 27 |
| Florida State | 33.0 | 0.3% | 0.1% | 5.7 | 45.5 | 8.0% | 20 |
| Stanford | 32.5 | 4.9% | 1.0% | 4.0 | 47.2 | 9.1% | 26 |
| UCLA | 32.5 | 1.9% | 0.2% | 6.9 | 46.1 | 8.0% | 28 |
| Nebraska | 32.3 | 0.9% | 0.3% | 6.3 | 47.0 | 7.7% | 21 |
| Maryland | 32.0 | 0.8% | 0.2% | 5.8 | 47.3 | 8.9% | 29 |
| Purdue | 31.4 | 0.7% | 0.2% | 5.2 | 46.9 | 7.4% | 45 |
| Michigan State | 30.3 | 1.2% | 0.2% | 4.8 | 49.4 | 9.7% | 37 |
| Kansas State | 29.8 | 2.0% | 0.4% | 5.8 | 50.5 | 9.7% | 60 |
| Baylor | 29.3 | 1.6% | 0.3% | 5.2 | 50.8 | 9.9% | 44 |
| California | 28.2 | 3.3% | 0.4% | 5.8 | 53.2 | 10.7% | 39 |
| Colorado | 28.2 | 2.1% | 0.3% | 4.5 | 53.5 | 9.4% | 50 |
| Georgia Tech | 27.6 | 0.0% | 0.0% | 5.0 | 53.0 | 7.1% | 42 |
| Washington State | 26.5 | 2.2% | 0.4% | 6.0 | 56.5 | 11.8% | 58 |
| Duke | 26.0 | 0.3% | 0.0% | 3.7 | 56.0 | 9.8% | 59 |
| Oregon State | 24.4 | 1.3% | 0.2% | 4.5 | 60.2 | 10.7% | 68 |
| South Carolina | 24.4 | 0.2% | 0.1% | 4.0 | 61.2 | 10.0% | 22 |
| Rutgers | 22.8 | 0.0% | 0.0% | 0.0 | 63.4 | 9.5% | 57 |
| Syracuse | 22.8 | 0.1% | 0.0% | 3.3 | 63.6 | 10.4% | 55 |
| Vanderbilt | 22.8 | 0.1% | 0.0% | 3.4 | 63.3 | 9.7% | 51 |
| Arizona | 21.1 | 0.6% | 0.0% | 2.5 | 68.6 | 10.4% | 65 |
| Illinois | 20.6 | 1.0% | 0.1% | 3.9 | 71.7 | 12.2% | 67 |
| Kansas | 11.4 | 0.2% | 0.0% | 1.7 | 125.9 | 17.0% | 65 |
BEST SHORT TERM BUYS
FLORIDA GATORS
The initial SimBull pricing appears to overweight those in contention for the conference title, as there are numerous mispriced SEC teams. None seem more glaring than the Florida Gators, who are seventh in our PFFELO rankings but are priced as the 17th-most-expensive team.
Emory Jones is PFF’s leading breakout candidate and currently has the third-best ranking at the position in the SEC.
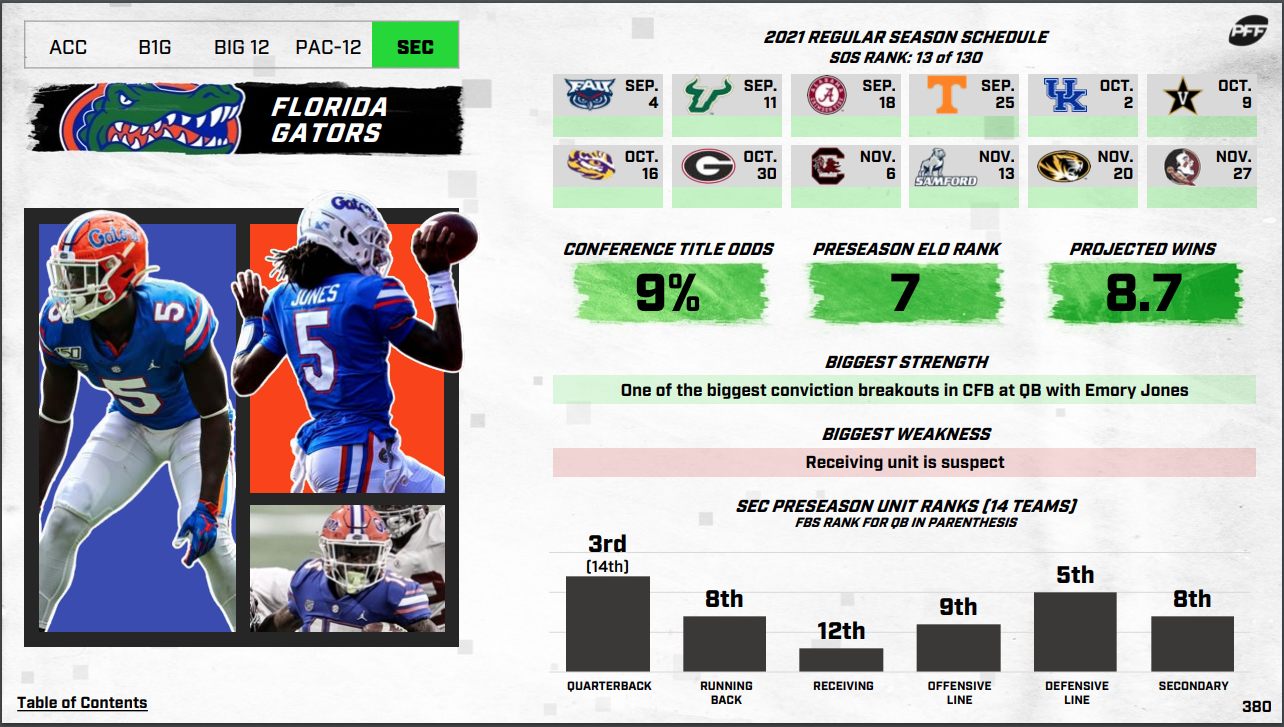
The skill position players around Jones have next to no experience, but help is always on the way at a blue blood school. After finishing in the top 10 in recruiting over the previous three seasons, Dan Mullen & Co. will soon welcome the 12th-ranked recruiting class for the 2021 campaign.
No matter what happens outside of the quarterback position, Jones has Heisman-worthy upside. If he comes close to that range of outcomes, Florida will be priced as a top-five team, with playoff aspirations following closely behind.
LSU TIGERS
The 2019 season feels like a decade ago, but we are only one year removed from a historic LSU offense running away with the National Championship. The Tigers are a top-10 team based on our current ELO ratings but fall outside the top 25 for initial SimBull price.
The initial SimBull pricing hasn’t fully captured conference strength, as the team that emerges from the SEC is a short step away from the National Championship. This has played out over the past two seasons, and without generational-level quarterback play outside the conference, it should be the theme for the foreseeable future. With this understanding, the mid-tier of the SEC is undervalued compared to the expected outcome.
After a derailment in 2020, things look promising for the Tigers heading into 2021. Myles Brennan is expected to be healthy and showed that he is the far superior quarterback to Maxx Johnson and T.J. Finley in this offense. His big-time throw rate of 7.5% paired with a turnover-worthy play rate below 1% shows quality decision-making and the ability to make every throw on the field.
Derek Stingley Jr.’s return as the top cornerback in college football buoys a defense that collapsed last season. Stingley’s absence paved the way for quality reps to be directed elsewhere, which bodes well for this secondary in 2021. Eli Ricks and Stingley easily form the best outside cornerback duo in the FBS, which will allow the offense to find its rhythm during the non-conference schedule.
LSU should start 6-0 before taking on Florida and should be priced as a top-10 team heading into that SEC showdown. This looks like the ideal timeframe to hold LSU shares unless their long-term prospects brighten throughout this stretch of their schedule.
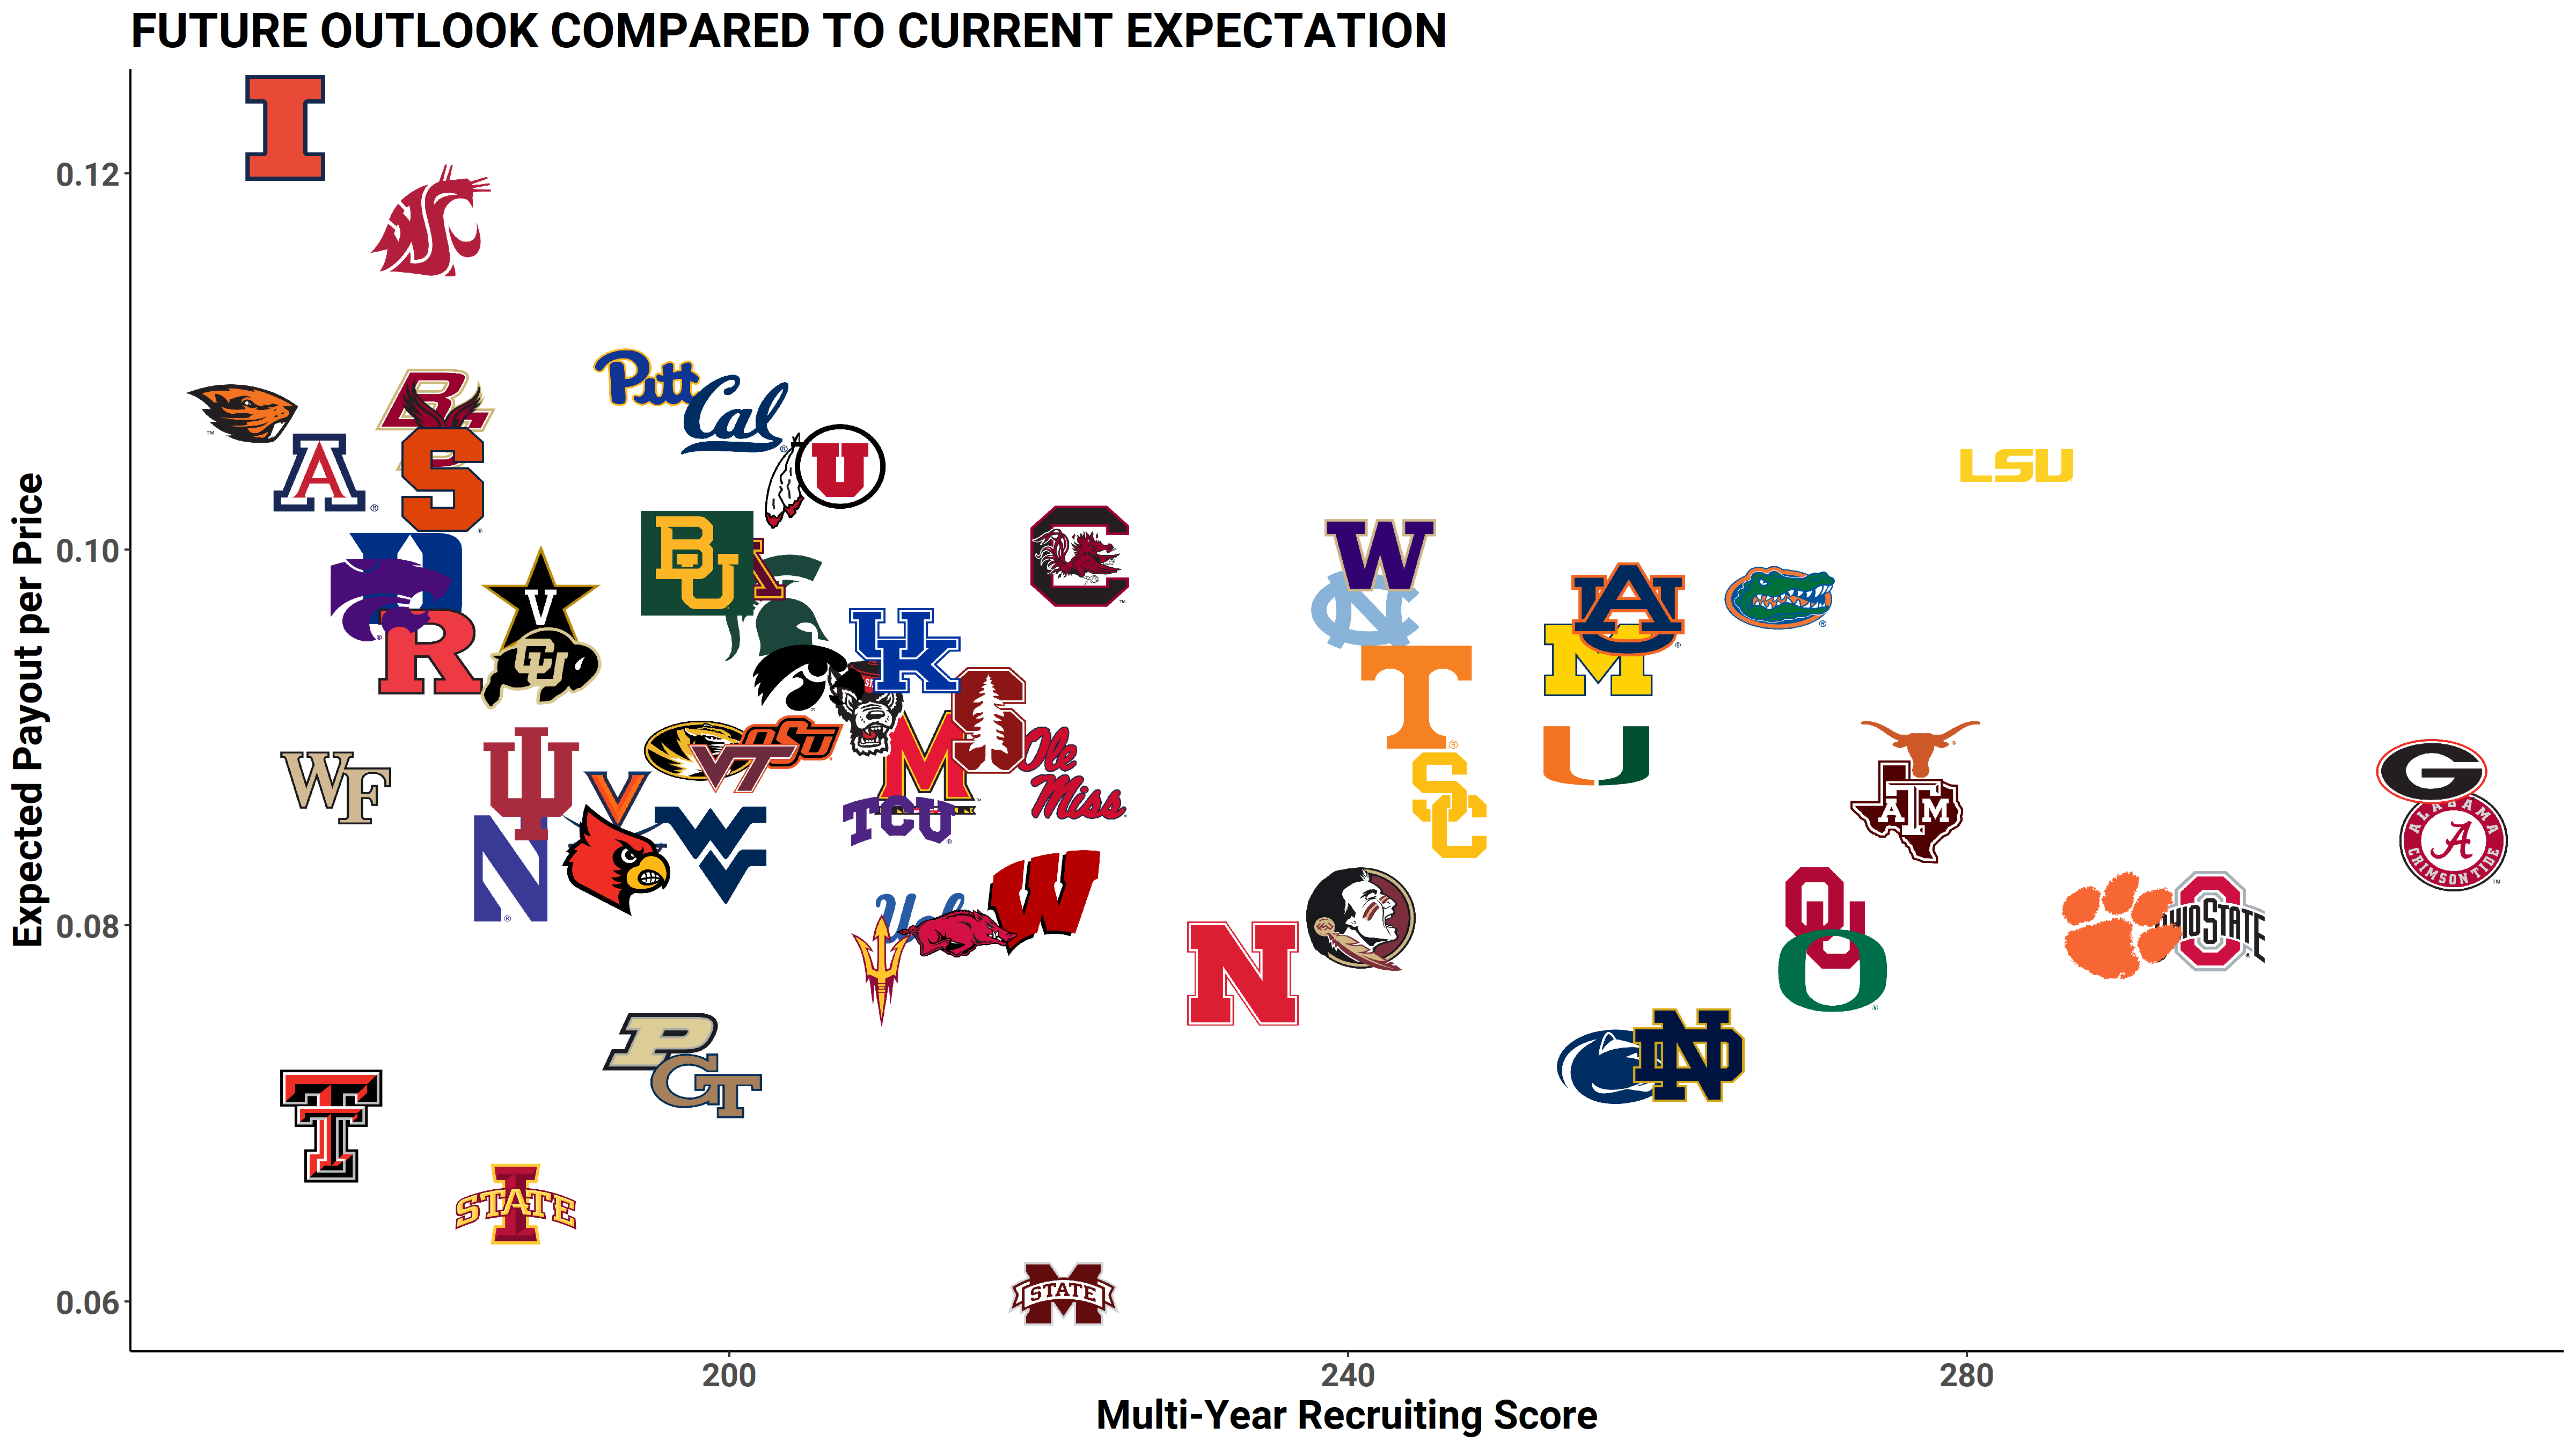
BEST LONG TERM BUYS
The expected payout for this season is based on PFF’s win total simulation compared to the multi-year recruiting score for Power Five teams.
STANFORD CARDINAL
Stanford doesn’t look ready to compete for a conference title this year, given their minuscule four-game win total. The 11th-most-difficult strength of schedule will do them no favors either, as they also have the second-worst preseason unit ranking at quarterback and secondary.
Tanner McKee is a former top-50 recruit who should compete with Jack West for the starting quarterback position. The long-term prospects brighten for Stanford if McKee gets the nod to start the season.
The Cardinal appear to be a team that can be bought on their low, as David Shaw offers continuity that is rare among college head coaches. In addition, this offense is a consistent top-20 unit in expected points added (EPA) per play and should once again be one of the most efficient in the Pac-12 conference.
Stanford's issues always boil down to the defensive unit, but some positive regression could be all it takes to challenge for the Pac-12 crown. Stanford appears to be another year or two away, but even if they don’t challenge for the College Football Playoff, they should still return value as the 45th-priced team on SimBull.
TENNESSEE VOLUNTEERS
Tennessee may have hit the reset button before the 2021 season, but their long-term outlook appears to be bright. New head coach Josh Heupel brings documented offensive success after cutting his teeth under Bob Stoops as both a player and coach at Oklahoma. In three seasons as head coach for UCF, Heupel’s offensive unit maintained top-10 rankings in EPA per offensive play among all FBS teams.
Add in Virginia Tech Transfer Hendon Hooker, and the Volunteers could offer an immediate return based on their dividend payout. Four-star recruit Kaidon Salter being dismissed does dampen their long-term outlook at quarterback, but if Hooker exceeds expectations, then Heupel should have his pick of transfer quarterback candidates in coming years.
Tennessee has already performed in the recruitment ranking, sitting 22nd this season and 17th overall the past three years. Buying into a coach with a track record of recruiting and offensive success at an SEC program looks like the perfect approach to build a successful SimBull portfolio.