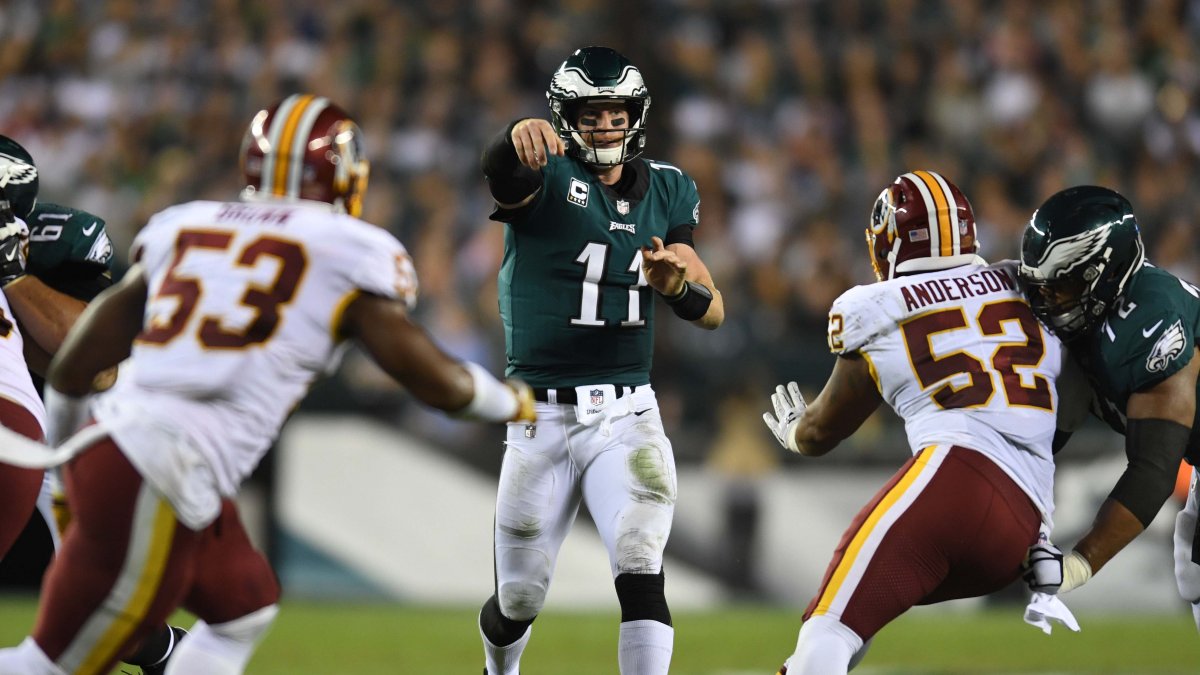
We don’t need any math to know that we are quick to remember the times where a quarterback creates a successful play amidst a sure failure. Carson Wentz had many such plays last season, in Week 7 against Washington, he sidestepped an onslaught of pass-rushers and threw a perfect strike to generational talent Corey Clement on 3rd & Goal from the 9-yard-line to break their divisional rival's backs. These plays are hard to forget and make us sit in awe of a quarterback’s poise and talent – as we should. Those plays are massively important and often determine the outcome a game. However, it is important that we don’t confuse plays that explain what happened with performance that is likely to happen again. When you win the lottery you don’t immediately buy more lottery tickets (you go straight to Vegas).
Pressured plays by nature are diverse. You’d be hard-pressed to find two plays under pressure that look exactly alike. To pile on, pressure occurs on just about 35.0 percent of dropbacks making the sample size of pressured plays much smaller than its ‘less-sexy' counterpart, the clean pocket.
This begs the question, if we want to predict the future, should we put more stock in how a quarterback plays under pressure or from a clean pocket.
Traditional data points: under pressure vs kept clean
To get our bearings, we’ll start by looking at a couple of metrics that everyone is very familiar with: completion percentage, yards per attempt and passer rating. We considered all quarterback seasons with more than 150 clean dropbacks and 75 pressured dropbacks. We then looked at the correlations between performance on a season-to-season basis. This will allow us to compare the stability for each metric in each scenario, in other words, how well does each metric in each situation tell you about that metric in the next season.
Completion percentage is likely the least exciting of the three, without knowing how far downfield a quarterback throws the ball and how many passes his receivers drop, completion rate is generally not the best measure of quarterback performance. There is also a very minor detail that has to do with what happens when a quarterback doesn’t throw the ball. That being said, it’s simplicity makes it a nice place to start. Completion rate under pressure is correlated at a rate of 0.30 while clean-pocket completion rate comes over the top at 0.52. Completing passes under pressure is impressive but not nearly as likely to remain at a given rate in the following season.
Yards per pass attempt isn’t perfect either as it again leaves out pass plays where there is no attempt. However, it does a little better job of summarizing quarterback performance and it isn’t skewed by touchdowns and interceptions which are both very unstable and not necessarily a great indicator of how well a quarterback plays. With the added importance comes a decrease in stability on both sides. Under pressure yards per attempt is correlated at a rate of 0.26 while the clean pocket variant is correlated at a rate of 0.36. Not only is each less stable than completion rate but we also see the gap between the two shrink a little bit, the caveat of course being that the quarterback must survive the pressure to throw in the first place.
Passer rating again leaves out sacks but adds a substantial adjustment for interceptions and touchdowns even though neither is a perfect representation of how many exceptionally-good or exceptionally-bad throws a quarterback makes. Passer rating is again less stable that the first two metrics we looked with clean pocket passer rating at 0.35 (just a hair below yards per attempt). What is interesting is the dramatic drop off in stability for passer rating under pressure which is correlated at a rate of just 0.15. If you must look at passer rating, thoughts and prayers if you must, you are wise not to expect a repeat of a quarterback’s passer rating when pressured.
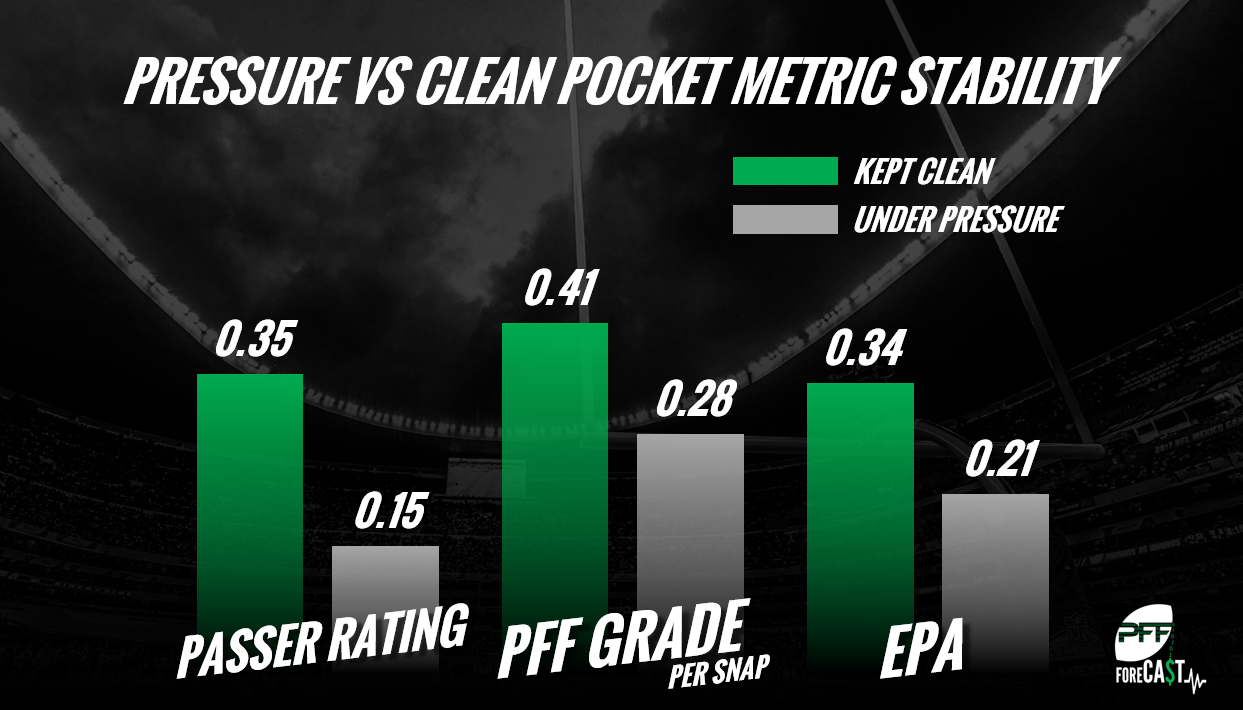
While each of these stats have rather large flaws, they do give us a hint and what to expect: Performance from clean pockets is more consistent than performance under pressure.
For even more in-depth breakdowns on quarterback play and much, much more – grab the 2017 QB Annual before this season starts!