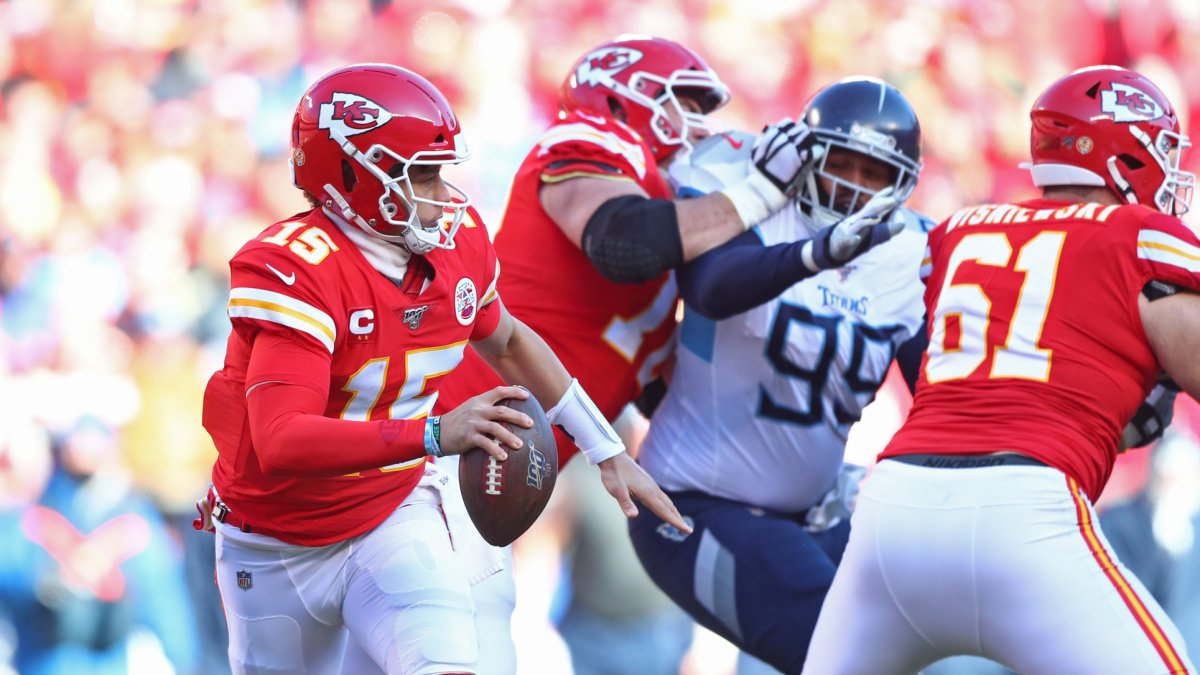
When the Kansas City Chiefs and San Francisco 49ers square off in Miami on Sunday in the most important game of the season, a lot of focus will be on the passing game. This is often the case in the NFL, but the focus on the aerial attack will become all the more prevalent when the best passing offense in the league (as measured per EPA per pass play) in Kansas City faces the fourth-best passing offense in the league in San Francisco. In this article, we want to examine the two passing games by quantifying their scheme while pointing out similarities and contrasts.
The Chiefs and 49ers are winning with motion, play-action and horizontal routes
To quantify the similarity between the schemes of different offenses, we can use a clustering method that we first applied to our route data during the 2019 offseason. The chart below shows every season for every offense since 2014, with Andy Reid's teams (Chiefs) and Kyle Shanahan's teams (Cleveland Browns, Atlanta Falcons and 49ers) highlighted. The closer the two points are on the chart, the more similar the offenses are. Two points with the same color are contained in the same cluster and can also be considered close to each other, even though they may somewhat differ on the first two principal components.
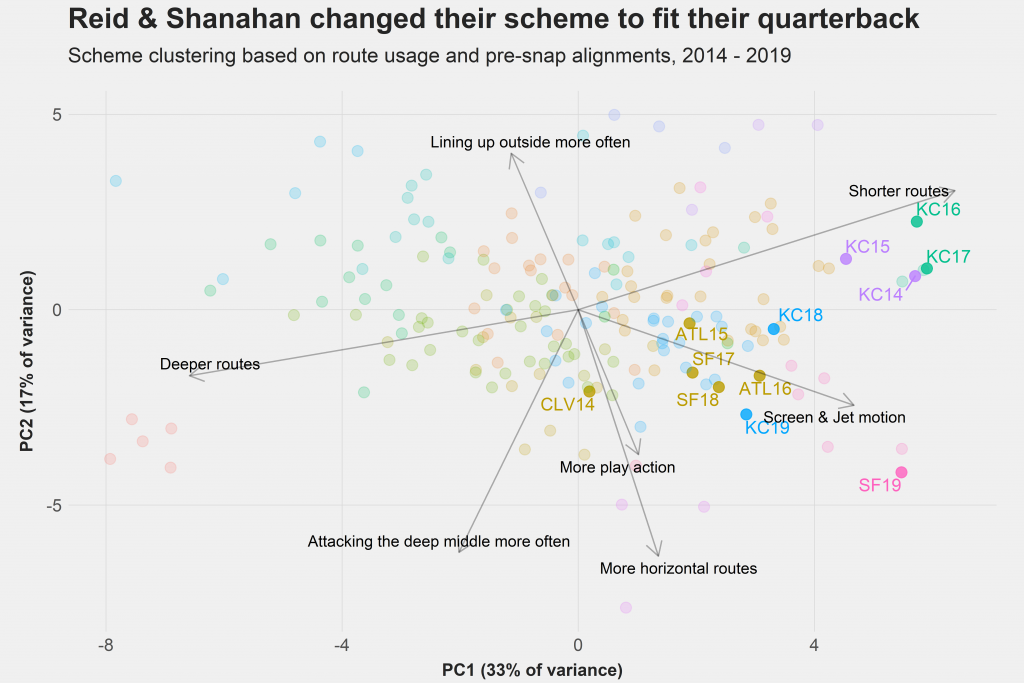
When focusing on Andy Reid's offenses, we clearly see that he changed his offense after he paired up with Patrick Mahomes, as he went away from running the shortest routes of the league (which suited Alex Smith but obviously wouldn't have played to Mahomes' big-play ability). In 2019, he went further away from his old offense. Not being content with what his offense did in 2018 and still finding the best iteration of himself after two decades as a head coach in the league has potentially played a huge role in why his offense has hardly regressed in 2019 despite Mahomes' early-season injury problems that made it virtually impossible to keep pace with the unsustainable performance from his MVP-winning 2018 campaign.
Interestingly, we note a similar pattern for Kyle Shanahan, who imitated his Falcons offense in his first two years in San Francisco. In his first year with Jimmy Garoppolo as the full-time starter, though, Shanahan has been smart enough to realize his new starting quarterback's path to success is not the same as Matt Ryan's path to success, and he pivoted to more horizontal and shorter routes, making use of Jimmy Garoppolo's fast release and the subsequent ability to deliver quick throws on time.
Overall, the passing schemes of the two Super Bowl contestants are not far away from each other, yet they are in different clusters. The following chart illustrates the similarities and differences in a detailed way. Naturally, the 49ers are represented by the golden dots and the Chiefs by the yellow dots.
[Editor's Note: Subscribe today using promo code PFF30 and save 30% off an EDGE or ELITE Annual subscription.]
