A few weeks back, we studied what we called “true pass sets” in an attempt to properly weigh noise in the evaluation of pass protectors. The other side of the coin is pass-rushers — the folks in charge of making life more difficult on the quarterback and easier on their own coverage players.
We’ve taken a deep dive into our ability to measure pass-rushing before, extending Brian Burke’s analysis to pressure-level data here and showing how effective pass-rushing grades and data are here. Now, we want to see if there’s more we can do to curb the noise associated with evaluating players as they rush the passer.
Where would noise arise from? For one, scheme. We know that there’s a decent amount of variance with respect to how many pass-rushers a team brings on average, with the Detroit Lions on the low end of the list and the totem pole and the Baltimore Ravens on the upper end. Facing more or fewer double teams as a result of bringing fewer or more pass rush players, respectively, will have an impact over the course of a season.
#Ravens defense, man pic.twitter.com/bOlr3C6VSb
— Eric Eager ???????? (@PFF_Eric) January 2, 2020
Another thing that could influence win rates as a pass-rusher is opponent tendencies. While all sports give the illusion of fairness, both at the team and the individual level, the NFL schedule year-to-year is not uniform for all teams, giving some players an uneven slate of quick throwers, high rollout rates, frequent play-action plays, etc. Thus, while this is not scheme-driven in the commission sense, it is significant to think about when evaluating players.
All Plays
As a baseline, let’s look at how sacks and pressures are correlated year-to-year for players on all of their snaps. These correlations are about as high as any player-level feature in football (run defense is generally more stable, but less valuable).
| Sack Rate | Pressure Rate | Grade/Play | Win Rate |
| 0.51 | 0.72 | 0.72 | 0.73 |
Correlation coefficients for variance pass-rushing metrics. Snap threshold of 250 pass-rushing snaps per season, yielding n = 1282 season-pairs.
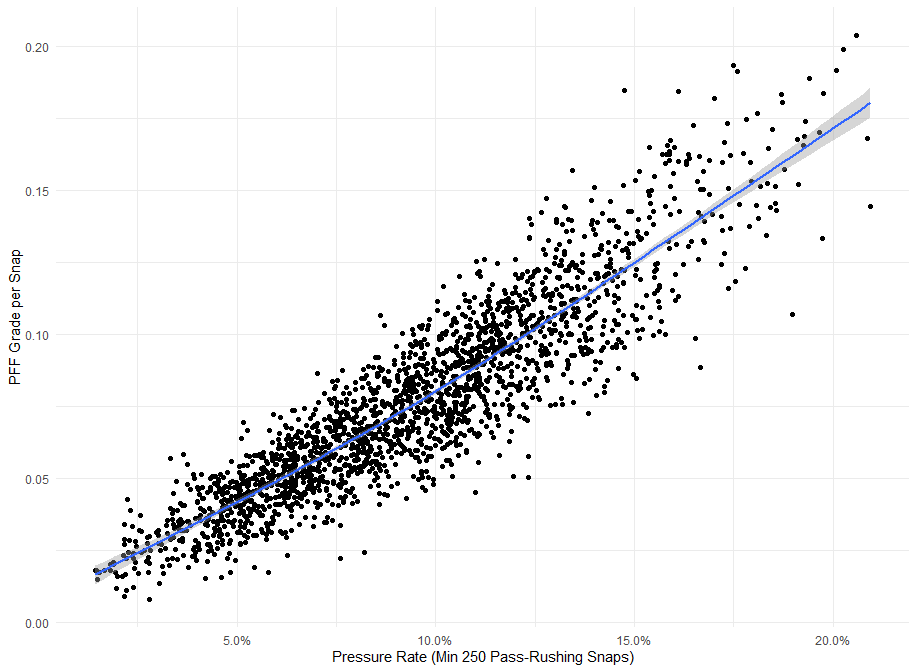
First, it’s good to see that these numbers are high but interesting to note that the last three are roughly the same. Win rate (the rate at which someone earns a PFF grade > 0) is slightly more stable than grade per snap and pressure rate, but it’s important to note that the latter two, while significantly correlated, are not perfectly correlated due to the fact that one can get a pressure without a positive grade (e.g. Vic Beasley getting an unblocked sack) or a positive grade without a pressure (e.g. Aaron Donald beating a LG on a quick throw).
Some of our data are only available for certain seasons. Thus, so as to make a proper comparison, we will only look at data from 2012 to the present.
| Sack Rate | Pressure Rate | Grade/Play | Win Rate |
| 0.48 | 0.70 | 0.73 | 0.73 |
Minimum 250 pass-rushing snaps, n = 711 players.
