The 2020 season is five weeks away, and while the uncertainty of the past few months has been gnawing, I’m throwing a little caution to the wind today to geek out about something I’ve been studying for a few years — offensive and defensive schemes.
[Editor’s Note: PFF’s advanced statistics and player grades are powered by AWS machine learning capabilities.]
I’m a data scientist, and while I have a decent understanding of the game of football, something does get lost when someone like me tries to classify offenses and defenses with the naked eye compared to true football geniuses like the Bill Belichicks and the Andy Reids of the world.
Luckily, people like me have tools that can help us get closer to understanding the variations and nuances of different schemes that NFL and NCAA football teams run. These mathematical tools, along with the data we collect at PFF, are a formidable match. So, let’s get started on these methods and how they set us up for the coming fall.
Data
Our data has evolved a decent amount over the past 10 years or so, and one of the great evolutions has been the genesis of our collection of play-level data that can capture scheme. Some of these variables include whether there was play action or a run-pass option on a play, if such action resulted in the quarterback rolling right or left, how long it took the quarterback to throw a pass and which route he targeted (along with the other routes that receivers ran on the play).
In the run game, we chart primary and secondary run concepts, direction of the run play and if the run play came out of the shotgun, under center or in the pistol. Personnel groupings and actual formations are charted (and have been since we started), and things like whether there was motion on a play (which our friends at ESPN have showed adds a lot of value) are included in the data.
On the defensive side of the ball, coverage schemes are charted, whether the middle of the field was open at the snap (and whether it was actually played as open, as opposed to shown), the number of pass rushers used and so on.
These variables have a number of issues if taken wholesale. For example, the amount of time a team runs play action on early downs is not independent of the amount of time they are in something other than 11 personnel or under center. The amount of time a team plays Cover 1 is not independent of the frequency in which they blitz.
Hence, while there are a number of features in a “scheme” dataset, the number of actual features is quite smaller and needs to be calculated via a technique known as principal component analysis, which is a linear dimensionality reduction technique that is ubiquitous in statistics and data science (you can learn more about this technique here).
Analysis – Offense
Once PCA is performed, we can look at these new variables to see how “close” teams and play-callers are to each other, either quantitatively through a calculation of distance or visually through something like the plot below:
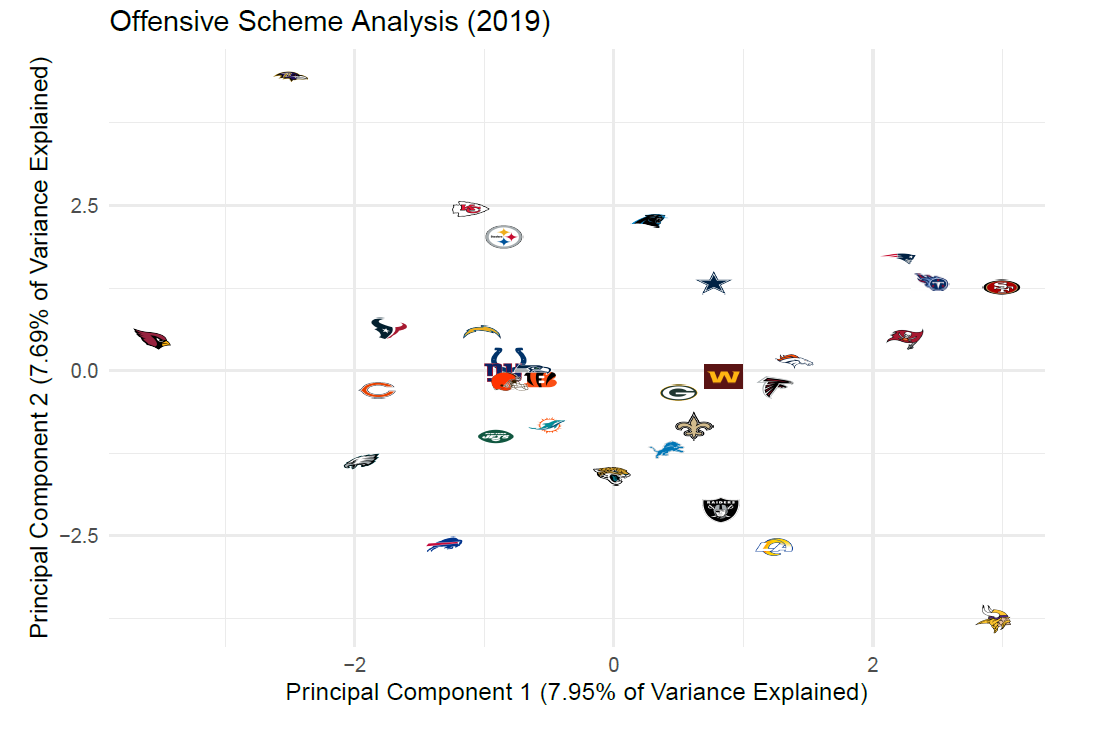
Here, the X-axis represents the linear combination of the aforementioned offensive variables, which explains the highest percentage of the variance in this scheme-related data in the NFL from 2014 to 2019. This percentage (just under 8%) is not particularly high and is rivaled by the second principal component, which is displayed as the Y-axis in the plot above.
Still, despite the the large number of principal components necessary to capture a great deal of the variance in a data set modeling scheme at the NFL level, a simple plot like this does reveal some things:
