As a part of our pre-draft coverage, I wrote an article that looked at rookie performance and learned that the step from college to the NFL comes with a steep learning curve. I discovered that first-year players struggle not only when it comes to earning playing time but also when it comes to performing at a high level when they are on the field; we also learned that there are differences across positions, with linemen generally having the hardest acclimation period while running backs are mostly ready on Day 1.
So, it isn’t the end of the world if a first-year player gets off to a bad start, as bad rookies are supposed to improve, but it doesn't necessarily mean that this disappointing first year is meaningless. If Player X has a better rookie season than Player Y, we would expect both to improve in Year 2, but how confident can we be that Player X will keep the edge and have a better career? And how much does the prior from draft status still matter after the rookie season?
We at PFF take great pride in grading and charting every player on every play of every game — a necessary process in a sport in which sample size is king. Because of this, it’s fairly obvious that the combined performance after two years is more predictive toward future performance than just the rookie year. But, what if we keep the sample size the same?
The following chart shows the year-to-year R-squared values of PFF Wins Above Replacement (WAR) of NFL players with different levels of experience.
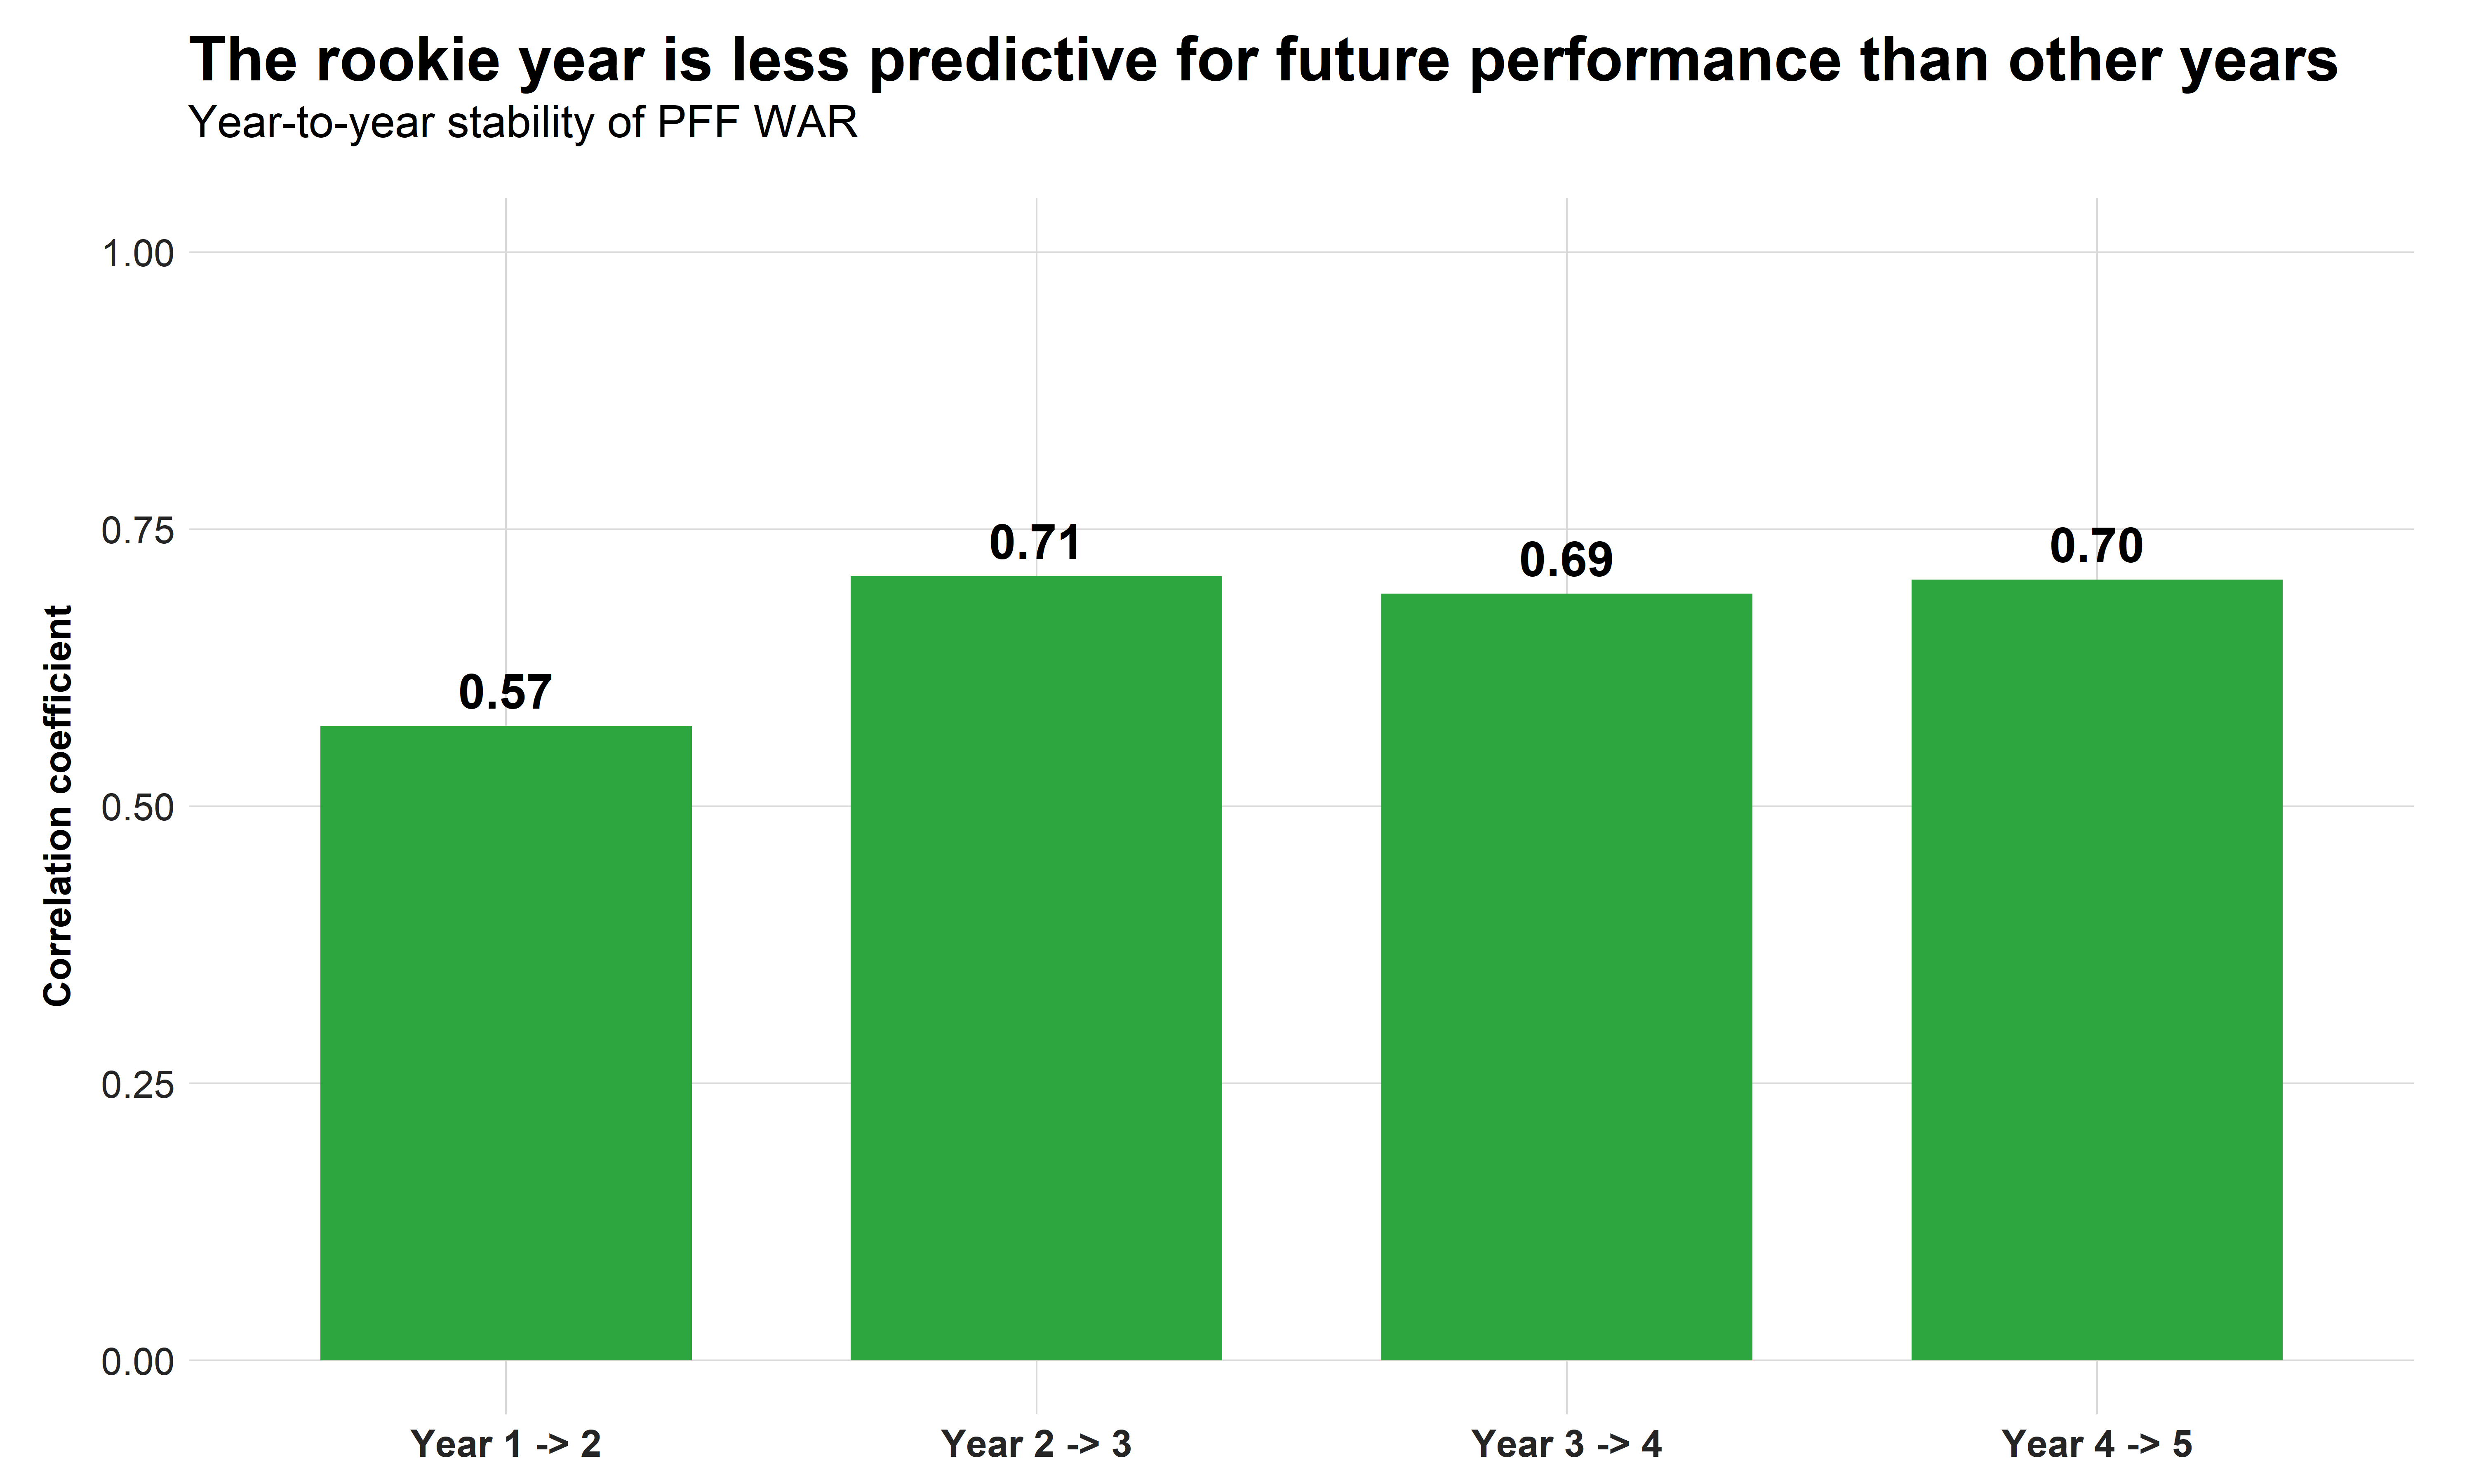
We notice that the rookie year is indeed less predictive than the following years as it pertains to next-year performance. In particular, when forecasting a player going into Year 3, we should weigh the second year higher, especially when there is a large discrepancy between Year 1 and Year 2 performance.
To gain even more insight, we can perform a more nuanced analysis for each position group. Since there doesn’t seem to be a difference in the inherent predictive power of Year 2 through Year 4 when it comes to predicting the next year, we compare the correlation between WAR in the first and second year to year-to-year correlation when going from Years 2,3 and 4 to Years 3,4 and 5.
To get a feeling for the uncertainty of our analysis, we bootstrap 1,000 times from a 50% sample of all players of a given position. This means that for, say, wide receivers, we will randomly select half of all wide receivers drafted between 2005 and 2015 and then compute:
- The correlation between WAR in the first and second year
- The correlation between WAR in the first and second year when we also use draft status as a predictor
- The year-to-year correlation when going from Years 2,3 and 4 to Years 3,4 and 5
- The year-to-year correlation when going from Years 2,3 and 4 to Years 3,4 and 5 when we also use draft status as a predictor
We iterate this process 1,000 times and visualize all 4,000 computed correlation coefficients in a chart. The mean correlation coefficients are visualized with a dashed line, and the width of the distribution can be considered as a measurement of how certain we are that we would find the same mean correlations when performing the same analysis for players who joined the NFL via the draft classes of 2016 through 2025.
Quarterbacks
