In recent years, football analysts have developed numerous metrics — to varying degrees of success — attempting to quantify QB performance and production.
Quarterback expected points added per play (EPA/play) and QBR measure a quarterback's performance by looking retrospectively at the result of the play given the game situation. PFF's quarterback grades materialize from the QB's production with little regard for the play's outcome — for instance, PFF grades won't punish a QB for a good throw even if the interception resulted from a wide receiver's drop. Completion percentage over expected (CPOE) measures a QB's ability to complete passes relative to expectation.
Choose your preferred analytical statistic, but they all share a methodology of evaluating results based on retrospective performance.
Until this point — at least publicly — nobody has attempted to quantify a QB’s process or his decision-making (how well a QB positions himself for success based on his attempt selection).
This article on QB decision making represents a new way to evaluate QB play, which is rooted in their decision-making process and subsequent abilities to perform based on the situations they’ve created for themselves.
Methodology
The methodology to evaluate QB decision-making is relatively straightforward. The end goal is to assign an EPA value for every route run by a receiver had the QB thrown the ball to him, which we will call “QB decision model.”
The first step in arriving at this QB decision model was developing a completion probability model. Without the completion probability model, the QB decision model would wrongly assume a completion when there was uncertainty and differing completion probabilities.
Therefore, we built an XGboost model to derive completion probabilities based on game situation, route, defensive-back ability, receiver separation, men in the box and other defensive situational factors. Defensive-back ability basically means the model was opponent-adjusted; therefore, good QBs are rewarded more for targeting a good coverage player than an average coverage player if both were in the same situation. Nonetheless, most important for us, each factor used in this model is repeatable for each player running a route such that we could assign a completion probability to routes when throws were not actually made.
With each route assigned a completion probability, we were able to build a more accurate QB decision model. Again using XGboost and with completion percentage as a variable, the QB decision model predicted every player running a route's EPA.
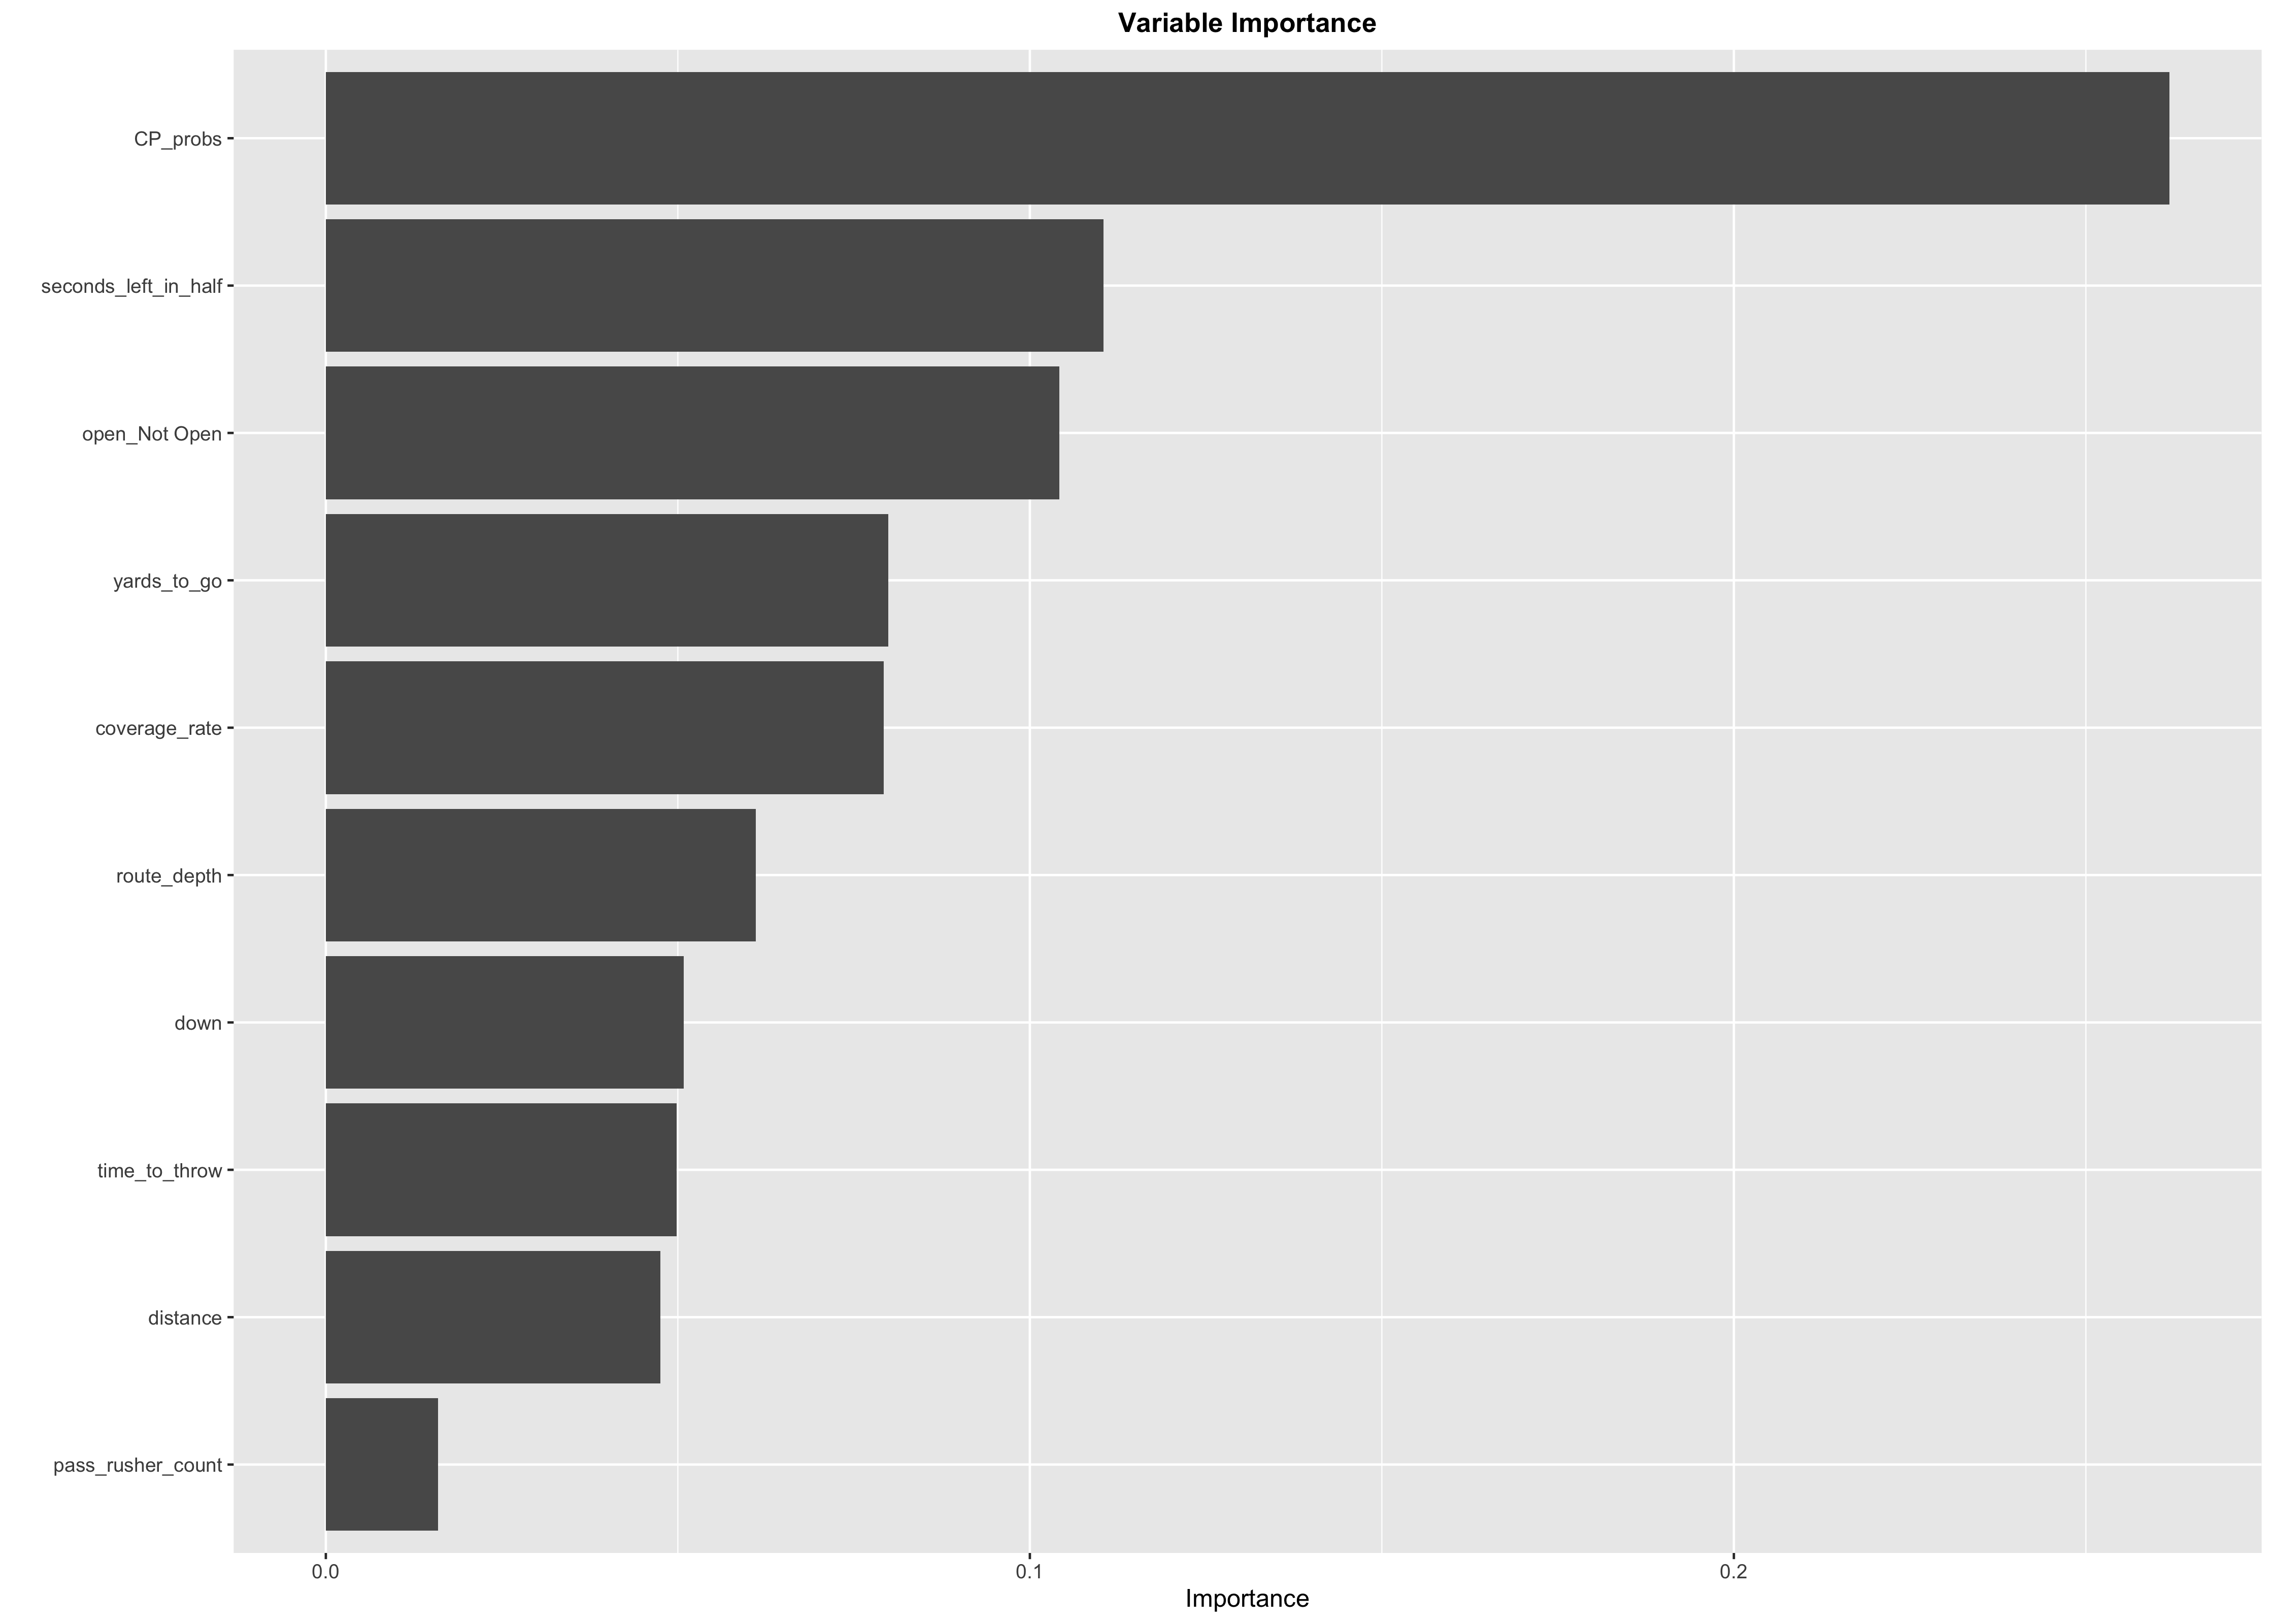
Unsurprisingly, the completion probability is the most important predictor in our model. Situational game features such as yards to go, time, down and distance are all important in evaluating each route's EPA. Other important predictors include the coverage player's cumulative PFF grade until that play, the route, the depth of the route and whether or not the receiver is open. These predictors should be rather intuitive, as an open receiver on a 17-yard post against a bad corner should be expected to have a higher EPA than a receiver running a six-yard out while being covered by an elite corner.
Now, we can see which QBs made the optimal decisions by choosing the receiver with the highest expected output.
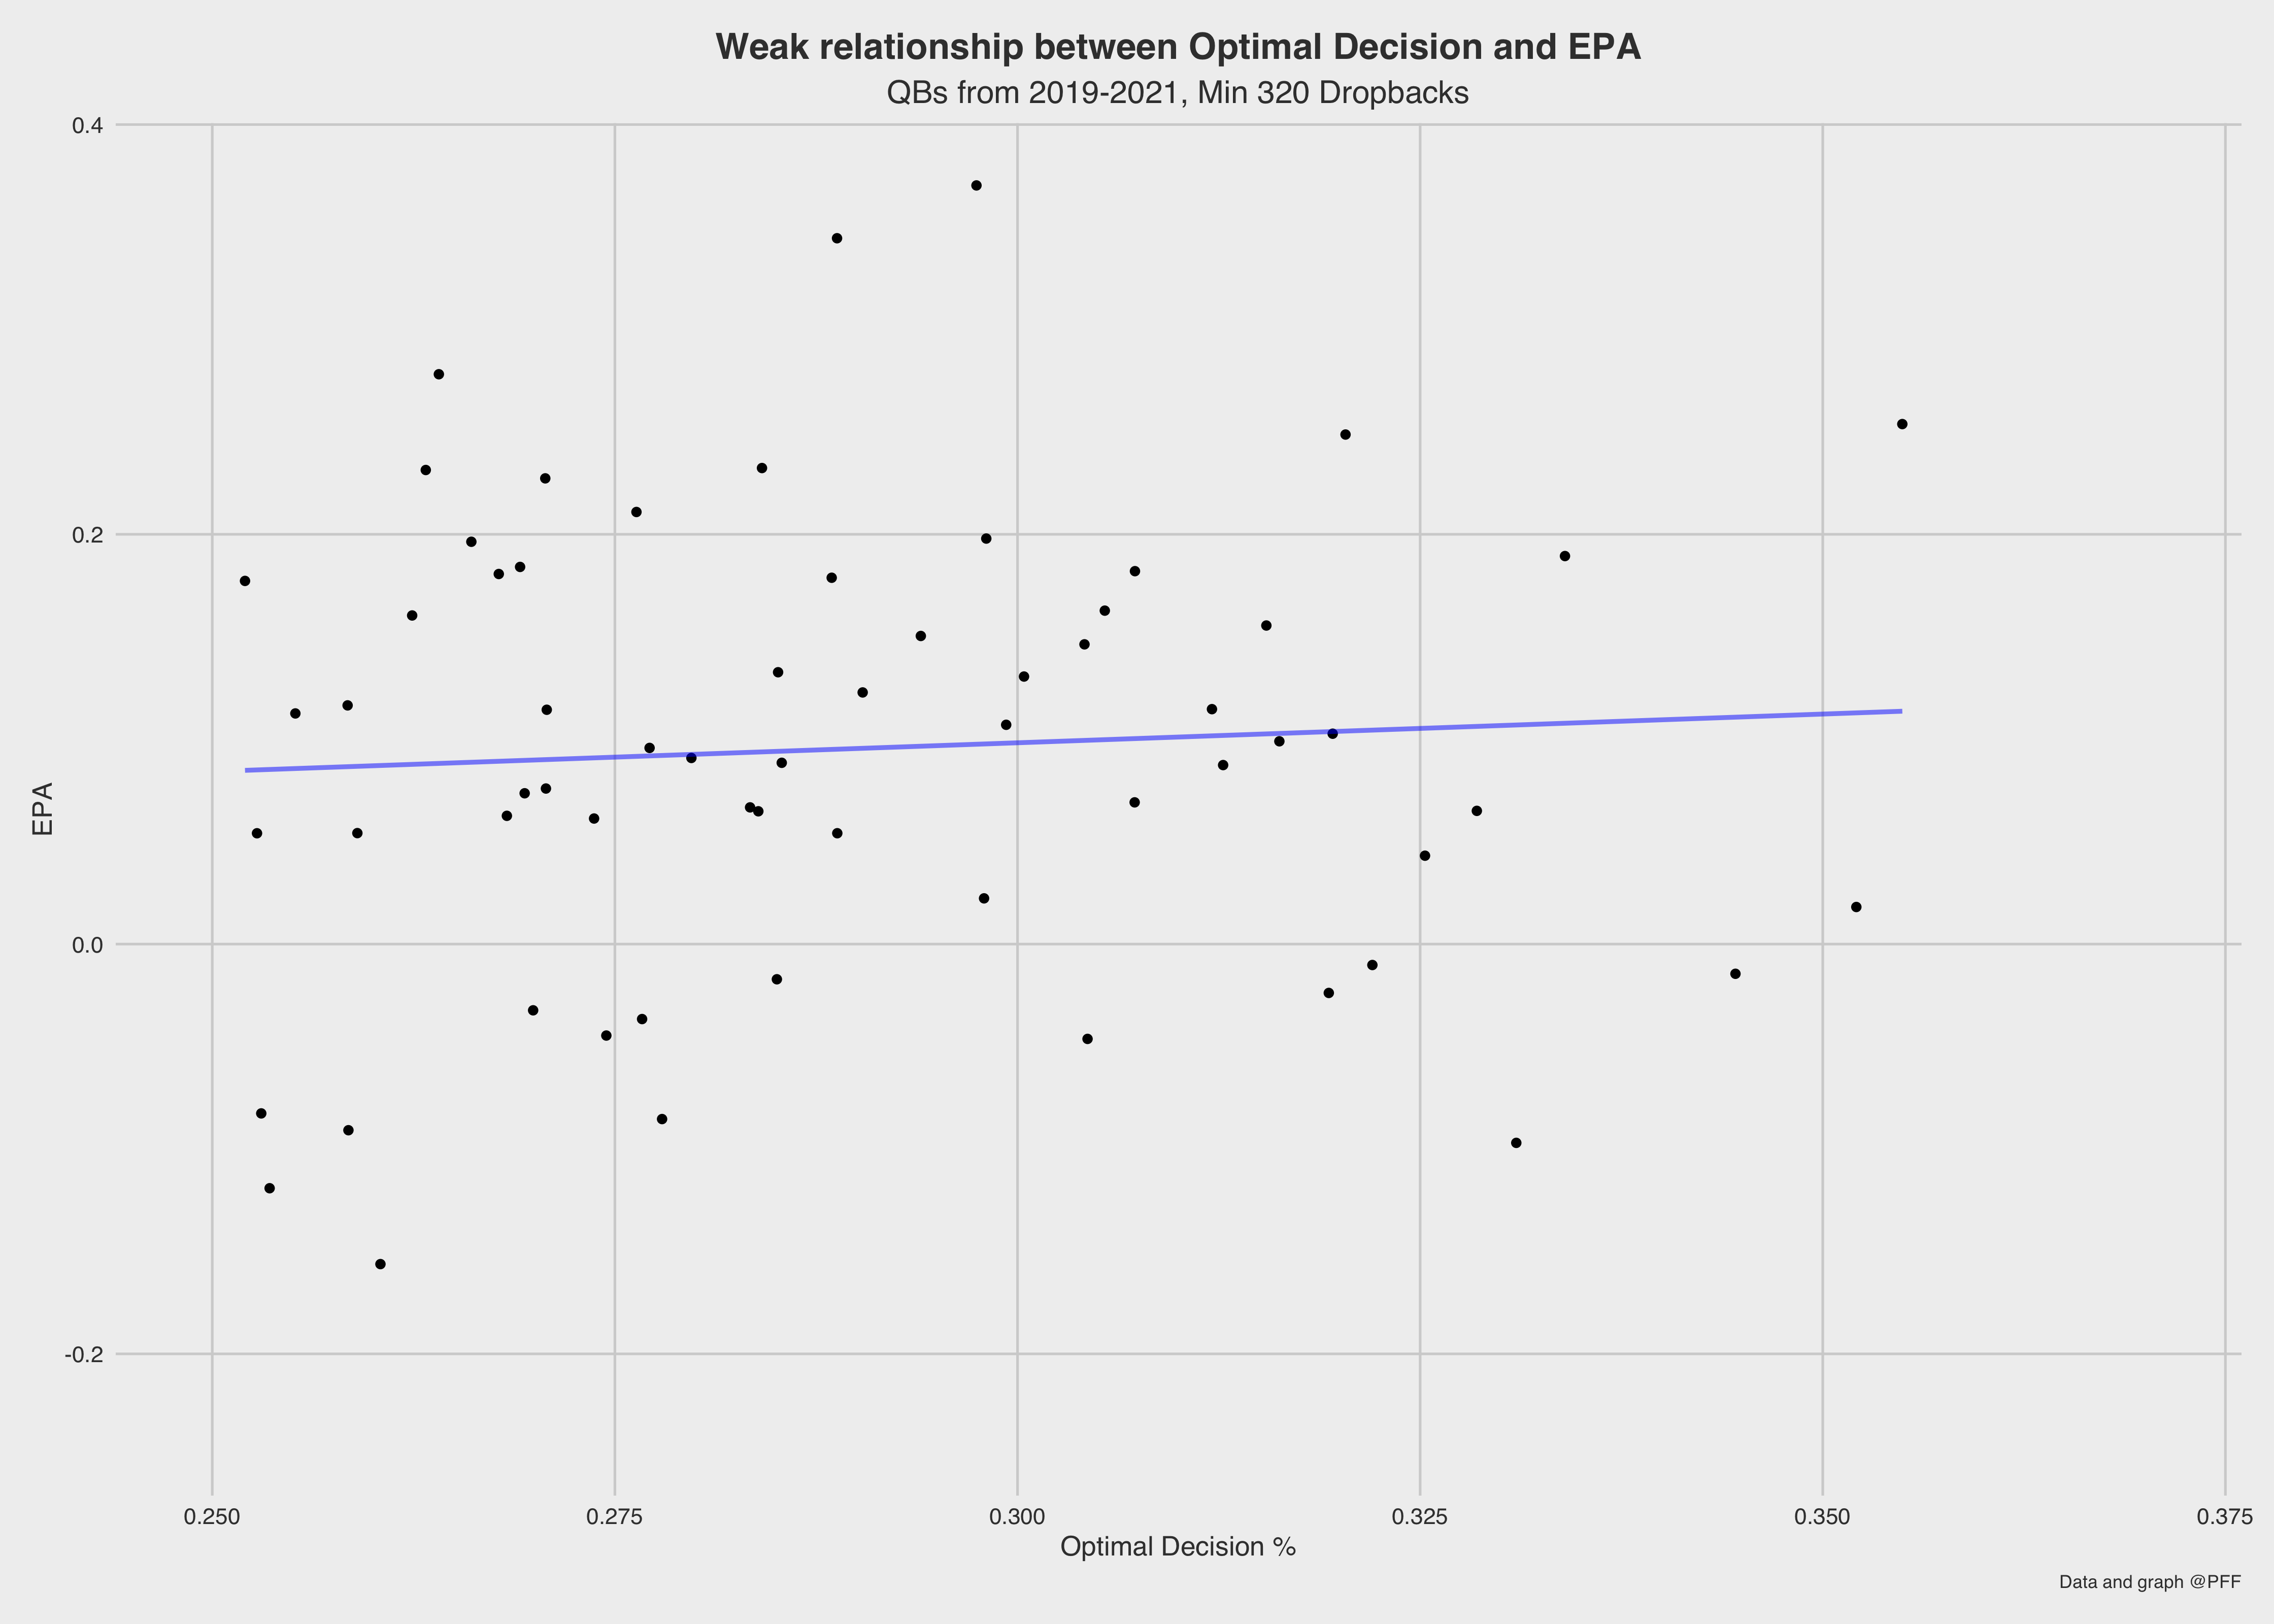
Nonetheless, as it turns out, there is a very weak relationship between the frequency of making the optimal decision and its correlation with EPA. However, after taking a deeper look, this relationship shouldn’t be all too surprising. NFL QBs are a good example of a selection bias, meaning that NFL QBs that made it to the highest level will generally perform well enough when life is made easy for them. Every NFL QB can make the easy throws to a similar skill level. However, the best QBs tend to separate themselves from the pack on the other 70% of throws.
Nevertheless, even though the optimal decision frequency doesn’t have a strong relationship with EPA, the QB decision model still allows us to see how well a QB's decisions position themselves — on average — for the highest expected EPA. By taking a QB's average predicted EPA, we can arrive at a value that quantifies how well a QB creates throws for himself by showing which QB targets the good receiving options on a given play.
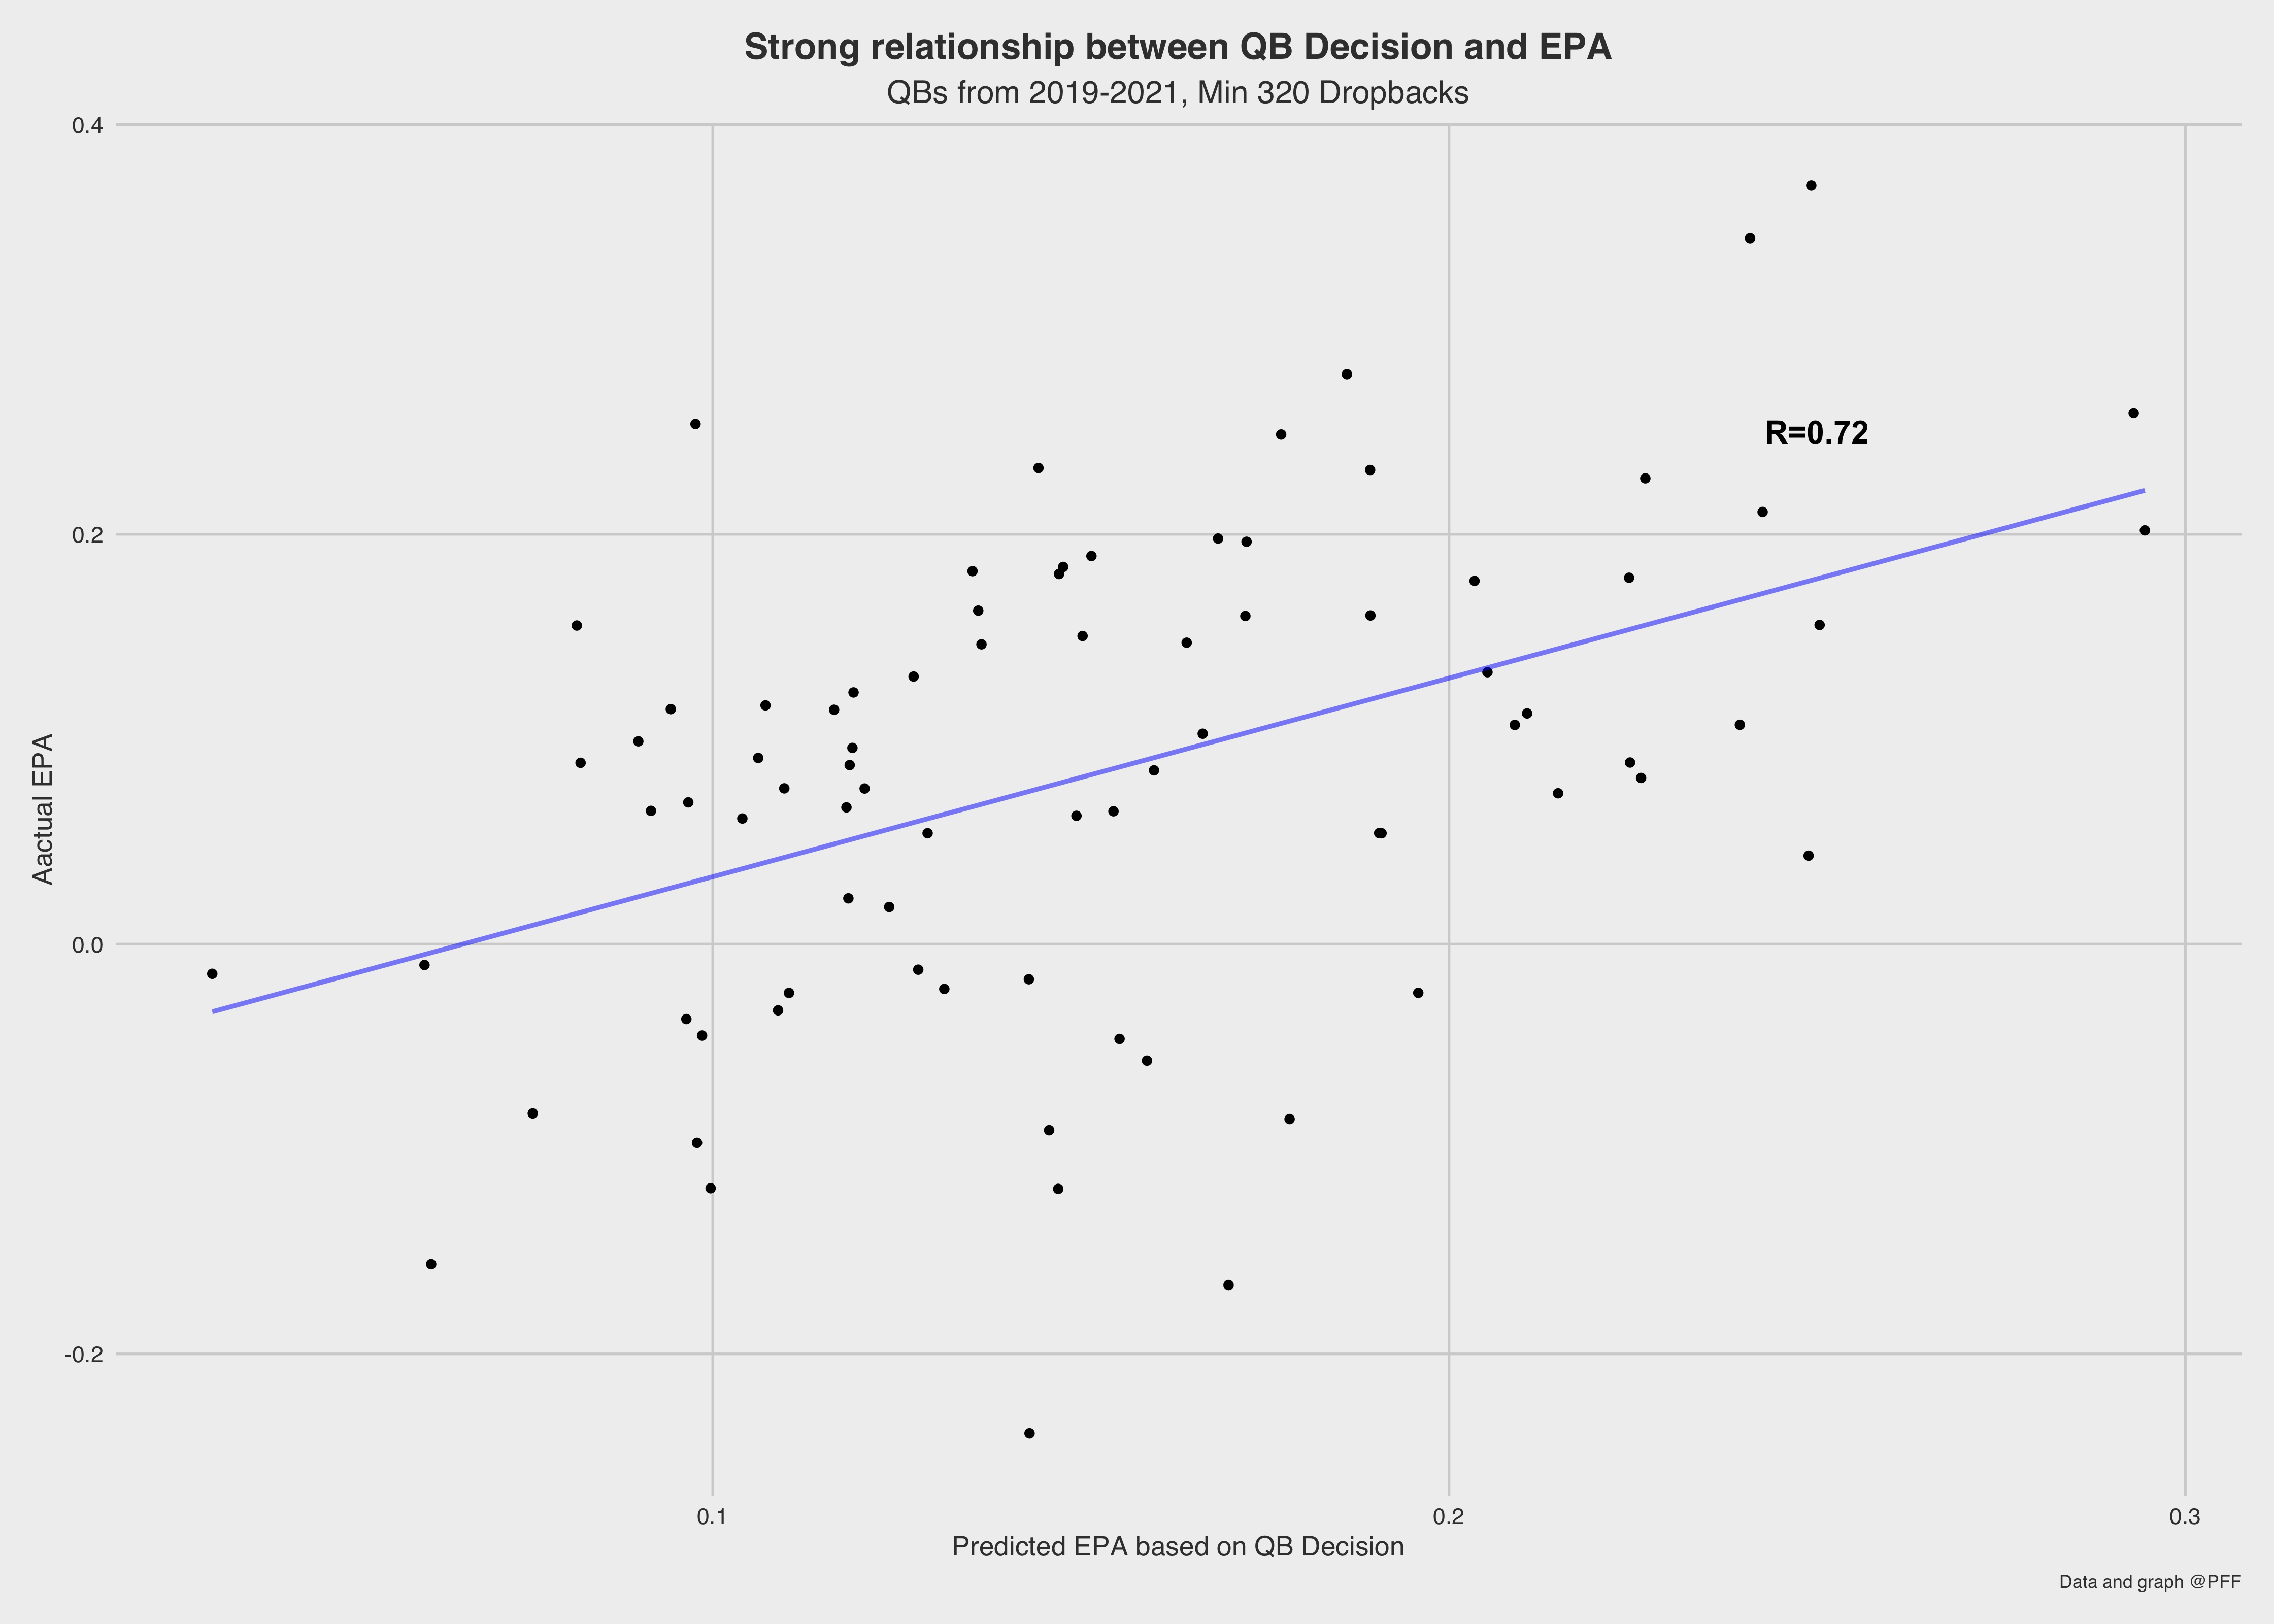
Unlike the frequency of optimal decisions, the average predicted EPA of a QB's decision has a strong relationship with EPA — 0.72 correlational value. Unsurprisingly, a quarterback's EPA is better when he makes better decisions as defined by the model.
So which QBs create the best situation for themselves?
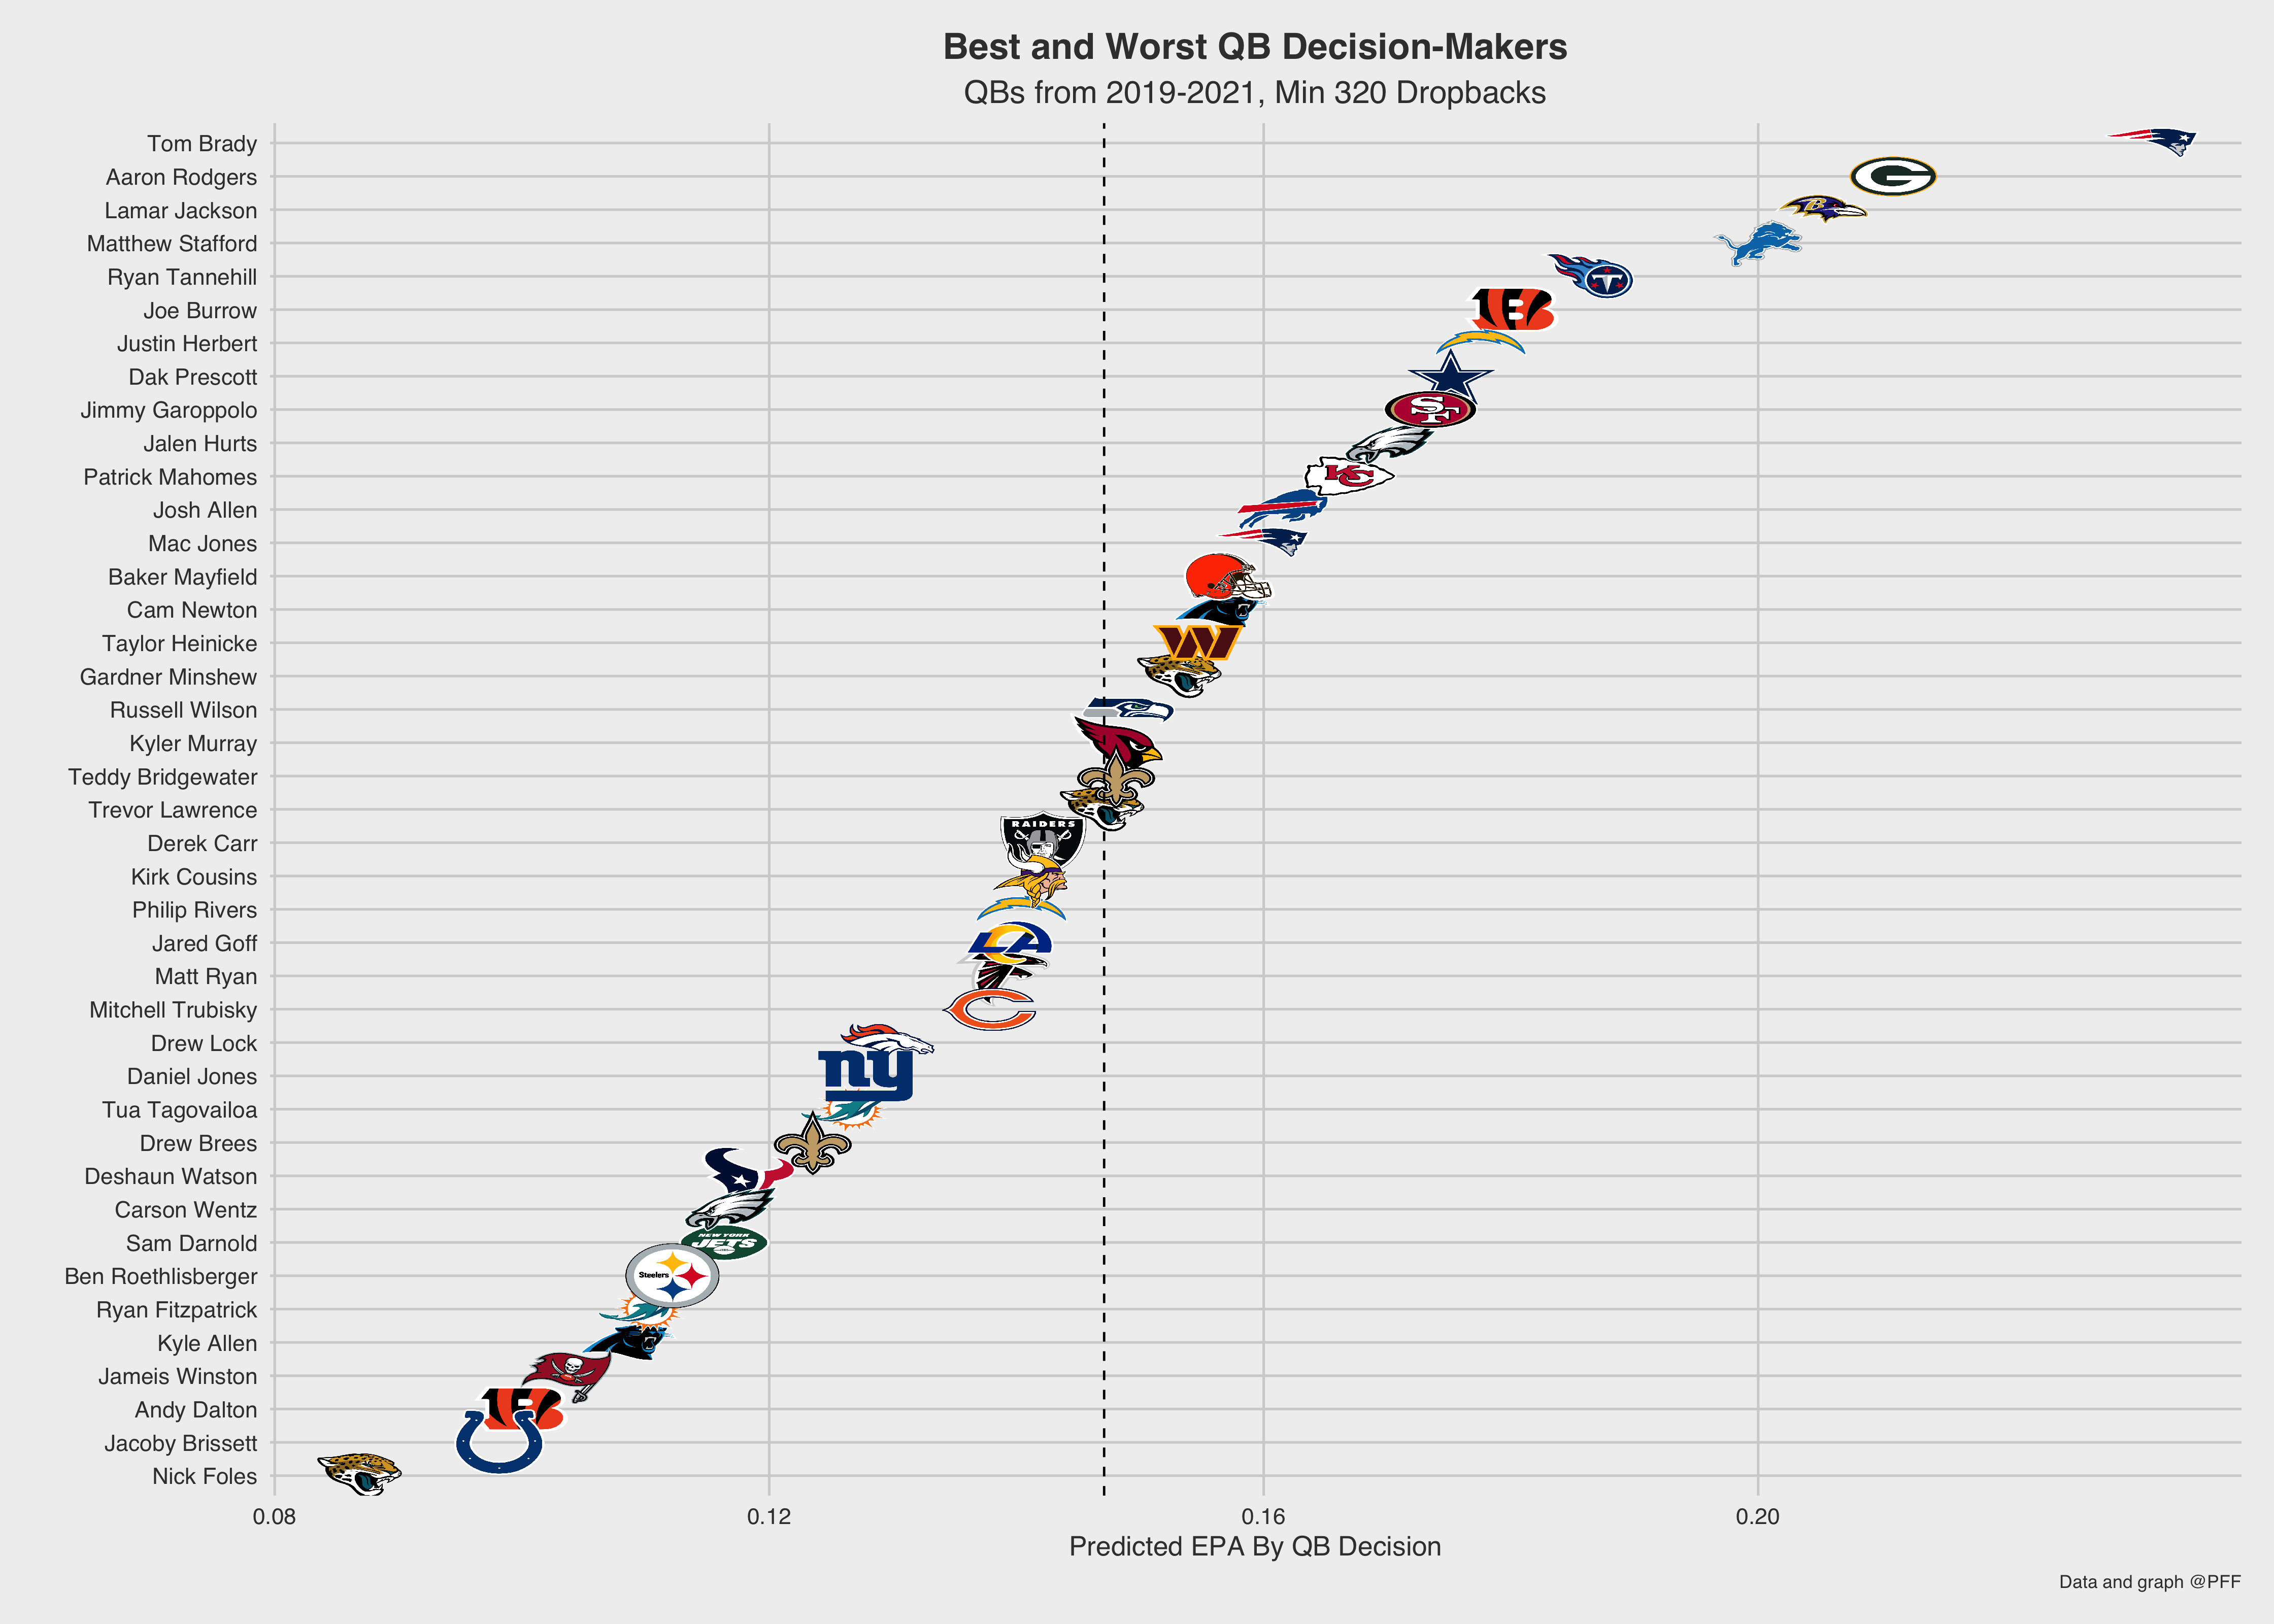
The graph is telling. Elite quarterbacks Tom Brady and Aaron Rodgers lead the way as the best decision-makers from the past three years, and the list generally confirms our prior thoughts on good quarterbacks. While valuable and noteworthy in its own right, this statistic is not a catch-all metric. Rather, this essentially captures a baseline from which QB production can begin. Brady creates better opportunities for himself than Nick Foles does, which is borne out in this data.
With this framework, we can begin to see who outperforms the expectations they’ve created for themselves. It is one skill to make the best decisions in regards to where to pass the ball, but it is a whole other skill to execute those decisions.
Let us see who best outperformed the expectations set for themselves.
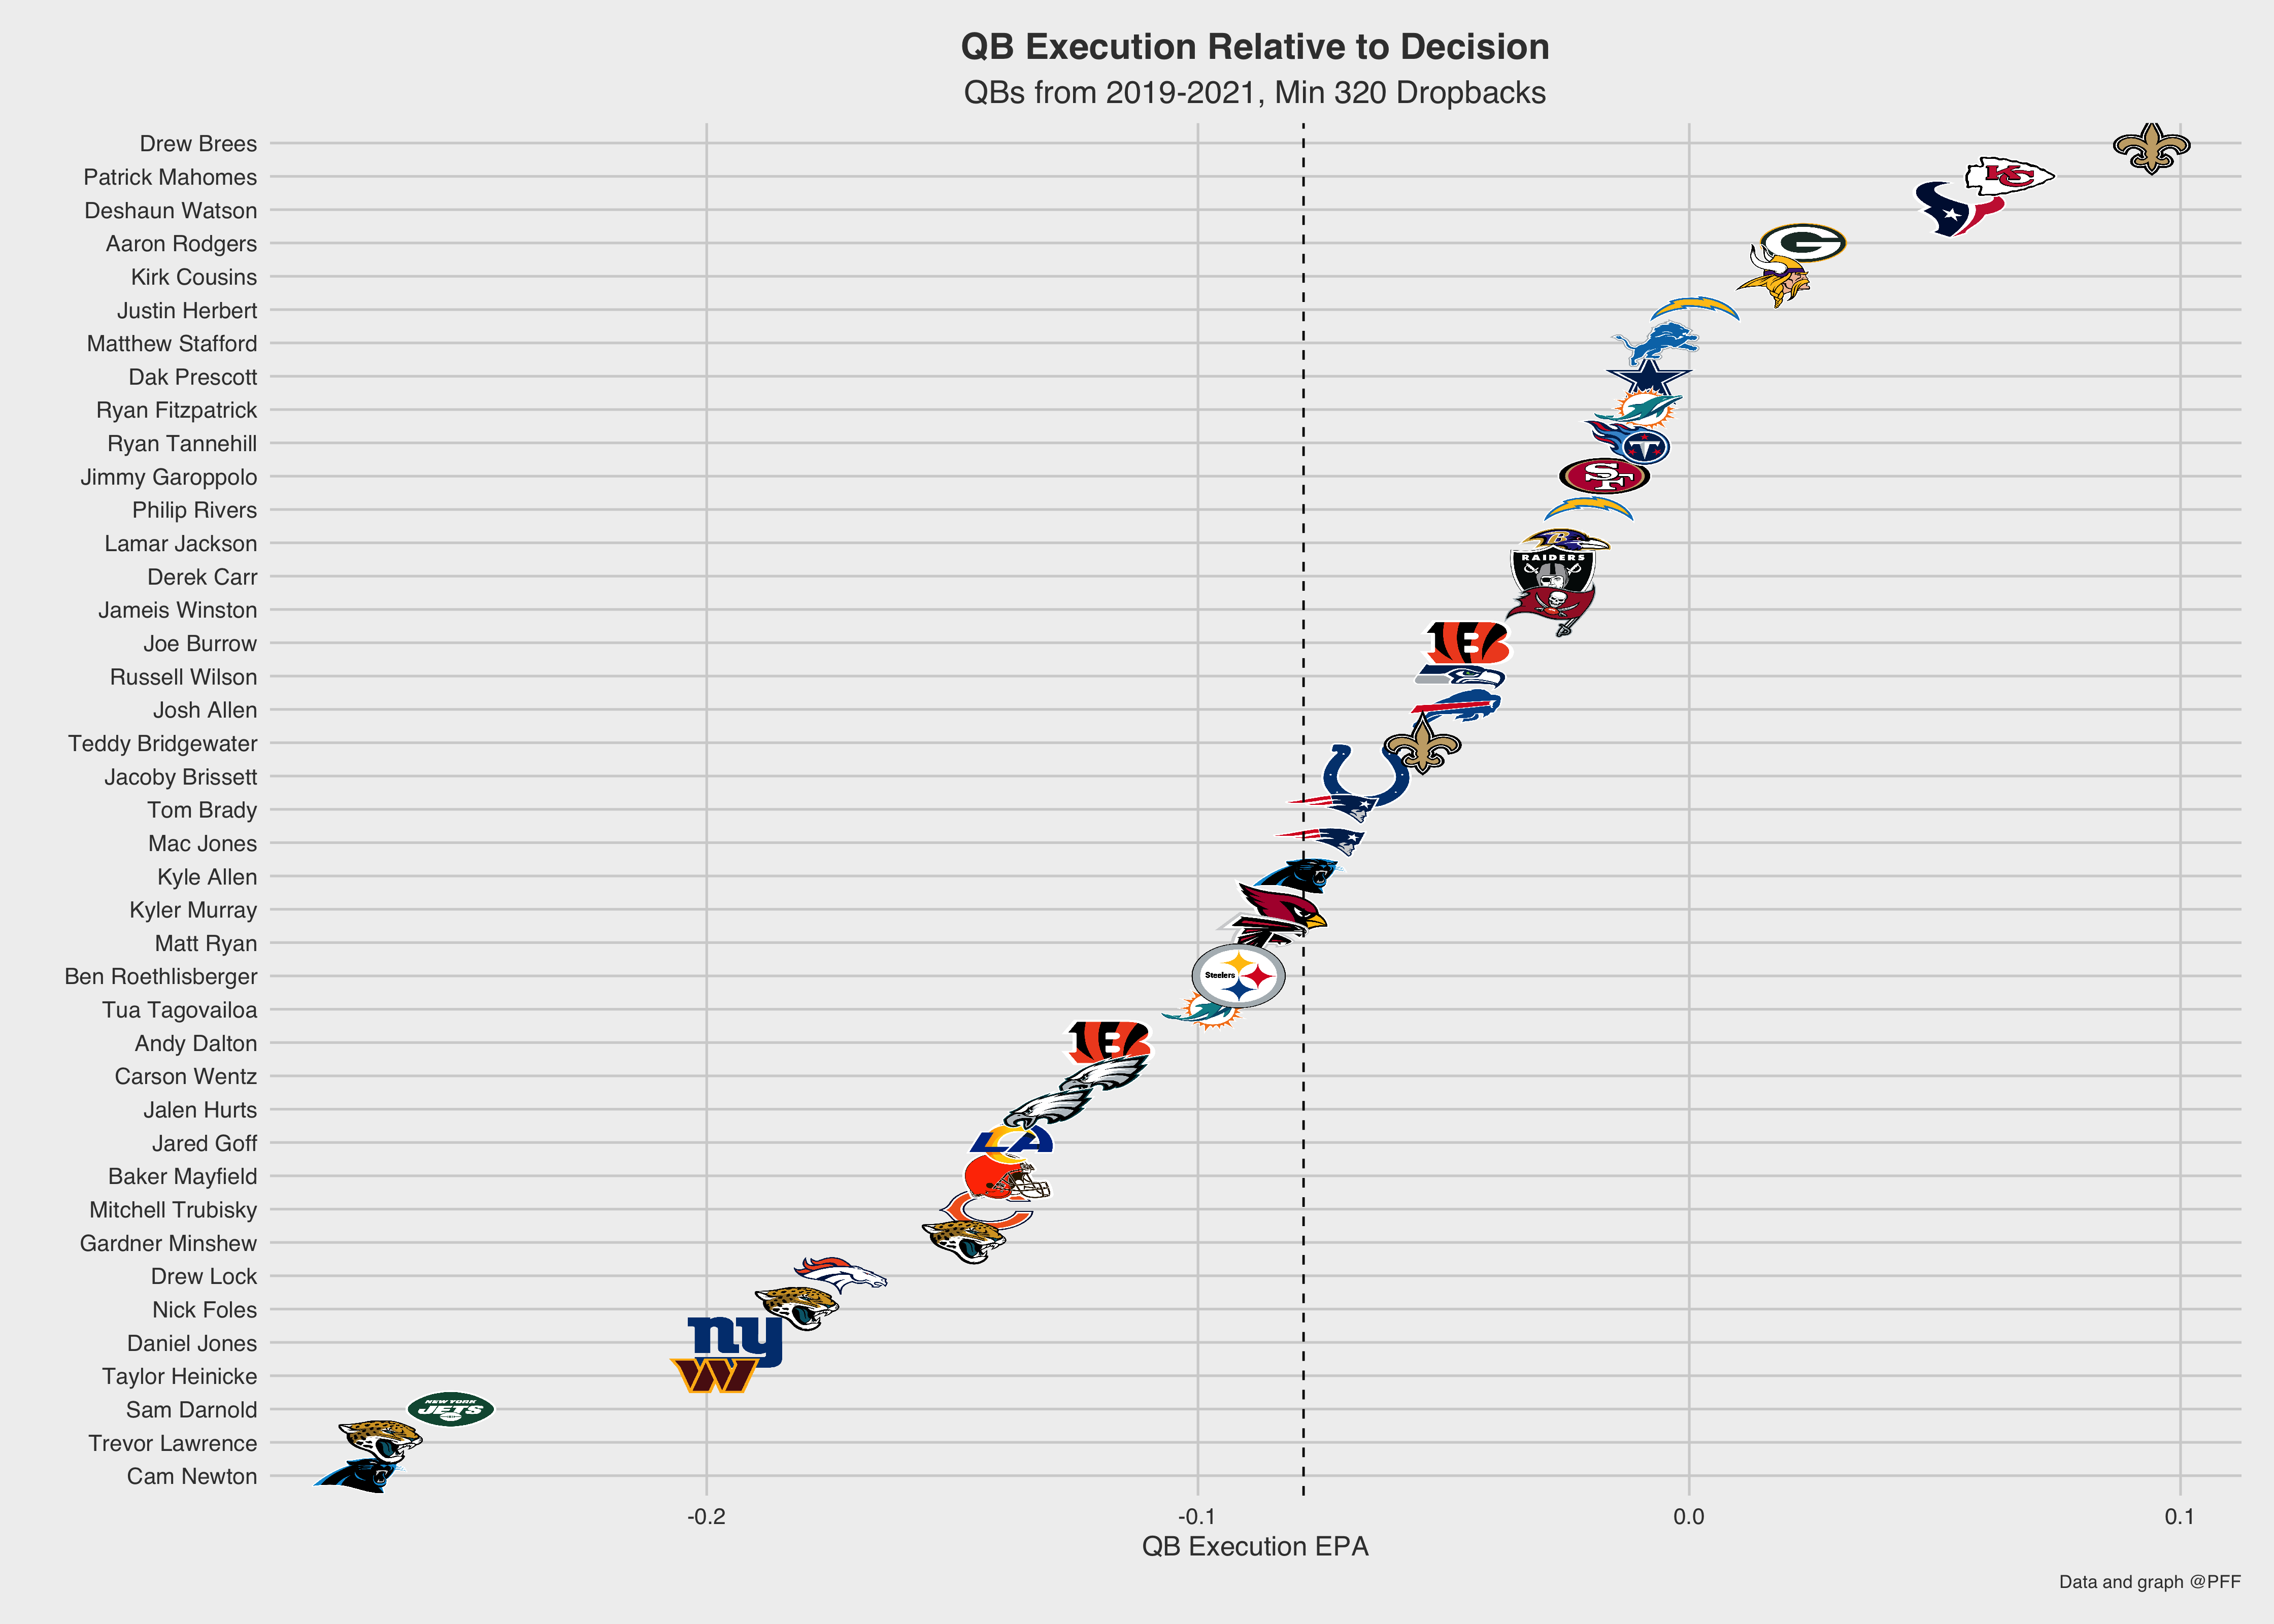
This graph represents a QB’s ability to overcome the expectations they’ve created. Quarterbacks such as Deshaun Watson and Drew Brees — who are not great decision-makers — can still produce at effective clips by overcoming their decision-making and executing above their expectation. The ability to execute is likely the most important QB metric because how well a QB executes — the X-axis of the above graph — better predicts next year's EPA(R value of 0.46) than EPA itself (0.43).
Nonetheless, recall that a QB's decision provides a baseline for his production, so a QB such as Brady will produce an elite EPA even if his execution is average because his decision-making gives him a higher EPA expectation.
With the context for decision and execution fleshed out, we can begin to see the interaction between the two, which provides a fuller picture of QB play.
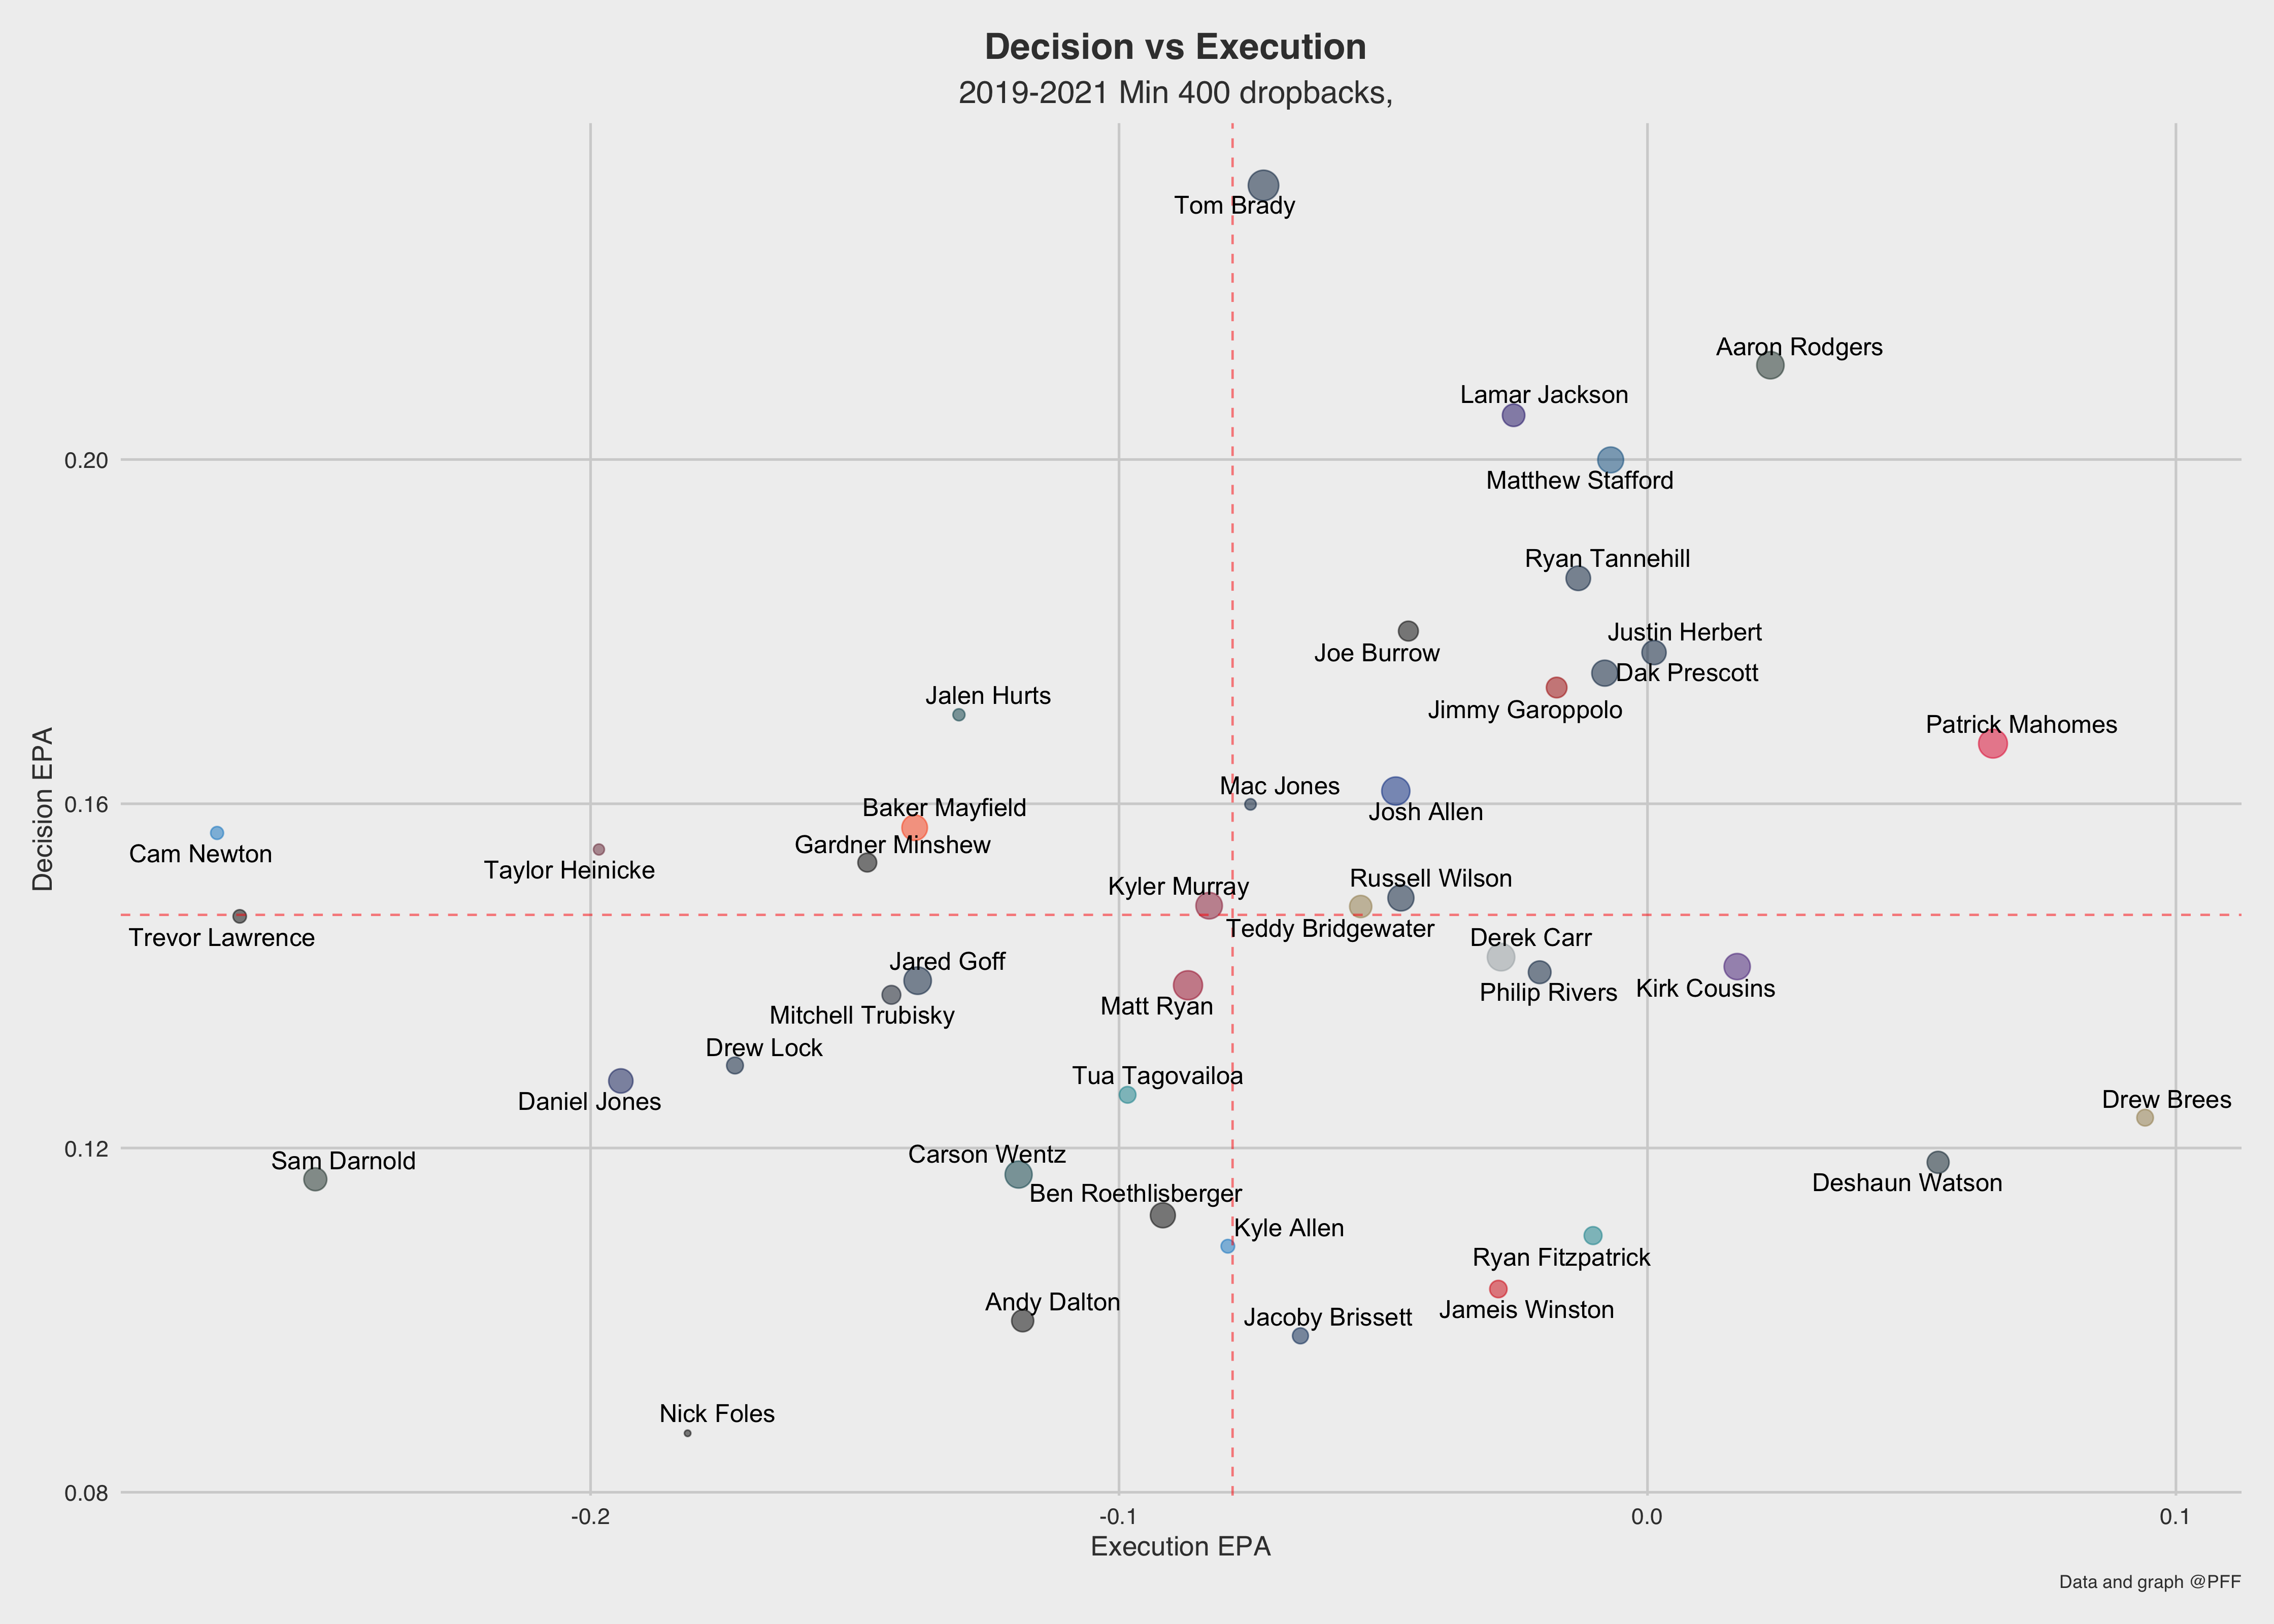
Outliers we’ve discussed such as Brady, Brees and Watson are clearly shown here. Cam Newton, whose decision-making is above average, ends up with a negative EPA because he is the worst at executing in the NFL. Meanwhile, QBs such as Matthew Stafford, Justin Herbert and Dak Prescott produce top-10 EPA marks on account of finishing inside the top 10 in both categories.
However, we have still yet to uncover what drives a QB’s ability to execute. One might assume that the ability to stack up expected points when the defenders screw up or the offense perfectly schemes a play is a path toward the most success, but the data suggests otherwise.
A QB's ability to win when circumstances are stacked against him is what drives a QBs ability to execute the most. There is a much stronger correlation between QB execution and EPA on nonoptimal plays (0.75) than on optimal plays (0.33). This is to say that against talented secondaries — or when no receivers are open — a QB's ability to generate offense and throw receivers open is the most predictive of his total production.
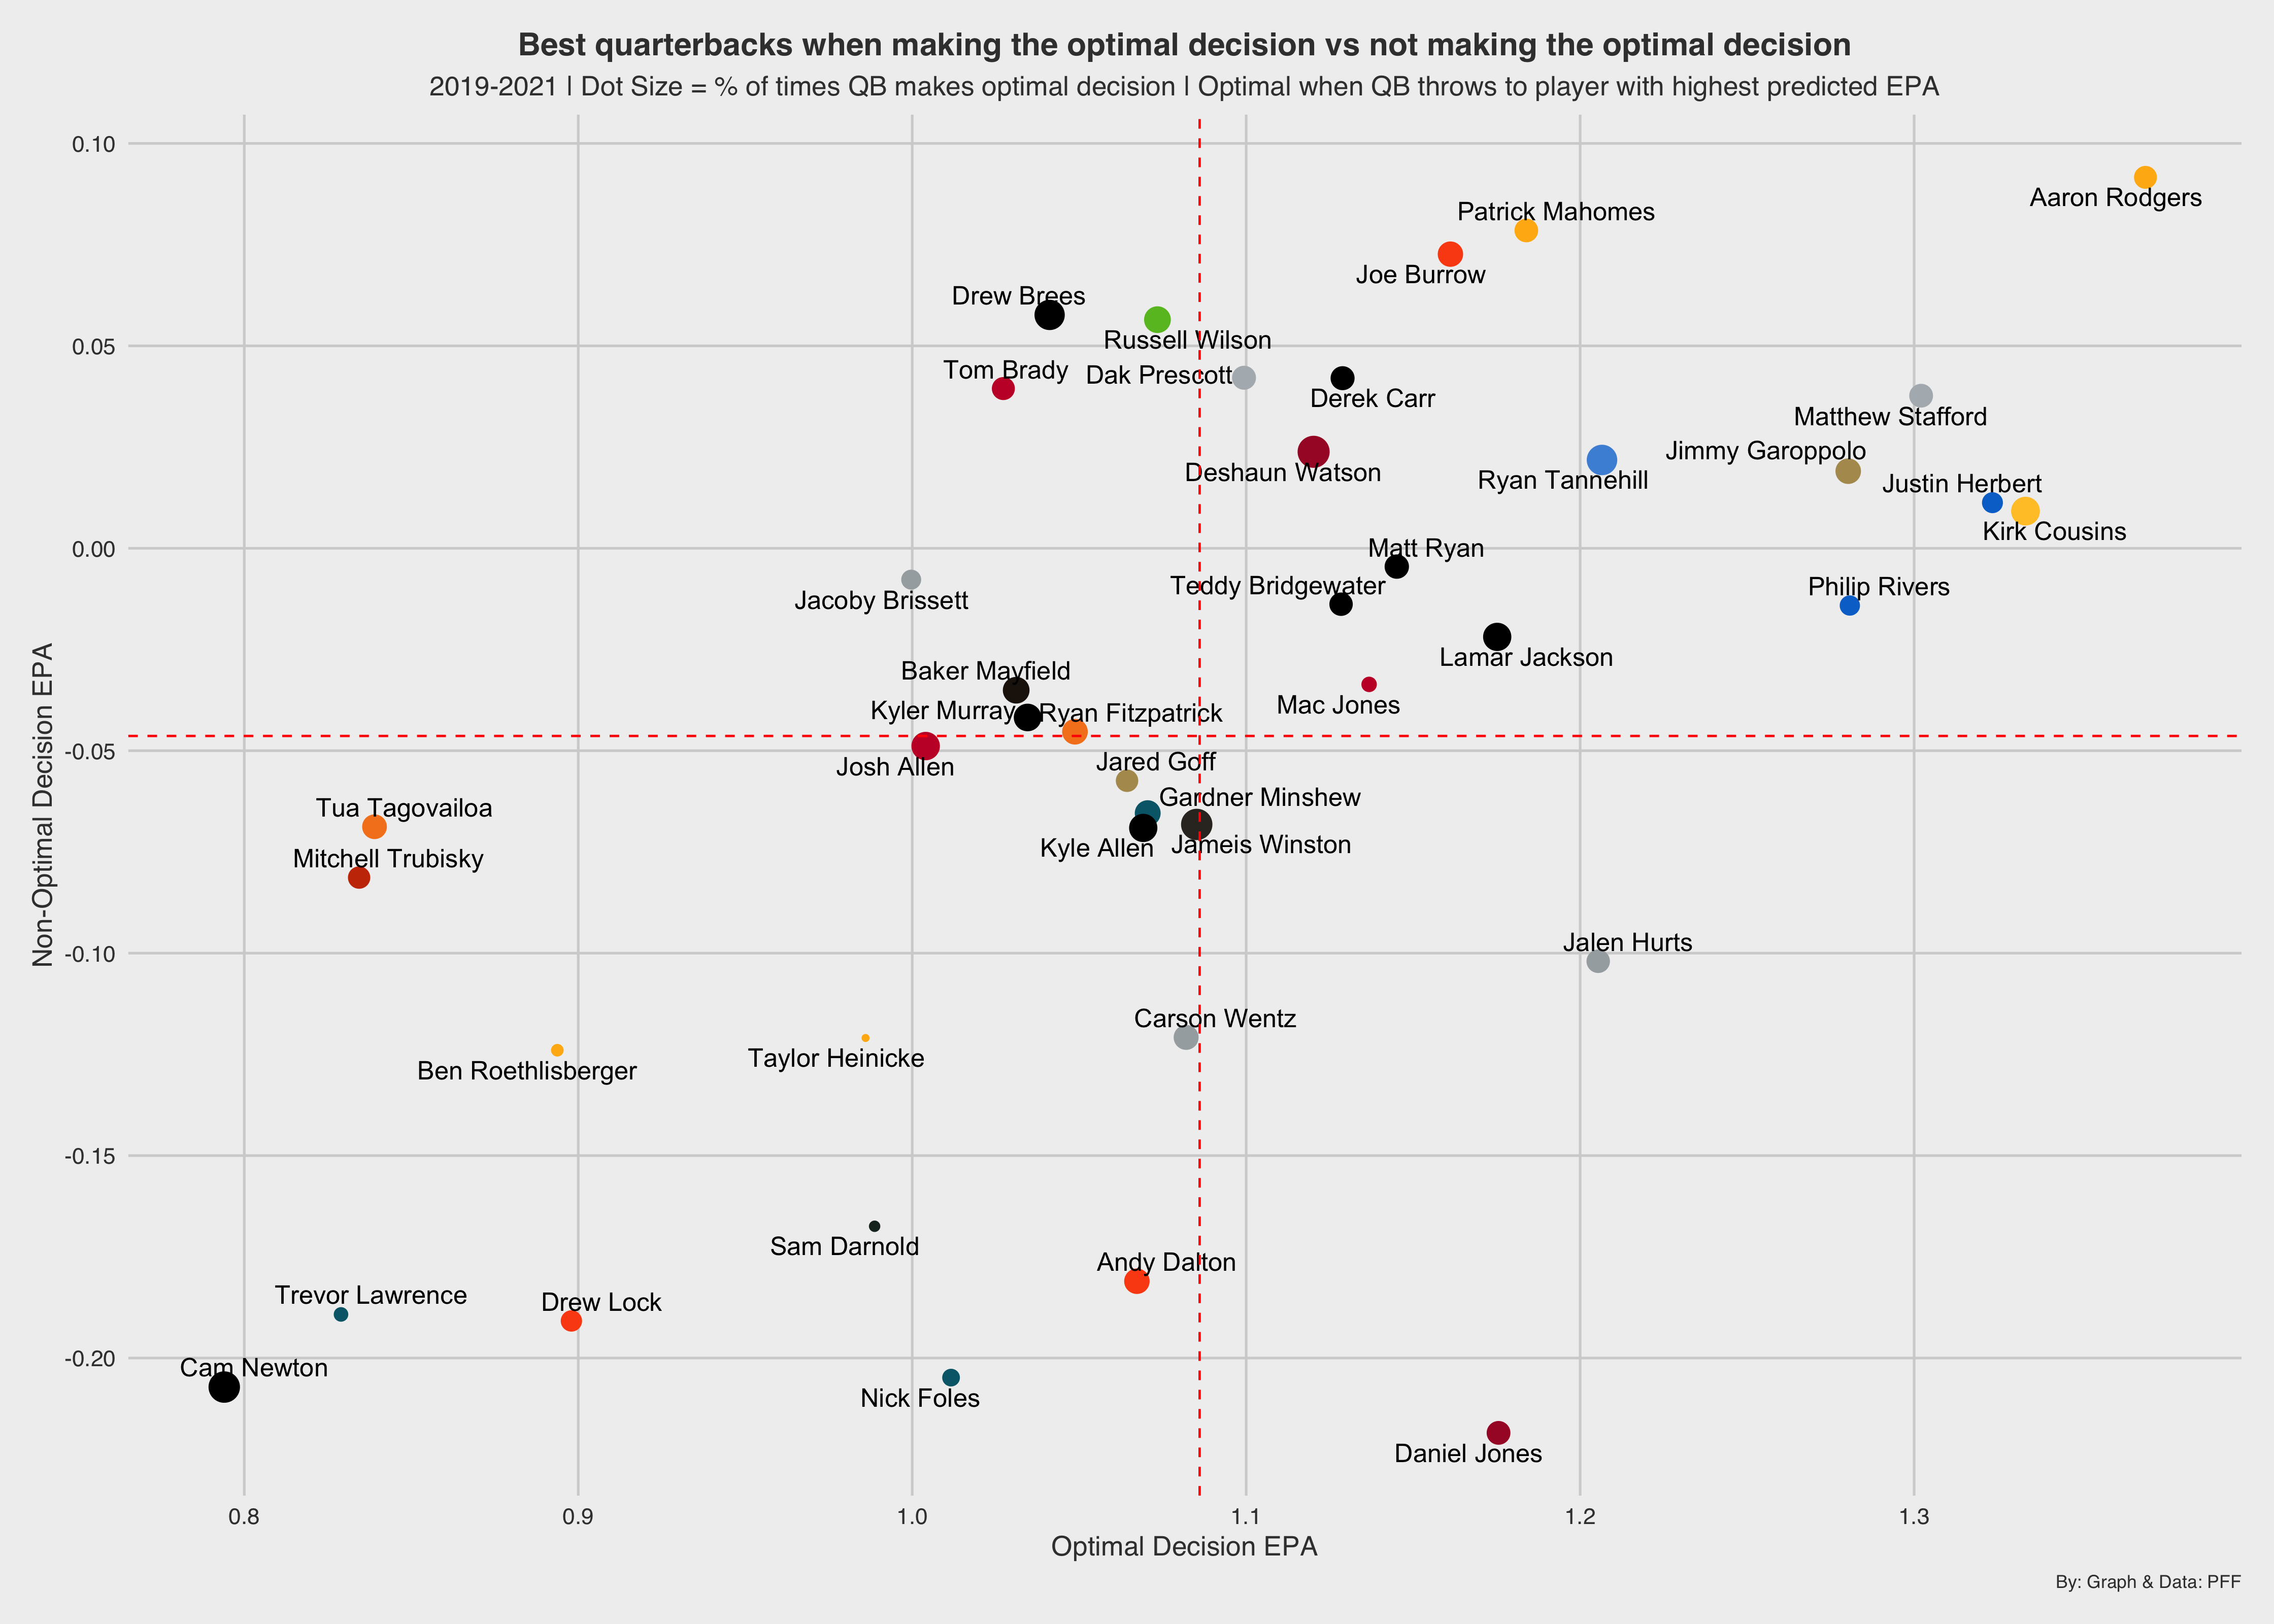
Of course, there is still a benefit to playing well on optimal plays, as it still correlates well with a given season's EPA(0.47), but the distribution on the X-axis is telling — most QBs sit close to the mean while a group of 5-6 outliers strays away from them on both sides. This suggests a similar selection bias phenomenon that we addressed earlier — most QBs are really good when the situation obviously presents itself, but when plays are not optimal or break down, the best QBs separate themselves from the rest.
On the Y-axis, the distribution is far less clumped while the names are revealing. This should not be surprising considering the correlation is far stronger with EPA (0.81) here than on optimal plays. QBs that struggle with EPA on nonoptimal plays are those that cannot overcome their poor situations, but those that succeed on non-optimal plays are the ones that — no matter their circumstances — will likely produce at a high EPA clip.
Bottom line
To understand and evaluate QB play, we first need to start with our opportunity set — or the decisions the QB makes when throwing to the right receiver and setting himself up for success. From this framework, we can better understand and evaluate how well quarterbacks execute, which is more predictive to their future absolute performance (EPA) than the previous year's EPA.
To borrow a basketball analogy, everyone can hit the corner three or, in this case, make the easy passes, but the best basketball players can hit contested shots and mid-range jumpers in the same vein that the best QBs can succeed when life is made most difficult for them.
Further Improvements
We (Arjun Menon and Judah Fortgang) believe this project does a good job of analyzing QB decisions from an analytical standpoint, but we also understand some of the drawbacks.
First off, we were only able to train the data on targeted players going back to 2019. While we do have a large enough sample size to work with (over 50,000 dropbacks), adding more data never hurts and can add better context to certain scenarios that quarterbacks have to go through on a given dropback. It would also be interesting to see if the correlations that we presented for our metric hold up as we apply the model to more dropbacks and quarterbacks throughout the years.
Second, we purely built these various models using PFF's all-coverage data. The next step to improving this model would be to add in tracking data, so that we can use the separation data, to improve expected completion probability and the predicted EPA since there will be less human error involved.
Finally, it comes down to us as analysts. Our goal with this article was to try and see which quarterback has the best process. However, we aren’t working for a team, so we don’t know the play call. With our optimal decision-making metrics, sometimes the most optimal decision is the last progression in the play call. As always, we adjust our models for context, but we understand that it doesn’t capture everything a quarterback goes through on every play.
Despite this, we are happy with the result of this project, and it was encouraging to see how some of the metrics we built correlated with overall quarterback performance.
