It could not have started any better for the Houston Texans who took advantage of a coverage bust, blocked punt for a touchdown, muffed punt inside the five and multiple Kansas City Chiefs drops to take a 24-0 lead in the first half. But then the rest of the game happened. The game-changing plays started to flip the other way, from a Kansas City fumble recovery on a kickoff to a Texans’ failed fake punt in Chiefs territory. While those fluky plays accelerated the Kansas City comeback, the Chiefs’ passing attack was not going to be stopped once they started catching the ball, and their 0.6 EPA average (Texans averaged 0.0) in the passing game told the story of the afternoon. Quarterback Patrick Mahomes went 7-for-11 for 186 yards on throws of 10-plus yards. In addition to attacking down the field, Mahomes showed his usual red-zone magic, creating passing lanes out of nowhere to find TE Travis Kelce for three scores.
![]()
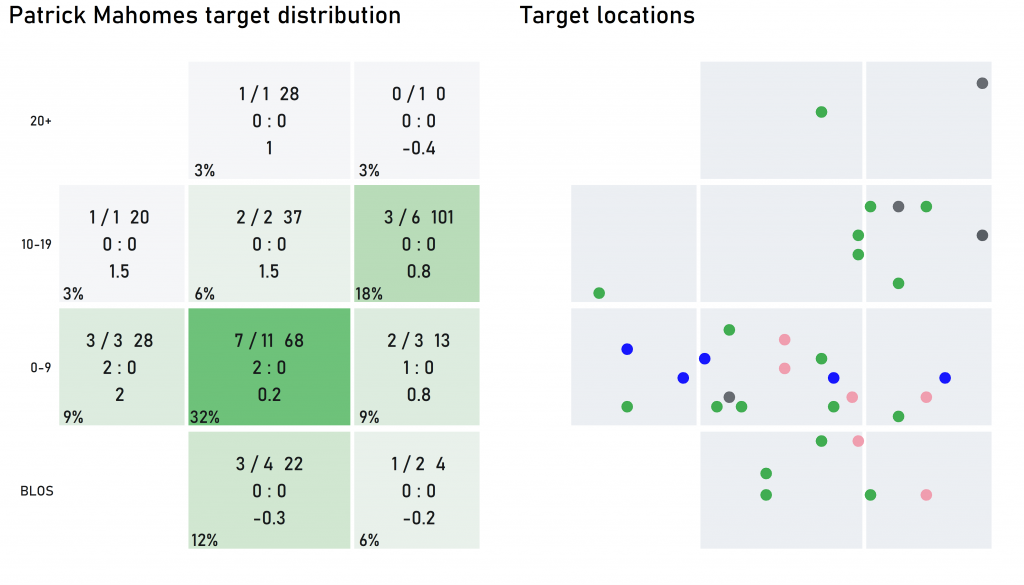
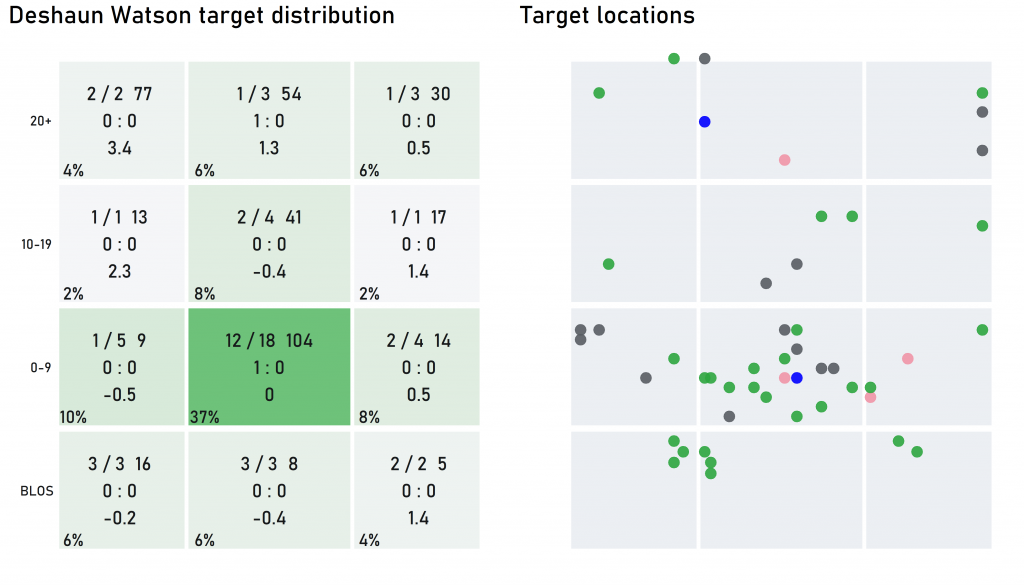
Passing Chart Takeaway
Both quarterbacks suffered multiple drops (Mahomes 6, Watson 4). Mahomes was able to overcome them going 7-for-10 on throws 10-plus yards downfield without suffering a drop on those throws.
The Chiefs’ playmakers against the Texans’ secondary was one of the biggest on-paper mismatches of the weekend, and that’s exactly how it played out after the crazy start. Houston’s big-bodied rookie cornerback Lonnie Johnson was charged with slowing down the Chiefs tight ends in their man-heavy scheme, but he surrendered eight catches on all eight targets, including six for 56 yards and two touchdowns against Kelce. It didn’t help that the Texans only managed to pressure Mahomes on seven of his 39 dropbacks and the Chiefs earned a ridiculous 0.67 EPA/play on the other 32 dropbacks.
| player | team | targets | tgt_share | air_yds_tgt | rec | rec_yds | rec_air_yds |
| DeAndre Hopkins | HST | 13 | 30% | 13.3 | 9 | 118 | 97 |
| Will Fuller V | HST | 7 | 16% | 13.4 | 5 | 89 | 68 |
| Darren Fells | HST | 6 | 14% | 7.2 | 2 | 13 | 7 |
| Duke Johnson Jr. | HST | 6 | 14% | -1.5 | 5 | 23 | -9 |
| Kenny Stills | HST | 6 | 14% | 12.5 | 3 | 80 | 40 |
| Carlos Hyde | HST | 4 | 9% | 3 | 3 | 18 | 4 |
| Jordan Thomas | HST | 1 | 2% | -2 | 1 | 7 | -2 |
| Travis Kelce | KC | 12 | 35% | 6.8 | 10 | 134 | 71 |
| Damien Williams | KC | 5 | 15% | 2.4 | 2 | 21 | 0 |
| Demarcus Robinson | KC | 4 | 12% | 1.8 | 1 | 4 | 1 |
| Mecole Hardman | KC | 4 | 12% | 11.8 | 2 | 19 | 2 |
| Tyreek Hill | KC | 4 | 12% | 9.2 | 3 | 41 | 18 |
| Blake Bell | KC | 2 | 6% | 2 | 2 | 15 | 4 |
| Sammy Watkins | KC | 2 | 6% | 22.5 | 2 | 76 | 45 |
| Deon Yelder | KC | 1 | 3% | 1 | 1 | 11 | 1 |
Target Chart Takeaway
Kelce overcame injury to command 35% of the Chiefs' targets, amassing 134 yards with 63 coming after the catch. For Houston, the return of Will Fuller was noticeable, he was targeted seven times an average of 13.4 yards downfield which led the Texans.
On the other side, quarterback Deshaun Watson had his moments, but he invited too much pressure in the pocket, leading to unnecessary sacks and -1.12 EPA/play on his 20 pressured dropbacks. Watson did well to find his favorite targets, Deandre Hopkins and Will Fuller, as the duo combined to catch 14-of-22 targets for 207 yards, but outside of an early coverage-bust touchdown to Kenny Stills, the Texans got middling production from the rest of the supporting cast. The Chiefs got strong performances from CB Bashaud Breeland (two catches on six targets) and rookie CB Rashad Fenton (eight yards on five targets) as they continue to piece together just enough of a pass defense to complement their championship-level offense.
| tm | down_dist | plays | epa/play | suc_% | pass_% | epa/pass | epa/run | suc_%_pass | suc_%_run |
| HST | 1st | 33 | 0.08 | 52% | 73% | 0 | 0.28 | 46% | 67% |
| KC | 1st | 35 | 0.44 | 60% | 71% | 0.6 | 0.06 | 68% | 40% |
| HST | 2nd_1-3 | 6 | 0.4 | 67% | 50% | 0.33 | 0.46 | 67% | 67% |
| KC | 2nd_1-3 | 1 | 0.58 | 100% | 0% | 0 | 0.58 | 0% | 100% |
| HST | 2nd_4-7 | 6 | -0.06 | 33% | 67% | 0.3 | -0.79 | 50% | 0% |
| KC | 2nd_4-7 | 8 | 0.12 | 38% | 62% | 0.62 | -0.71 | 60% | 0% |
| HST | 2nd_8+ | 15 | 0.49 | 53% | 87% | 0.59 | -0.19 | 54% | 50% |
| KC | 2nd_8+ | 8 | 0.81 | 50% | 88% | 1.08 | -1.08 | 57% | 0% |
| HST | 3/4_1-4 | 10 | -0.61 | 30% | 90% | -0.44 | -2.16 | 33% | 0% |
| HST | 3/4_5+ | 11 | -0.54 | 36% | 100% | -0.54 | 0 | 36% | 0% |
| KC | 3/4_5+ | 9 | 0.02 | 44% | 78% | 0.14 | -0.43 | 43% | 50% |
| HST | all | 81 | 0 | 47% | 79% | 0 | -0.01 | 45% | 53% |
| KC | all | 61 | 0.39 | 54% | 72% | 0.6 | -0.17 | 61% | 35% |
EPA (expected points added): The amount that a play adds (or subtracts if negative) to the number of points the offense is expected to score on the next scoring play. Positive EPA represents a successful play (e.g. suc_%), EPA takes into account down and distance where yards per play does not.
EPA Chart Takeaway
The Chiefs' passing game was unstoppable. They threw on 72% of plays and got closer to scoring on 61% of them while averaging 0.6 EPA per pass play. Kansas City's run game was far worse than the Texans, -0.2 EPA per run vs -0.01 EPA per run, but, alas it did not matter.
With Kansas City hosting the Tennessee Titans next week, it’s a matchup of the No. 2 most efficient passing offense during the regular season (Chiefs) against the No. 2 most efficient passing offense since QB Ryan Tannehill took over in Week 7 (Titans).
