Running backs see the highest ownership percentages of any position in fantasy football, making the position an interesting second stop — after quarterback — when examining daily fantasy sports ownership. Rostering running backs is unique in DFS, as certain injury situations that arise throughout the week vastly change the projected volume market share that a given backfield will experience that weekend. Because of this, cheap running backs with large volume projections often see high levels of ownership in an almost free-square situation at that position.
This holds true with our historical dataset (taken from the DraftKings Milly Maker contest over the past three NFL seasons), as eight of the 10 most-owned players across the past three regular seasons have all been running backs. Not only is it the cheaper value plays that draw large interest, but jamming in as many top-flight running back options as possible leads to high-end ownership for the generational talents we see each week. Nowhere is it more apparent that running backs do truly matter than in the fake version of football played by countless people each week.
Subscribe to PFF's EDGE or ELITE subscriptions get access to the following tools, charts, etc.
– All Premium Article Content
– Fantasy Football Rankings & Projections
– Fantasy Football Draft Guide, Cheat Sheets & Advanced Stats
– Fantasy Football Mock Draft Tool (DraftMaster)
– Fantasy Football Strength of Schedule Matrix
– NFL Player Grades
– NFL Premium Stats
FLEX USAGE
To understand running back ownership, we first need to look at flex usage and how that plays into the ownership percentages. Running backs are by far the most common players to fill a flex spot with — such has been the case in more than 50% of lineups over the past three seasons.
Percentage of rosters that use each position in the Flex
| Season | % RB | % WR | % TE |
| 2017 | 50.2% | 35.2% | 14.6% |
| 2018 | 55.5% | 33.5% | 10.9% |
| 2019 | 50.5% | 35.9% | 13.6% |
| Total | 52.1% | 34.8% | 13.0% |
It's worthwhile to establish trends at a contest level, but it's even more important to take the next step and see if the overall contest data holds true with the rosters that finish at the top of the DFS tournament, as pointed out by Establish The Run's Adam Levitan in his trends article. Gauging how this area is concentrated will help us evaluate not only what was most successful previously, but also the direction that most DFS players will lean going forward. As more people evaluate what has worked in the past, we could see an uptick in flex usage at the running back position.
Percentage of Total Rosters by Flex Position Used and Place Finished
| Position | Top 100 | Top 10 | Top 3 | Top 1 |
| RB | 58.7% | 60.0% | 56.4% | 59.6% |
| TE | 10.7% | 9.0% | 10.9% | 7.7% |
| WR | 30.7% | 31.1% | 32.7% | 32.7% |
As you can see, the idea for a flex running back becomes slightly more apparent when looking at rosters that finished at the top of a certain threshold for the Milly Maker contest.
SALARY ALLOCATED TO THE RUNNING BACK POSITION
One reason why the flex position is filled by a running back at such a high rate is because of the floor-based expectation of fantasy points that we receive based on salary for that position. The top-end running backs are by far the highest-priced plays on a DFS slate, but is their expected fantasy output worth an increase in cost?
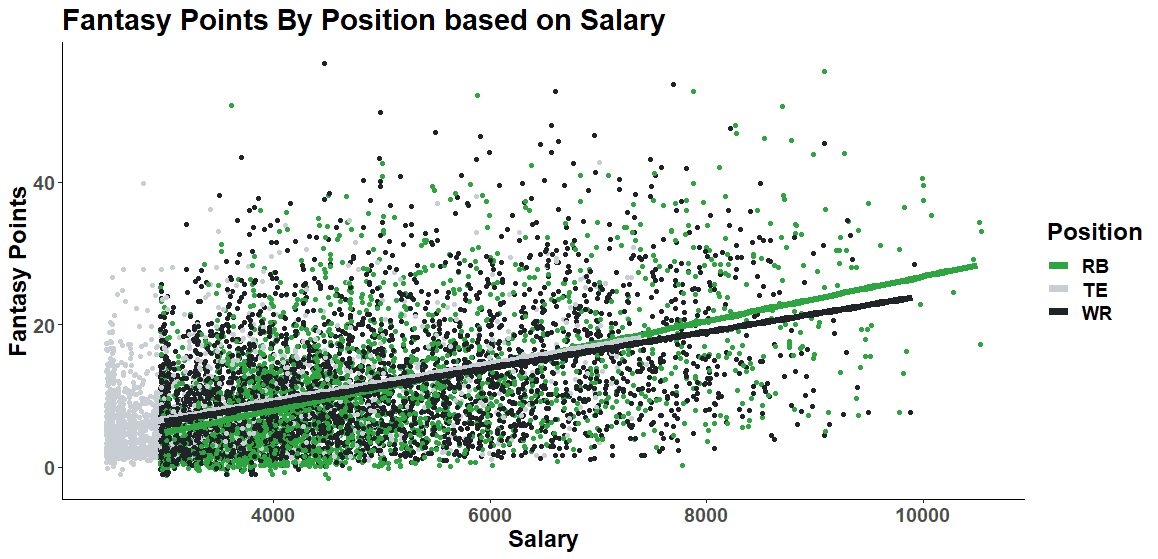
When comparing positions, a running back is expected to score .5 fewer fantasy points than a wide receiver at the same price and almost one full fantasy point fewer than a tight end. We don’t see tight ends approach the top end of the salary range — and we rarely see wide receivers do so — but a case could be made for why paying up at running backs is the correct strategy.
In the graphic below, I have fit a linear regression model to fantasy points based on salary for each position. Up to the $6,000 salary range, both tight ends and wide receivers carry a higher expectation for fantasy points compared to similarly priced running backs. After this threshold, the high-end running back expectation starts to take over. As we get to the high-end salary range, the gap between running backs and the other flex positions only grows.
This leads to an intriguing distribution of salary for those who finish at the top of DFS contests. There is a lot of discussion in DFS about jamming in as many high-priced running backs as possible, but the mean distribution of salary allocated to the running back position for rosters that finished in the top-n doesn’t appear to show that this is a successful long-term strategy. The best approach looks to be targeting the tier just below the top end of the salary range while possibly fitting a player in from the $5,000-$6,000 range, as well.
Average Salary for Running Back Positions That Weren't Used as a Flex
| Season | Top 100 avg. salary | Top 10 avg. salary | Top 3 avg. salary | Top 1 avg. salary |
| 2017 | $6,298 | $6,411 | $6,333 | $6,107 |
| 2018 | $6,665 | $6,795 | $7,196 | $7,000 |
| 2019 | $6,682 | $6,887 | $7,006 | $7,650 |
Average Salary for Running Back Positions That Were Used as a Flex
| Season | Top 100 avg. salary | Top 10 avg. salary | Top 3 avg. salary | Top 1 avg. salary |
| 2017 | $6,344 | $6,271 | $6,375 | $6,490 |
| 2018 | $6,606 | $6,659 | $6,723 | $6,757 |
| 2019 | $6,652 | $6,557 | $6,449 | $6,609 |
Average Ownership for Running Back Positions That Weren't Used as a Flex
| Season | Top 100 avg. ownership | Top 10 avg. ownership | Top 3 avg. ownership | Top 1 avg. ownership |
| 2017 | 16.62% | 15.39% | 13.50% | 11.30% |
| 2018 | 19.99% | 20.98% | 22.73% | 24.73% |
| 2019 | 19.27% | 20.69% | 17.78% | 17.16% |
Average Ownership for Running Back Positions That Were Used as a Flex
| Season | Top 100 avg. ownership | Top 10 avg. ownership | Top 3 avg. ownership | Top 1 avg. ownership |
| 2017 | 16.98% | 16.49% | 17.18% | 18.87% |
| 2018 | 20.65% | 20.10% | 19.72% | 19.67% |
| 2019 | 18.32% | 17.66% | 18.21% | 18.51% |
We are dealing with some small samples as we move to the top of finishes in a DFS contest. It still shows that using a running back in the flex is worthwhile, but finding at least one running back in the mid-to-cheaper tiers has been the best strategy to finish near the top of a large field GPP contest. Ownership at the running back position is not highly leveraged with volatility like at other positions. Simply fading a running back because they are expected to be over-owned is not a recipe for long-term success. As we continue to explore other positions, this will only become more apparent.
HOW OWNERSHIP PLAYS OUT AT THE RUNNING BACK POSITION
We did an exercise with the quarterback position to evaluate specific stats and see whether they drive ownership or fantasy points more. This information can still be used to break ties between two similarly priced and projected running backs, with the market hopefully leaning one way and allowing you to zag the other way.
PFF Rushing Grade:
In alignment with previous studies, we have found that PFF rushing grade isn’t all that stable over time. The previous game's run grade explains ownership in the subsequent week much better than fantasy performance. This changes at the three-game average but still isn’t all that worthwhile when projecting out fantasy points. Still, when focusing solely on rushing-related stats, rushing grade performs the best when evaluating the future performance of running backs from a fantasy perspective.
Rushing Attempts:
In the short term, rushing attempts move both ownership and fantasy points at the same rate. It is less predictive over time, but it seems that DFS players have a shorter attention span — once you reach the five- or 10-game average, it is more worthwhile when projecting fantasy points rather than ownership for the first time. However, at that time frame, it is not that effective in projecting either category.
Rushing Yards:
Rushing yards and rushing attempts move in lockstep for both categories, but the former is noticeably more predictive of ownership than actual fantasy points in the subsequent weeks. Taking a longer time frame approach makes this stat more worthwhile when projecting fantasy points rather than ownership.
Tackles Avoided:
Tackles avoided aren't all that stable and are not that worthwhile when projecting ownership or fantasy points. The stat is closely linked in its ability to project both, but it doesn’t separate from other rushing stats that are more worthwhile due to their volume-based nature. These stats are also much more stable, making them more worthwhile when evaluating running backs.
Yards After Contact:
Outside of PFF rushing grade, yards after contact performs the best from the rushing category when projecting fantasy points. The issue is that it does even better at explaining ownership, especially over the shorter time frames. Moving out to a longer time frame increases the validity of using yards after contact.
PFF Receiving Grade:
PFF receiving grade at the running back positions is one of the most underutilized stats when evaluating fantasy performance. Receiving grade outperforms all tested rushing metrics when predicting fantasy points, especially in a PPR scoring format. An it also is better at projecting fantasy points than ownership over every time frame, which makes it a worthwhile stat when evaluating running backs to use in your DFS contests.
Passing Targets:
Passing targets for running backs is another viable stat that appears to be often overlooked by DFS players. It is also much better at projecting fantasy points than ownership in all timeframes.
Yards After the Catch:
Although not as worthwhile as other pass-catching metrics, yards after the catch is still more worthwhile than all rushing categories. Passing targets for running backs is relatively sticky, which means any sort of volume associated with the running back offers a nice floor for fantasy purposes. Ideally, the running backs utilized in your DFS lineups are able to contribute as pass-catchers in some capacity.
CONCLUSION
The running back position is typically the easiest to project from a fantasy perspective. Because of that, we shouldn’t be scared off by high ownership levels — especially on value plays that pop up throughout the week due to injuries. Some of the highest-priced running backs are targeted in DFS contests consistently, which allows the next tier of running backs to often be overlooked.
This is a great area to target for running back options that should also be utilized in your flex position. Pass-catching metrics are not utilized as much as they should be when DFS players evaluate their running back options. Stats such as targets, receiving grade and yards after the catch are worthwhile additions to track, as they help break ties between players at the running back position. These are stats that are more useful when projecting fantasy points than ownership percentages.
We will continue to look at each position group from the perspective of projecting ownership and fantasy points. And at the end, we will look at ownership from a lineup-wide perspective to try and glean information on what is successful when trying to hone optimal lineup construction.
