When the curtain rises on Las Vegas' very first NFL Draft, all 32 NFL teams — especially those that pick very early in the draft — will be hoping to significantly improve their rosters by selecting the very best talent available at their respective positions.
We've seen that we often tend to overestimate the ability to pick the best players in the draft, and as a consequence, the draft success curve is relatively flat and comes with much uncertainty. In this article, we want to investigate how well teams have fared assessing future NFL careers at different positions playing different facets.
Facets include passing, receiving, rushing, run blocking and pass blocking for offensive players, and coverage, run defense and pass-rushing for defensive players. As a target measure, we use the career PFF grade of each player.
Since we want to include every player who ever took a snap in the NFL (since 2006) into the analysis, it's crucial to account for sample sizes, which is why we use the Bayesian posterior mean of the PFF grade of a player as the final target metric to describe his career success. Today we consider offensive players, and we will continue with the defensive side of the ball tomorrow.
Quarterbacks
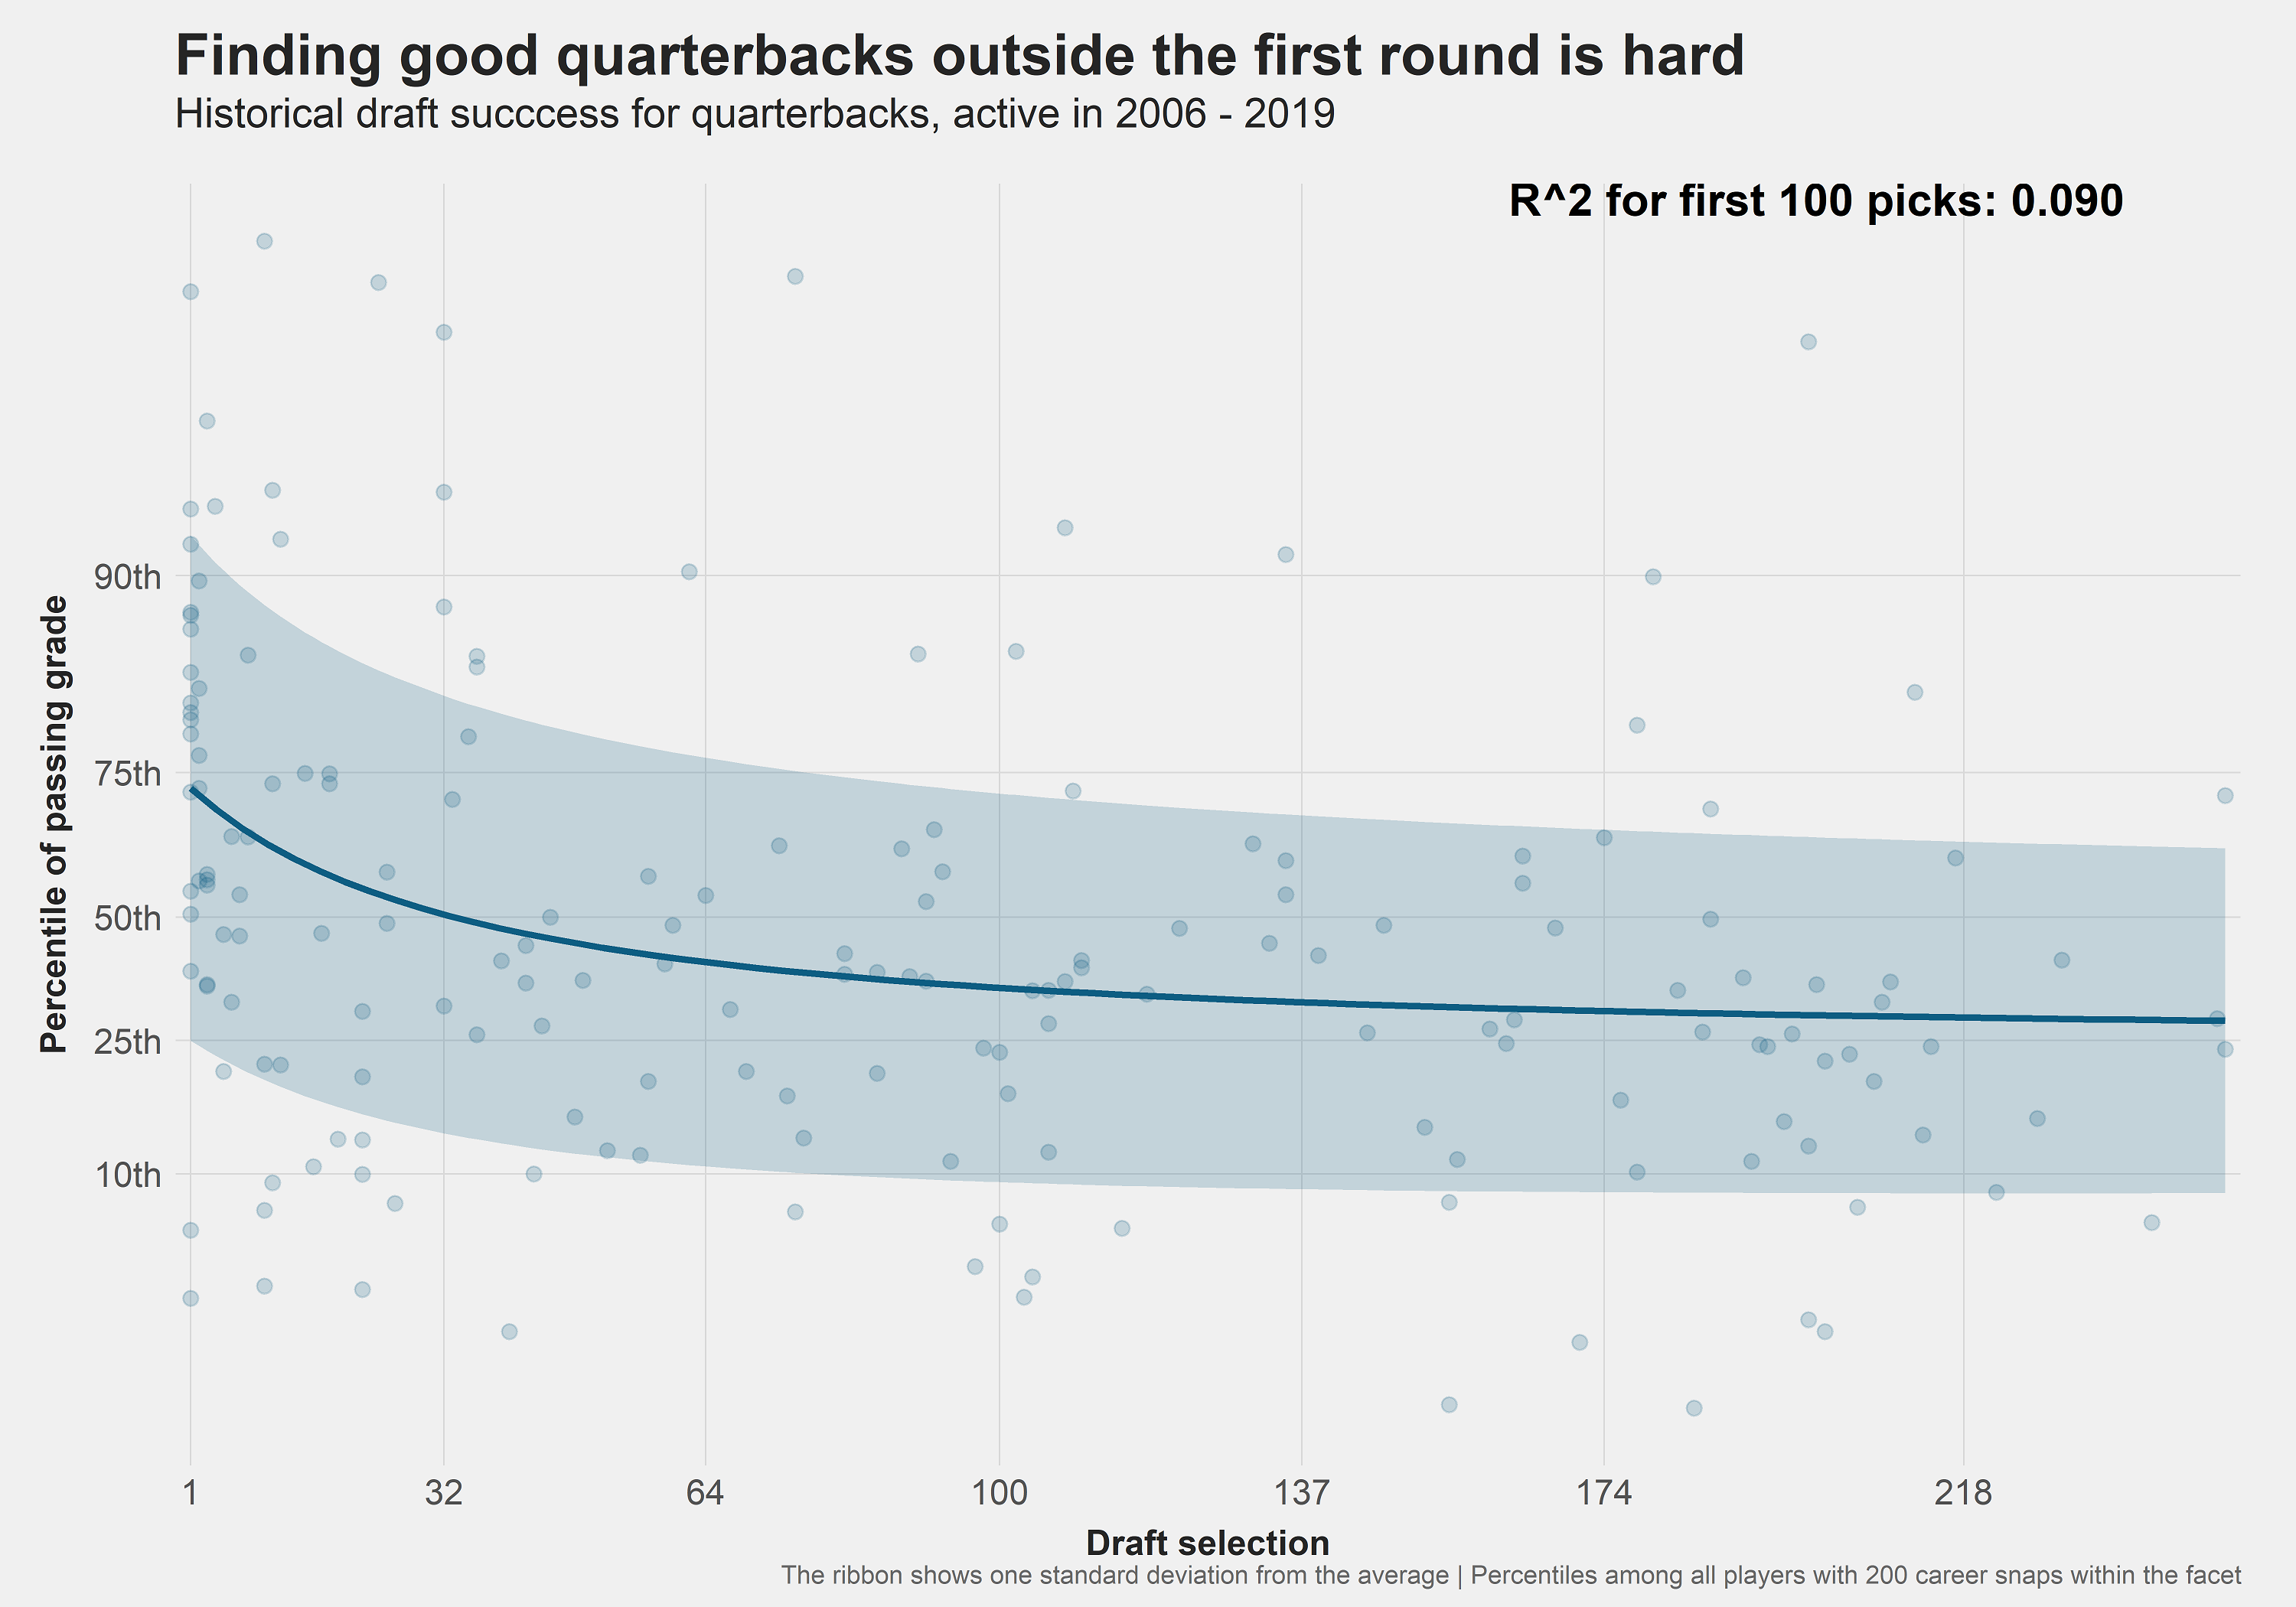
The first position we want to look at is quarterback, and we'll use it for a quick explainer of how to read the chart. On the x-axis, we find where a player was drafted, with the breaks being the end of the respective rounds in the 2018 NFL draft (note that compensatory picks distort the 32-picks-per-round pattern).
On the y-axis, we find the percentile of the grade in the respective facet (naturally, this is passing for quarterbacks) among all players at the same position who played at least 200 career snaps. Each point shows one player, and all players at the position with at least five NFL snaps in the given facet are shown.
The curve represents the best fit (using a parametric fit, more concretely a linear combination of shifted logarithmic functions) of the points and describes the expectation at the given draft position based on past data. The shaded ribbon indicates one standard deviation above and below the mean, giving us a measure of uncertainty. As a rule of thumb, the odds of ending up with a player who is either better than one standard deviation above average and/or worse than one standard deviation below average is 6:1 for both tail events.
Specifically for quarterbacks, if a team wants 6:1 odds of getting a passer in the 90th percentile — something every organization should aim for — there is no choice but to select one within the first few picks of the draft, as teams have been efficient enough to only very rarely let talents with this kind of upside slide into even the back half of the first round. Notable (and visible on the graph) exceptions are Aaron Rodgers (Pick 24), Drew Brees (32), Russell Wilson (75) and Tom Brady (199).
A common pattern will be that the curve often flattens out from Day 3 on (roughly pick 100). This illustrates how much of a crapshoot later draft picks are, but we should also note that there is some selection bias cooked in that is ultimately hard to account for. A lot of later picks don't get the “opportunity” to show how bad they are (relative to average NFL players), and thus the true curve likely falls a bit steeper in the later rounds.
For this reason, the main focus and the most interesting part of the analysis is what happens for the first three rounds and whether or not there is some exception going on with the later picks for specific positions and facets. For each position and facet, we will give some key numbers that describe how teams evaluated the position: The expectation of a top-three pick and the expectation at the start of the second (Pick 33), third (65) and fourth round (varies from year to year, we go with pick 101 here). For the same picks, we also compute the chance of landing a “stud” (loosely defined as a player in the 90th percentile) or a player with starter material (65th percentile).
Draft success for quarterbacks
| Pick | Top 3 | 2nd Round | 3rd Round | 4th Round |
| Percentile | 70 | 50 | 42 | 35 |
| Chance at stud (90th percentile) | 20.7% | 6.6% | 3.2% | 1.8% |
| Chance at starter (65th percentile) | 56.4% | 36.3% | 27.4% | 22.2% |
We should note that the 50th percentile doesn't indicate an average starter, or even a role player, but an average player who got drafted into the NFL. These kinds of players are very rarely starting material. Notable quarterbacks hovering around the 50th percentile in career passing performance are Josh Allen, Jacoby Brissett, Tim Tebow and Brett Hundley. For most positions, the threshold that yields the kind of players who are solid enough (yet still not good or great) to gain significant snaps without being an injury replacement is the 60th to 65th percentile.
After explaining the method in a detailed way, we'll go through other positions more quickly.
