Comparing current prospects to those of years past is standard procedure in draft evaluation, though most comparisons are built on the memory recall and subjective opinion of the particular evaluator. In this article, we’ll compare the 2020 running back class to prior years and pick out the most similar comps for top prospects by a clearly delineated and quantifiable method. I dove into the statistical comps for top running back and wide receiver prospects going into the draft, and now I'll expand the group for running backs who were drafted through the fourth round and not included in the first series of articles.
[Editor’s Note: PFF's instant analysis on EVERY pick of the 2020 NFL Draft can be found here. You can also find all of our pre-draft and up-to-the-minute analysis categorized and readily available here. Get your copy of the PFF 2020 NFL Draft Guide today by clicking here.]
METHODOLOGY
The comps below were derived from a two-step process. First, I used player age (as of Sept. 1, 2020) and draft position as filters, then used the rest of the matching features in principle component analysis (PCA). I found the closest statistically comparable players by euclidean distance between the players' principle components, and then gave each a “Similarity” score based on percentile of distance.
The filters for age and draft position are plus/minus 1.5 years and one round, respectively. The metrics for PCA are: weight, 40-yard dash, rushing attempts per game, rushing yards per game, receptions per game, market share of running back rushing attempts, and market share of running back receptions. All numbers are from prospects’ final seasons. For missing Combine 40-yard dash times, I filled the values with Pro Day times plus a 0.1-second penalty, or estimated using weight and other measurables.
I’m showing the top-five comps for each prospect in the table, but I expand the list to 15 for the process of projecting WAR over the first four seasons. The plots below with the ceiling, mean and floor WAR outcomes are based on the set of 15 prospects.
KE’SHAWN VAUGHN, TAMPA BAY BUCCANEERS
| Similarity | Draft Year | Player | College | Draft Pos | Age | Weight | Forty | RuAtt/Gm | RuYds/Gm | Rec/Gm | MS RuYds | MS Rec |
| 100% | 2020 | Ke'Shawn Vaughn | Vanderbilt | 76 | 23.3 | 214 | 4.51 | 16.6 | 85.7 | 2.4 | 78% | 64% |
| 98% | 2011 | Shane Vereen | California | 56 | 22.6 | 210 | 4.55 | 19.3 | 97.3 | 1.8 | 65% | 60% |
| 96% | 2011 | Alex Green | Hawaii | 96 | 23.2 | 225 | 4.55 | 10.4 | 85.6 | 1.9 | 74% | 84% |
| 94% | 2010 | Montario Hardesty | Tennessee | 59 | 23.6 | 225 | 4.49 | 21.7 | 103.5 | 1.9 | 68% | 45% |
| 93% | 2016 | C.J. Prosise | Notre Dame | 90 | 22.3 | 220 | 4.48 | 15.7 | 102.9 | 2.6 | 68% | 100% |
| 89% | 2015 | Duke Johnson Jr. | Miami (FL) | 77 | 21.9 | 207 | 4.54 | 18.6 | 127.1 | 2.9 | 61% | 78% |
Sure to be a darling in fantasy football leagues due to his favorable destination playing with Tom Brady, Vaughn has Brady’s old receiving back Shane Vereen as his closest comparable player. The rest of Vaughn’s top comps have had receiving success, but not a dominant workload on the ground.
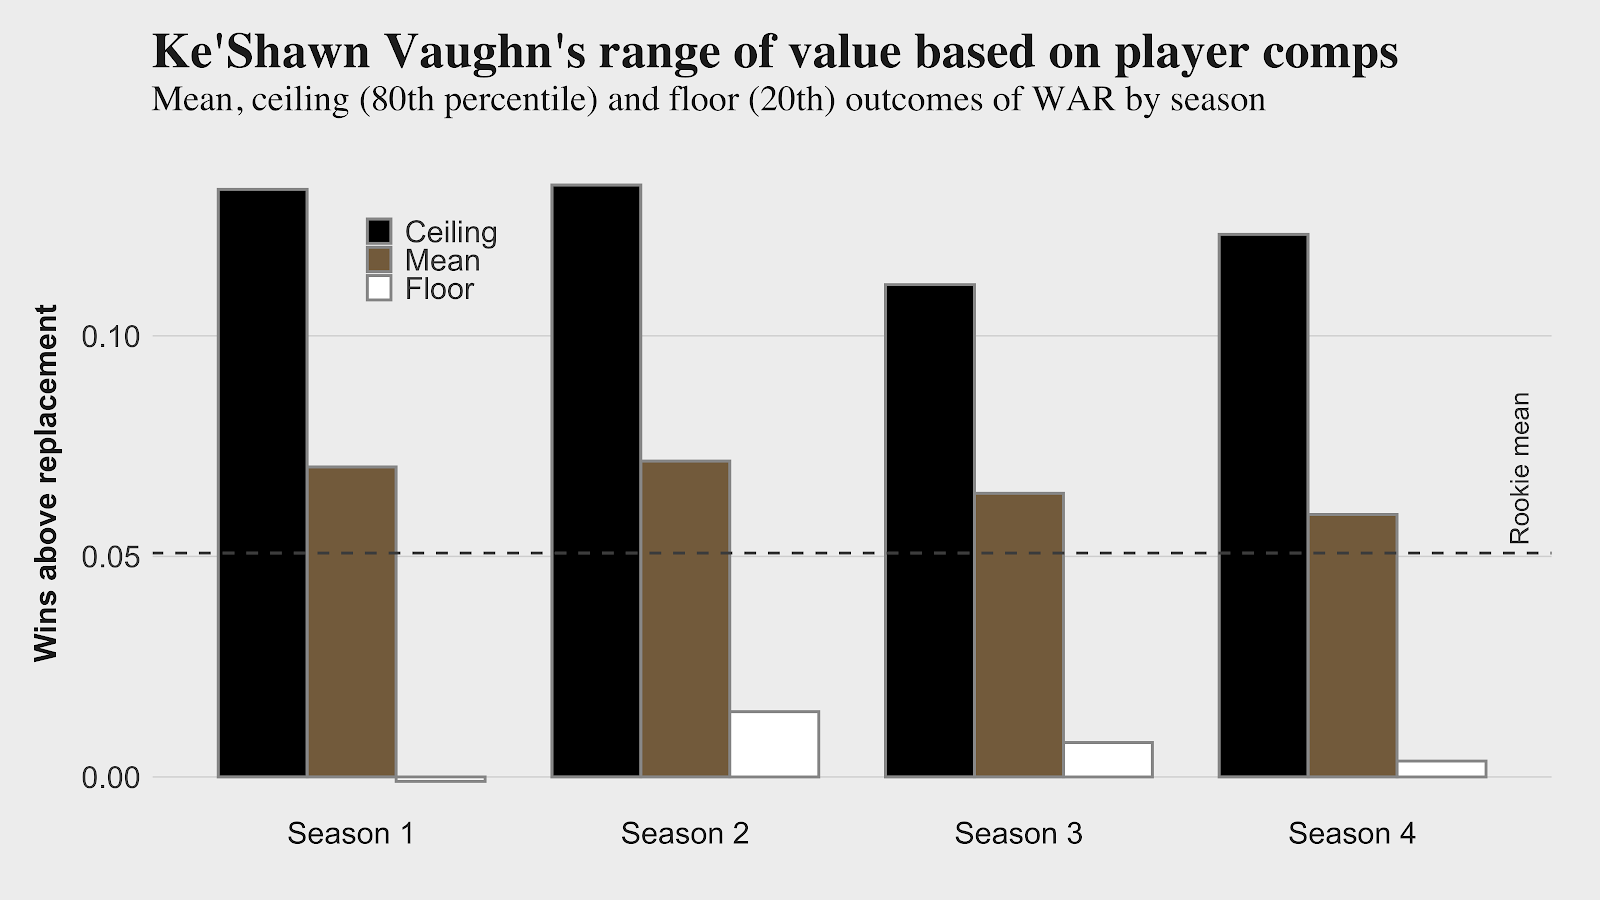
Vaughn has OK, but not spectacular, performance for his comps. What keeps the numbers decently high is usage in the passing game, which drives value much more in our WAR metric than rushing production.
JOSHUA KELLEY, LOS ANGELES CHARGERS
| Similarity | Draft Year | Player | College | Draft Pos | Age | Weight | Forty | RuAtt/Gm | RuYds/Gm | Rec/Gm | MS RuYds | MS Rec |
| 100% | 2020 | Joshua Kelley | UCLA | 112 | 22.8 | 212 | 4.49 | 20.8 | 96.4 | 1.0 | 100% | 100% |
| 98% | 2019 | Ryquell Armstead | Temple | 140 | 22.8 | 220 | 4.45 | 21.0 | 110.1 | 0.8 | 100% | 100% |
| 97% | 2019 | Justice Hill | Oklahoma St | 113 | 21.8 | 198 | 4.40 | 15.6 | 89.5 | 1.3 | 100% | 89% |
| 95% | 2017 | Wayne Gallman | Clemson | 140 | 22.9 | 215 | 4.57 | 15.5 | 75.4 | 1.3 | 84% | 83% |
| 93% | 2017 | Joe Williams | Utah | 121 | 24.0 | 210 | 4.41 | 23.3 | 154.3 | 1.0 | 100% | 100% |
| 92% | 2018 | Nyheim Hines | North Carolina St | 104 | 21.8 | 198 | 4.38 | 15.1 | 85.5 | 2.0 | 100% | 100% |
Kelley was selected a bit earlier than anticipated in the fourth round, but his comps aren’t looking very good. Most have only been part-time producers at best.
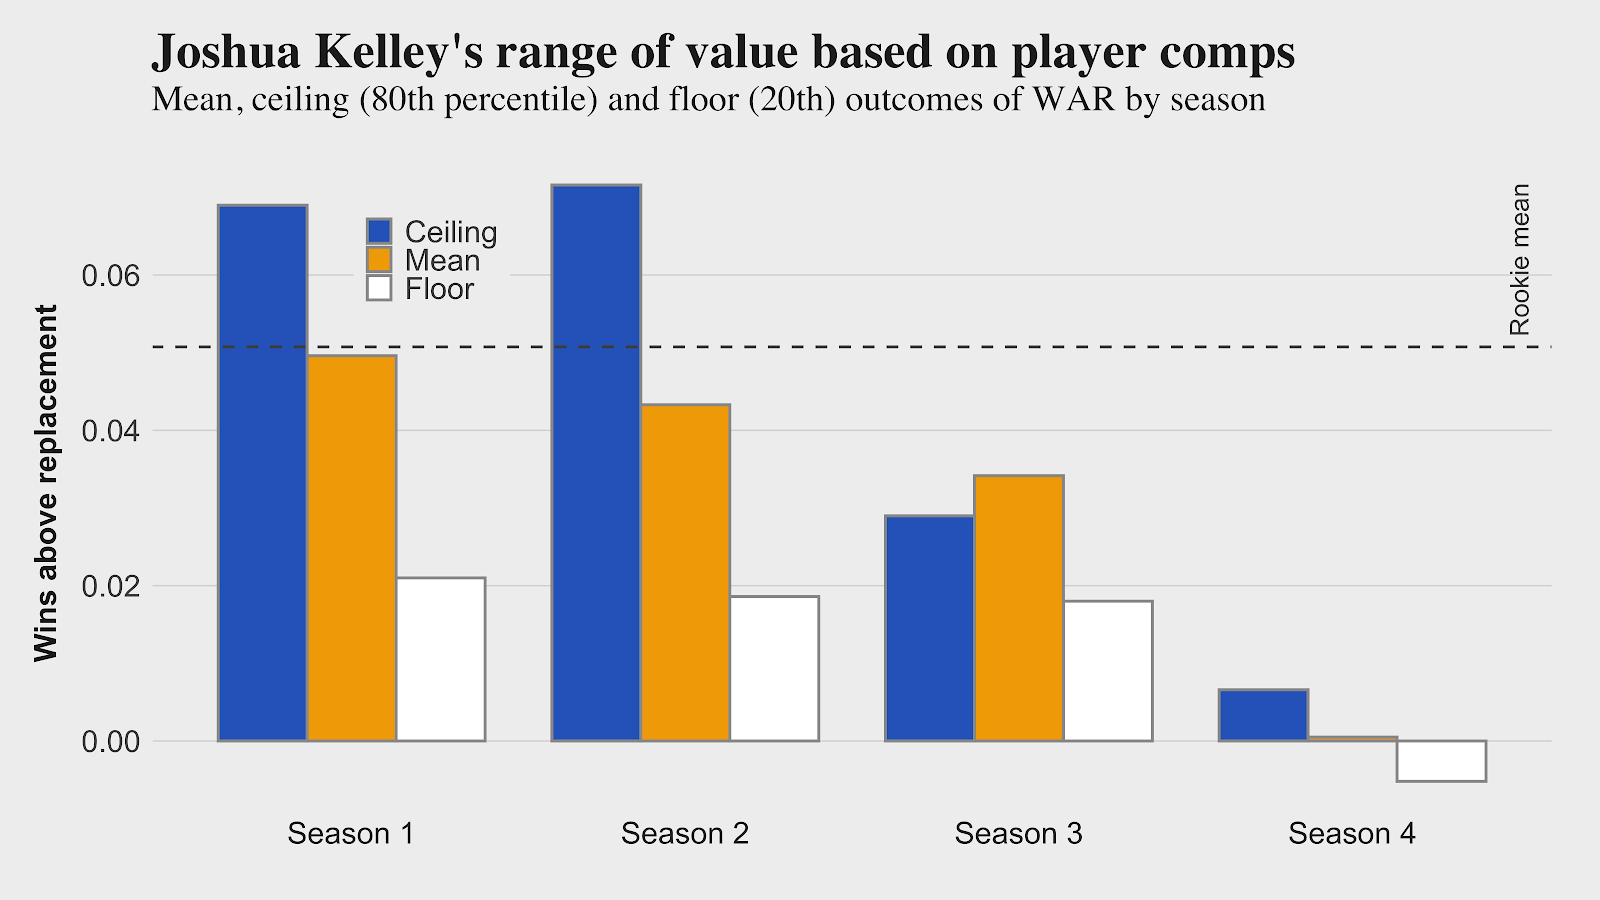
Kelley’s comps produced decently during their first couple of seasons and then trailed off at the end of their rookie contracts. For a fourth-round pick, it isn’t the worst outcome.
LAMICAL PERINE, NEW YORK JETS
| Similarity | Draft Year | Player | College | Draft Pos | Age | Weight | Forty | RuAtt/Gm | RuYds/Gm | Rec/Gm | MS RuYds | MS Rec |
| 100% | 2020 | Lamical Perine | Florida | 120 | 22.6 | 216 | 4.62 | 10.2 | 52.0 | 3.2 | 100% | 100% |
| 99% | 2018 | Chase Edmonds | Fordham | 134 | 22.4 | 205 | 4.55 | 16.0 | 31.0 | 2.0 | 100% | 100% |
| 97% | 2019 | Bryce Love | Stanford | 112 | 22.2 | 200 | 4.64 | 16.4 | 73.6 | 2.0 | 100% | 100% |
| 95% | 2011 | Alex Green | Hawaii | 96 | 23.2 | 225 | 4.55 | 10.4 | 85.6 | 1.9 | 74% | 84% |
| 94% | 2013 | Marcus Lattimore | South Carolina | 131 | 21.8 | 221 | 4.69 | 15.9 | 73.6 | 2.9 | 68% | 70% |
| 92% | 2016 | Kenneth Dixon | Louisiana Tech | 134 | 22.6 | 215 | 4.58 | 18.0 | 97.6 | 3.0 | 75% | 83% |
Despite low rushing usage and production in his final season at Florida, Perine comps to decent NFL producers like Alex Green. Landing at the Jets won’t bring immediate opportunity behind Le’Veon Bell, but if they move on from Bell after the season, Perine would have an outside chance at starting in 2021.
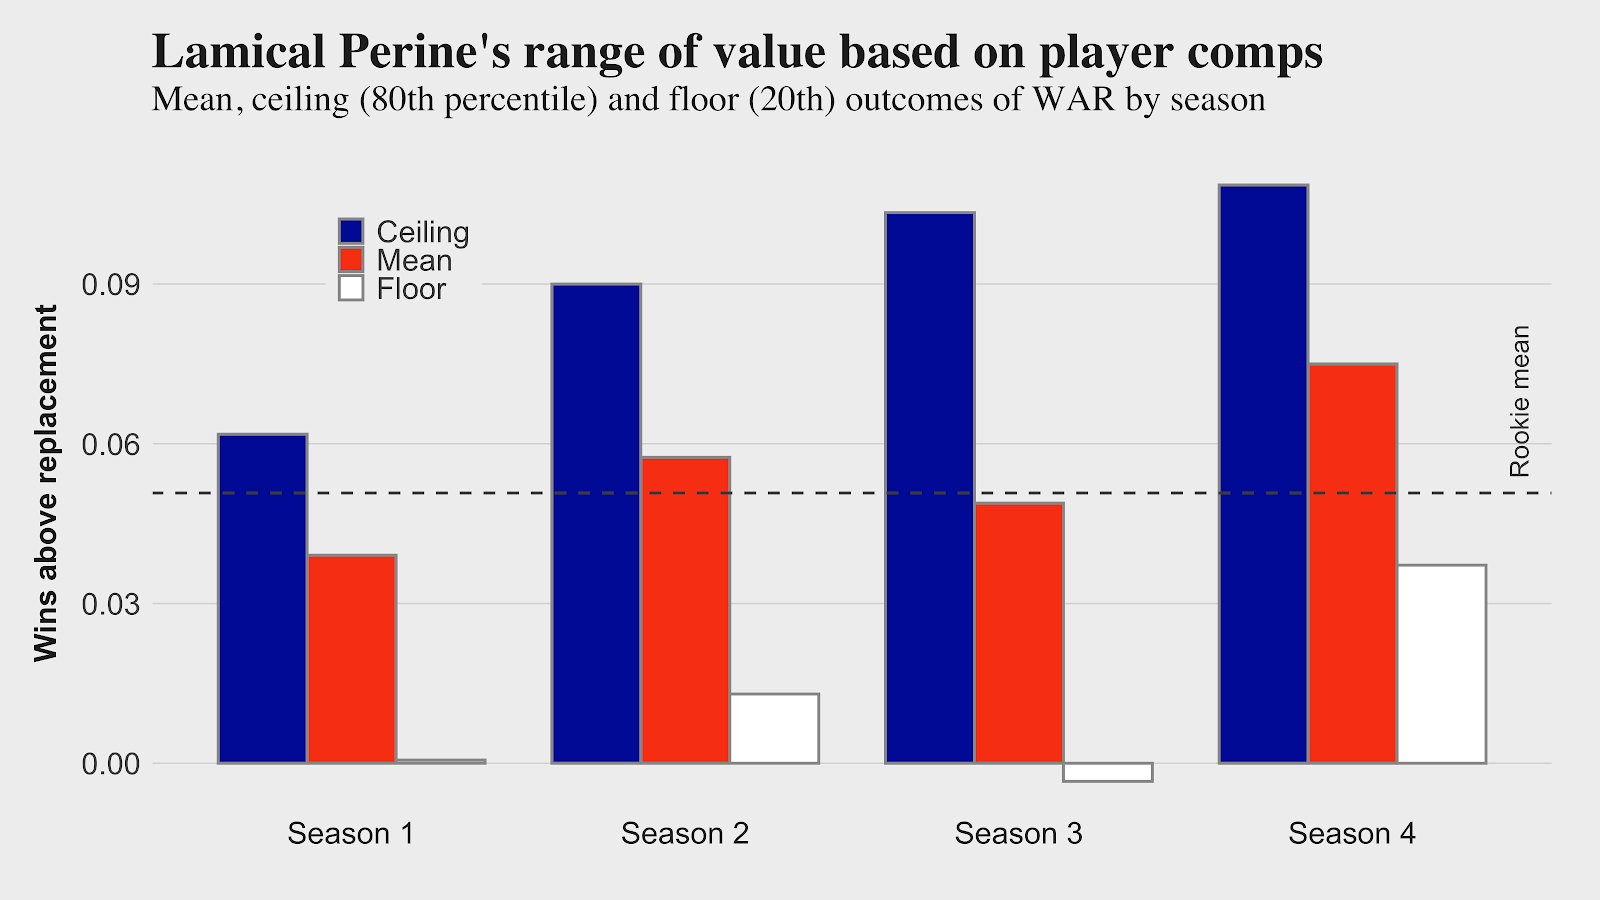
Perine’s comps show a steady increase in production through their rookie contracts.
ANTHONY MCFARLAND JR., PITTSBURGH STEELERS
| Similarity | Draft Year | Player | College | Draft Pos | Age | Weight | Forty | RuAtt/Gm | RuYds/Gm | Rec/Gm | MS RuYds | MS Rec |
| 100% | 2020 | Anthony McFarland Jr. | Maryland | 124 | 21.5 | 208 | 4.44 | 10.1 | 55.4 | 1.5 | 55% | 74% |
| 98% | 2014 | Devonta Freeman | Florida St | 103 | 22.5 | 206 | 4.58 | 12.4 | 72.6 | 1.6 | 60% | 82% |
| 94% | 2010 | Joe McKnight | USC | 112 | 22.4 | 198 | 4.47 | 13.7 | 84.5 | 1.8 | 48% | 49% |
| 93% | 2009 | Andre Brown | North Carolina St | 129 | 22.7 | 224 | 4.49 | 13.5 | 59.0 | 2.2 | 58% | 49% |
| 87% | 2017 | Marlon Mack | USF | 143 | 21.5 | 213 | 4.50 | 14.6 | 99.1 | 2.3 | 67% | 54% |
| 85% | 2019 | Tony Pollard | Memphis | 128 | 22.3 | 210 | 4.52 | 5.6 | 39.9 | 2.8 | 27% | 67% |
McFarland lands in the Steelers' fairly open and potentially fruitful backfield. He isn’t a big back but could be an immediate contributor in the passing game. Another smallish back, Devonta Freeman, is his closest comparable player, which would represent a great early-career outcome for McFarland.
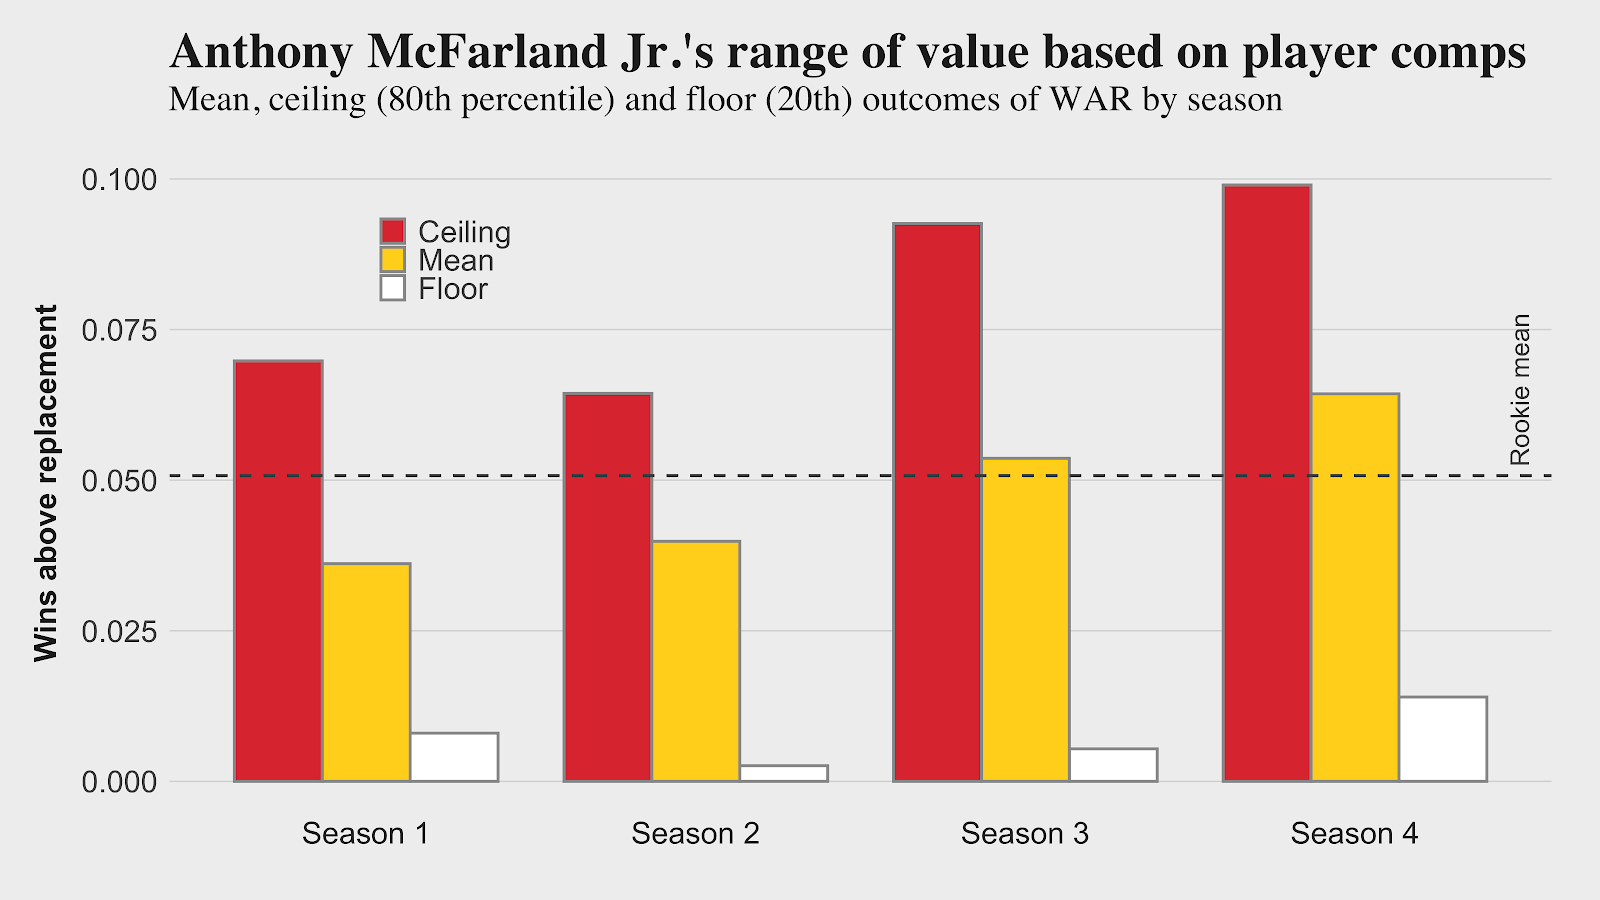
McFarland’s mean production is right around the rookie mean, with the ceiling based on players like Freeman well above.
DEEJAY DALLAS, SEATTLE SEAHAWKS
| Similarity | Draft Year | Player | College | Draft Pos | Age | Weight | Forty | RuAtt/Gm | RuYds/Gm | Rec/Gm | MS RuYds | MS Rec |
| 100% | 2020 | DeeJay Dallas | Miami (FL) | 144 | 22.0 | 217 | 4.58 | 11.5 | 68.7 | 1.4 | 100% | 100% |
| 98% | 2017 | Wayne Gallman | Clemson | 140 | 22.9 | 215 | 4.57 | 15.5 | 75.4 | 1.3 | 84% | 83% |
| 96% | 2019 | Bryce Love | Stanford | 112 | 22.2 | 200 | 4.64 | 16.4 | 73.6 | 2.0 | 100% | 100% |
| 94% | 2018 | Chase Edmonds | Fordham | 134 | 22.4 | 205 | 4.55 | 16.0 | 31.0 | 2.0 | 100% | 100% |
| 93% | 2013 | Zac Stacy | Vanderbilt | 160 | 22.4 | 216 | 4.55 | 15.9 | 87.8 | 0.8 | 70% | 63% |
| 91% | 2018 | Mark Walton | Miami (FL) | 112 | 21.4 | 202 | 4.60 | 14.0 | 106.8 | 1.8 | 68% | 76% |
A couple of Dallas’ comps have shown something in the NFL, with Chase Edmonds a meaningful producer for the Arizona Cardinals and Zac Stacy a highly productive rookie with the Rams seven years ago.
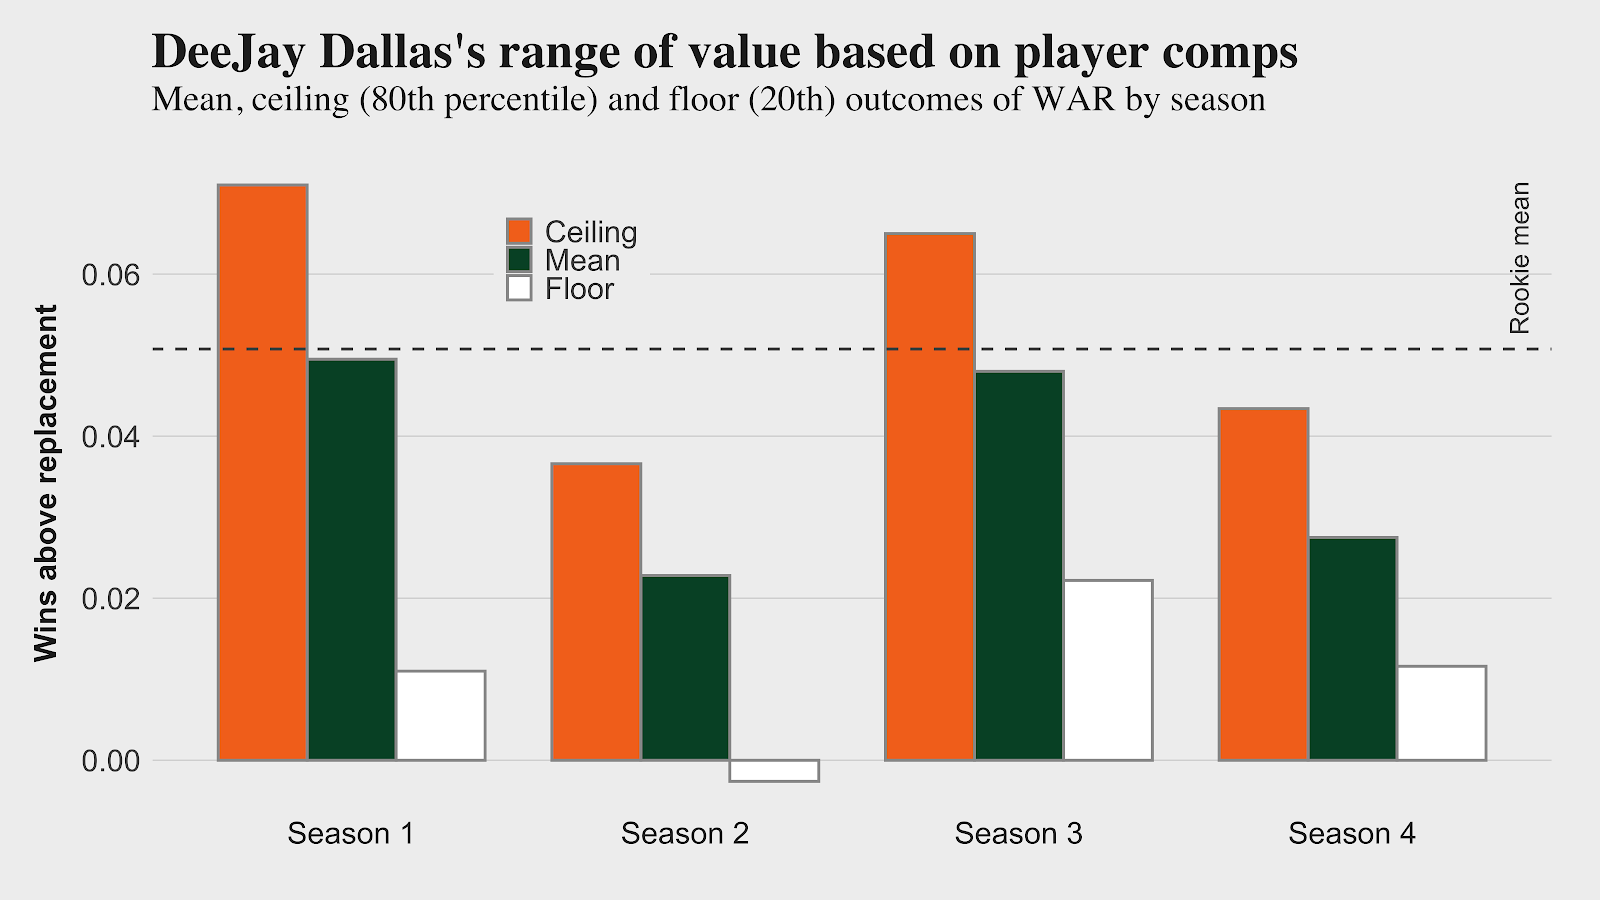
Dallas’ ceiling outcome is around average for rookie contracts, though the Seahawks have a history with Chris Carson of giving later picks an opportunity to thrive.
