After more than a decade of shaping the landscape of analytics in the NFL and college football, PFF now brings its renowned player grading system to the beautiful game, evaluating every player for each event during a game. This document describes the entire process from grading each event to ranking player performances for a facet. The process can be broken down into three steps: (1) play-by-play grading, (2) normalizing the grades and (3) converting the grades.
1. Play-by-play grading
PFF grades each event on a -2 to +2 scale with increments of 0.5, with 0 being the expected grade. For example, an unpressured pass to an open target that is completed earns a 0 grade, while a pass that breaks through a defensive line under pressure is above expectation and likely rewarded with a positive grade.
Unlike traditional data, PFF measures “performance relative to expectation” instead of just traits or measurable factors. The system looks at every play, creating a large sample size that eliminates bias and identifies undervalued players while avoiding player hype. The grading process evaluates players objectively, regardless of perceived ability.
PFF's grading process is built on a strict grading guide to turn subjective analysis into objective measurements. Graders must first demonstrate accuracy in the first two phases of data collection and undergo rigorous training on grading. Less than 10% of the data collection team become graders, including former performance analysts, current/former professional players, and individuals with demonstrated accuracy in data collection.
During a match, an average of 5-7 graders work on a specific facet simultaneously to allow for natural auditing. PFF also has several checks in place to ensure grading consistency and accuracy, such as major grade checks, flagging uncertain grades for senior graders, regular reviews, grading analysis, and a quality control team.
Overall, PFF's grading system is designed to create consistency and accuracy in subjective analysis through a rigorous process and checks to ensure high-quality data.
2. Normalizing the grades
PFF recognizes that context is crucial in evaluating player performance, and that grading on a 9-point scale can overlook important contextual factors. To address this issue, raw player grades are adjusted to account for the expected performance in specific game situations using a mathematical framework.
For example, if a player is in a historically favorable situation, his grade may be adjusted down slightly, while a player in more unfavorable circumstances may get an adjustment in the other direction.
To determine the baseline expectation for each player on every play, PFF collects over 135 fields of data and normalizes the grades accordingly. For instance, headers generally receive lower grades than other shots because they are more difficult to execute, and are therefore normalized to reflect this difficulty.
To establish the expectation for each grade, PFF uses statistical models. These models learn what typically happens in a given scenario for each facet of play by using characteristics of the event as explanatory variables and the given play-by-play grade as the response variable.
Each facet has its own model, which is currently estimated for passing, crossing, shooting, ball carrying, challenge, clearance, carry defending, blocking, and shot stopping. For every grade, the model estimates its expected grade based on the circumstances of the event. The given play-by-play grade is then adjusted with the expected grade before the grades are converted to a 0-100 scale.
By adjusting raw grades for contextual factors, PFF is able to provide a more accurate and nuanced evaluation of player performance, taking into account the specific circumstances of each play.
3. Converting the grades
The grades are normalized and converted to a 0-100 scale at game and season levels to make comparisons between players more intuitive. The season grade is not simply an average of a player's game grades, but rather reflects their entire body of work. While an 80.0 game grade is not one of the best games of all time, a season of games with 80.0 grades represents outstanding consistency and likely one of the best seasons in history.
It is possible for a player to have a season grade higher than their highest individual game grade, as playing well over an extended period is harder than for a short period. For example, a player scoring an unsaveable goal from distance in a game is not uncommon, but doing so in every game would constitute an incredible season.
Once the grades have been normalized, players have their normalized grades averaged. Based on the average, a percentile rank is assigned to the player. This percentile rank is then used to convert the normalized grades to a 0-100 scale.
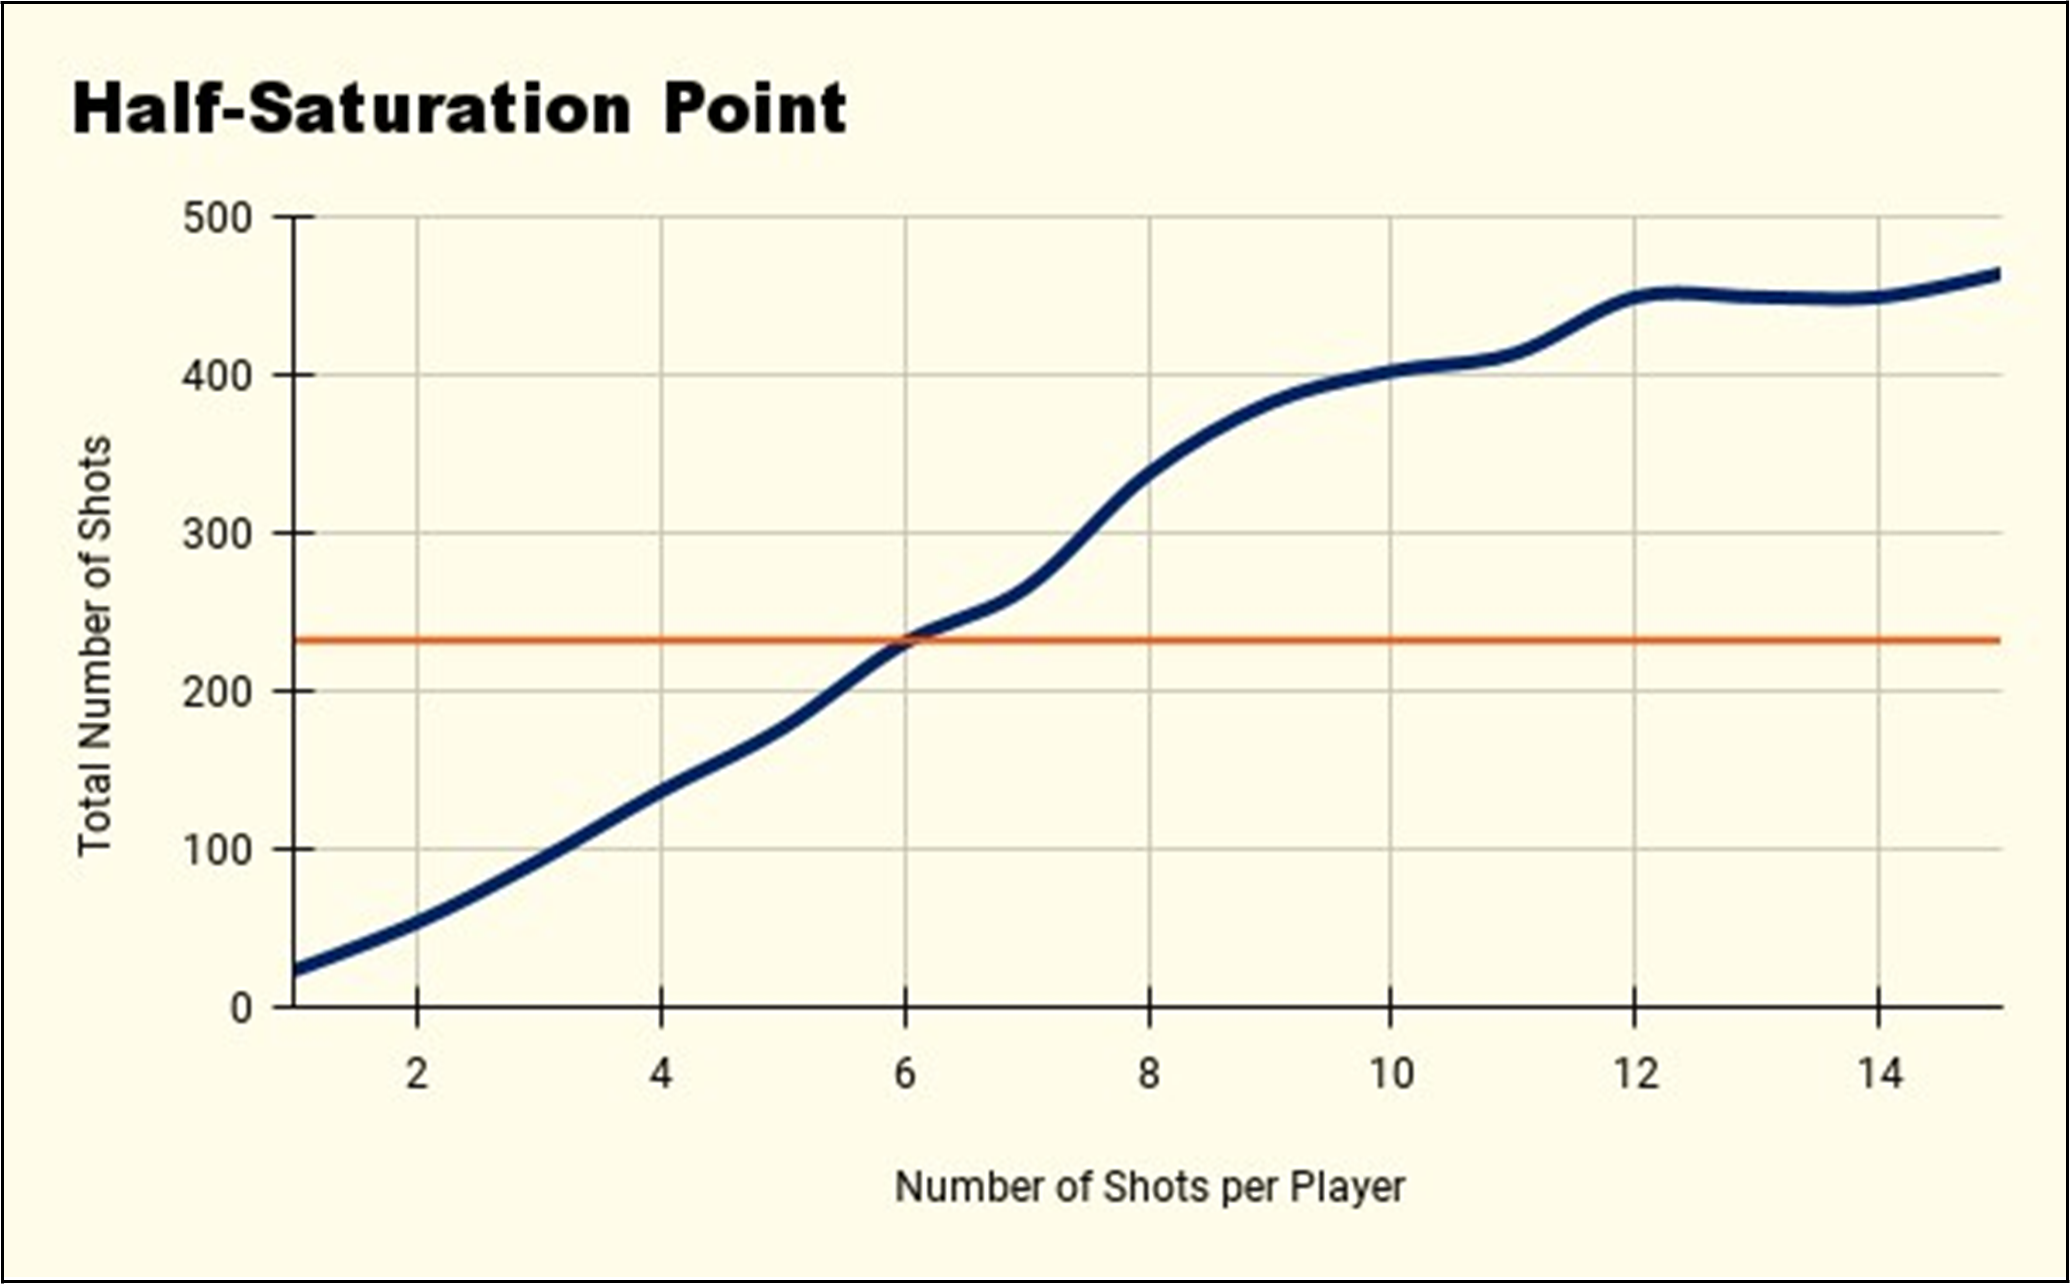
To ensure that our 0-100 rankings aren't heavily influenced by small sample sizes, a half-saturation point is calculated, because a player who only took two shots during a season shouldn't be ranked at the top or bottom because there simply isn't enough information to evaluate his shooting performance. The half-saturation point helps determine the mean and standard deviation of the distribution for each player based on their sample size. For example, consider a subset of data where the table below depicts the distribution of number of shots (23 players have taken one shot, while 15 players took two shots, and so on).

The half-saturation point is determined by taking half the total number of shots in the data set (464). This value (232) is reached after six shots, as seen on the graph below, where the blue line represents the cumulative sum of shots taken. Therefore, the half-saturation point in this example is six.
To ensure accurate rankings, PFF uses a smoother formula to calculate a player's mean and standard deviation based on the number of data points available. The half-saturation point is taken into account, gradually shifting the mean and standard deviation towards the full sample size values as the number of data points increases.
Players above the half-saturation point are considered to have a full sample size and are converted to a distribution with a mean of 75 and a standard deviation of 25. Players below the half-saturation point are considered to have a partial sample size and are converted to a distribution with a mean of 60 and a standard deviation of 1.
This ensures that a player's ranking is not overly influenced by a small amount of data, while still allowing for the inclusion of all available information to produce accurate rankings. Players with a full sample size are ranked more confidently, since there is enough information to evaluate their performance, while players with a partial sample size are ranked with more uncertainty. To ensure that the highest-ranked player for a facet has a grade between 90.0 and 99.9, the full sample size mean in the smoother formula can be adjusted up or down.
After using the smoother formula, the resulting grade distribution for each facet typically has a mean around 65 and a standard deviation of approximately 8. As a result, grades below 30 are extremely rare. Because of this, the 0-100 scale may look different than expected, as shown in the scale below.
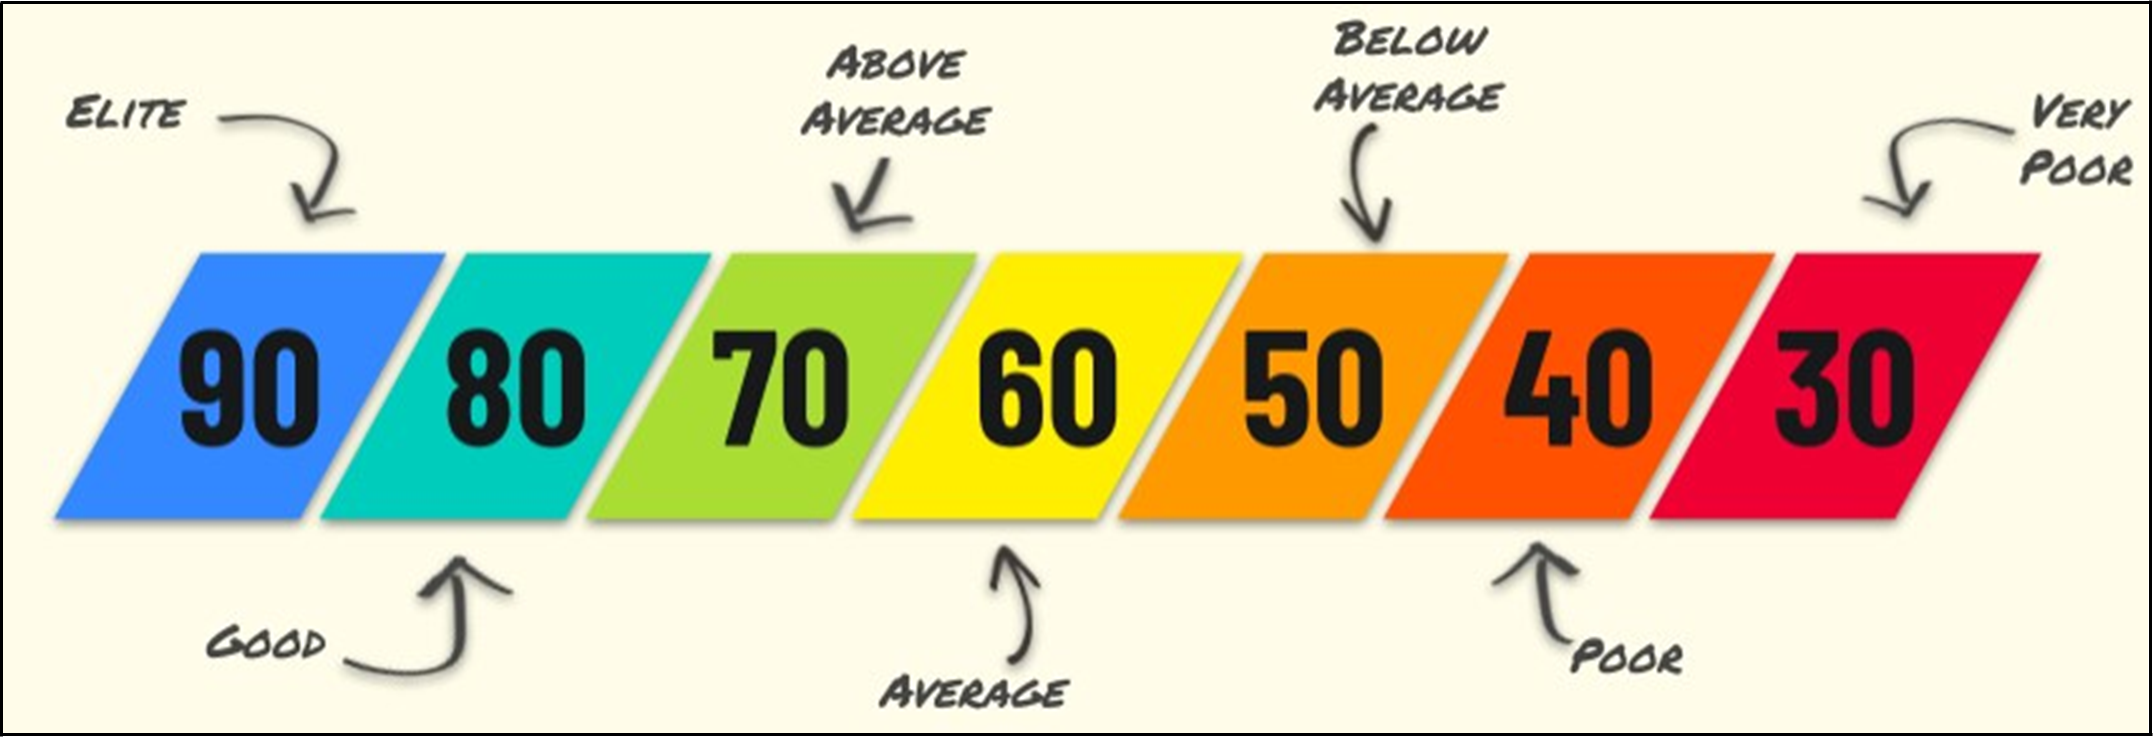
It is important to note that the grade distributions are contextual on the competition. For instance, a player with a grade of 70.0 in the Premier League may not have a similar level of performance as another player with the same grade in Major League Soccer. Nevertheless, it can be inferred that both players have performed better than average for that facet in their corresponding competitions.
