Offensive linemen are some of the most important players on the field, but they constitute one of the most understudied position groups in football.
It’s difficult to evaluate offensive linemen because traits like awareness and technique are hard to quantify. We’ve recently looked at an offensive lineman's value, specifically in pass protection. PFF's offensive line grades are split into run- and pass-blocking. These consider how a lineman performs and then give a grade (from -2 to +2) for each play.
An offensive line's quality and consistency can affect the outcome of a game. Many football games are won up front — every playoff team in 2021 had a top-15 offensive line based on PFF grades. Without a solid offensive line, it is impossible for a quarterback to have enough time to make good decisions. The line has to work together as a unit, as well — one mistake and the whole line breaks down.
The 2016 Dallas Cowboys are a great example: Dallas had a rookie quarterback and running back, but the Cowboys' talented offensive line gave them a solid foundation to work with. They accrued the third-best offense according to PFF grades in 2016 and finished sixth in run-blocking. Dak Prescott posted a 2.88-second average time to throw, per Next Gen Stats — the fifth-highest amongst quarterbacks that season and above the 2.64-second league average. Tyron Smith, Zack Martin and Travis Frederick provided the Cowboys with valuable veteran experience.
Methodology
In this article, we will examine offensive line volatility in performance from an individual player and a team standpoint. Volatility is calculated using Gini indices, which are traditionally used to measure wealth inequality.
In this case, volatility can be defined as how a player distributes his overall season performance throughout the season on a game-by-game basis. This is not the same as streakiness, which is a clustering of performances over a season. Variance is also different from volatility, as it calculates the dispersion of performances about the mean performance. Volatility is more time specific, so we can look at it on a week-to-week, month-to-month or season-to-season basis.
We used PFF’s all blocking data, which has the player grades for every play as well as the block type and block location. It is more granular than looking at the expected points added (EPA) of a play an offensive lineman was involved in.
Given that offensive line play is largely about not making mistakes, high volatility will lead to worse performances for the offense. The offensive linemen need to be consistent with their speed and footwork to ensure success. While their performances may also be dependent on who they’re blocking, the more reliable offensive linemen will also be less volatile, meaning they are less likely to allow defenders to pressure or sack the quarterback and are more likely to facilitate the run game.
We calculated volatility based on linemen’s successful block rate and average PFF grade on a season-to-season basis.
Relating volatility to other metrics
Before diving into the results, we wanted to see how volatility related to draft position and other measurables. We looked at combine measurables from 2018-2020 to see how well they predicted volatility. We know that hand size, arm length, height and weight are important physical measurables for offensive linemen.
PFF has determined the most important combine drills for offensive linemen are the 40-yard dash, broad and vertical jumps, and the short shuttle. However, we found that there is not a strong correlation between volatility and combine measurables or drills, as draft position and round are also not highly correlated with volatility (0.13). Height had the strongest relationship with volatility (0.25).
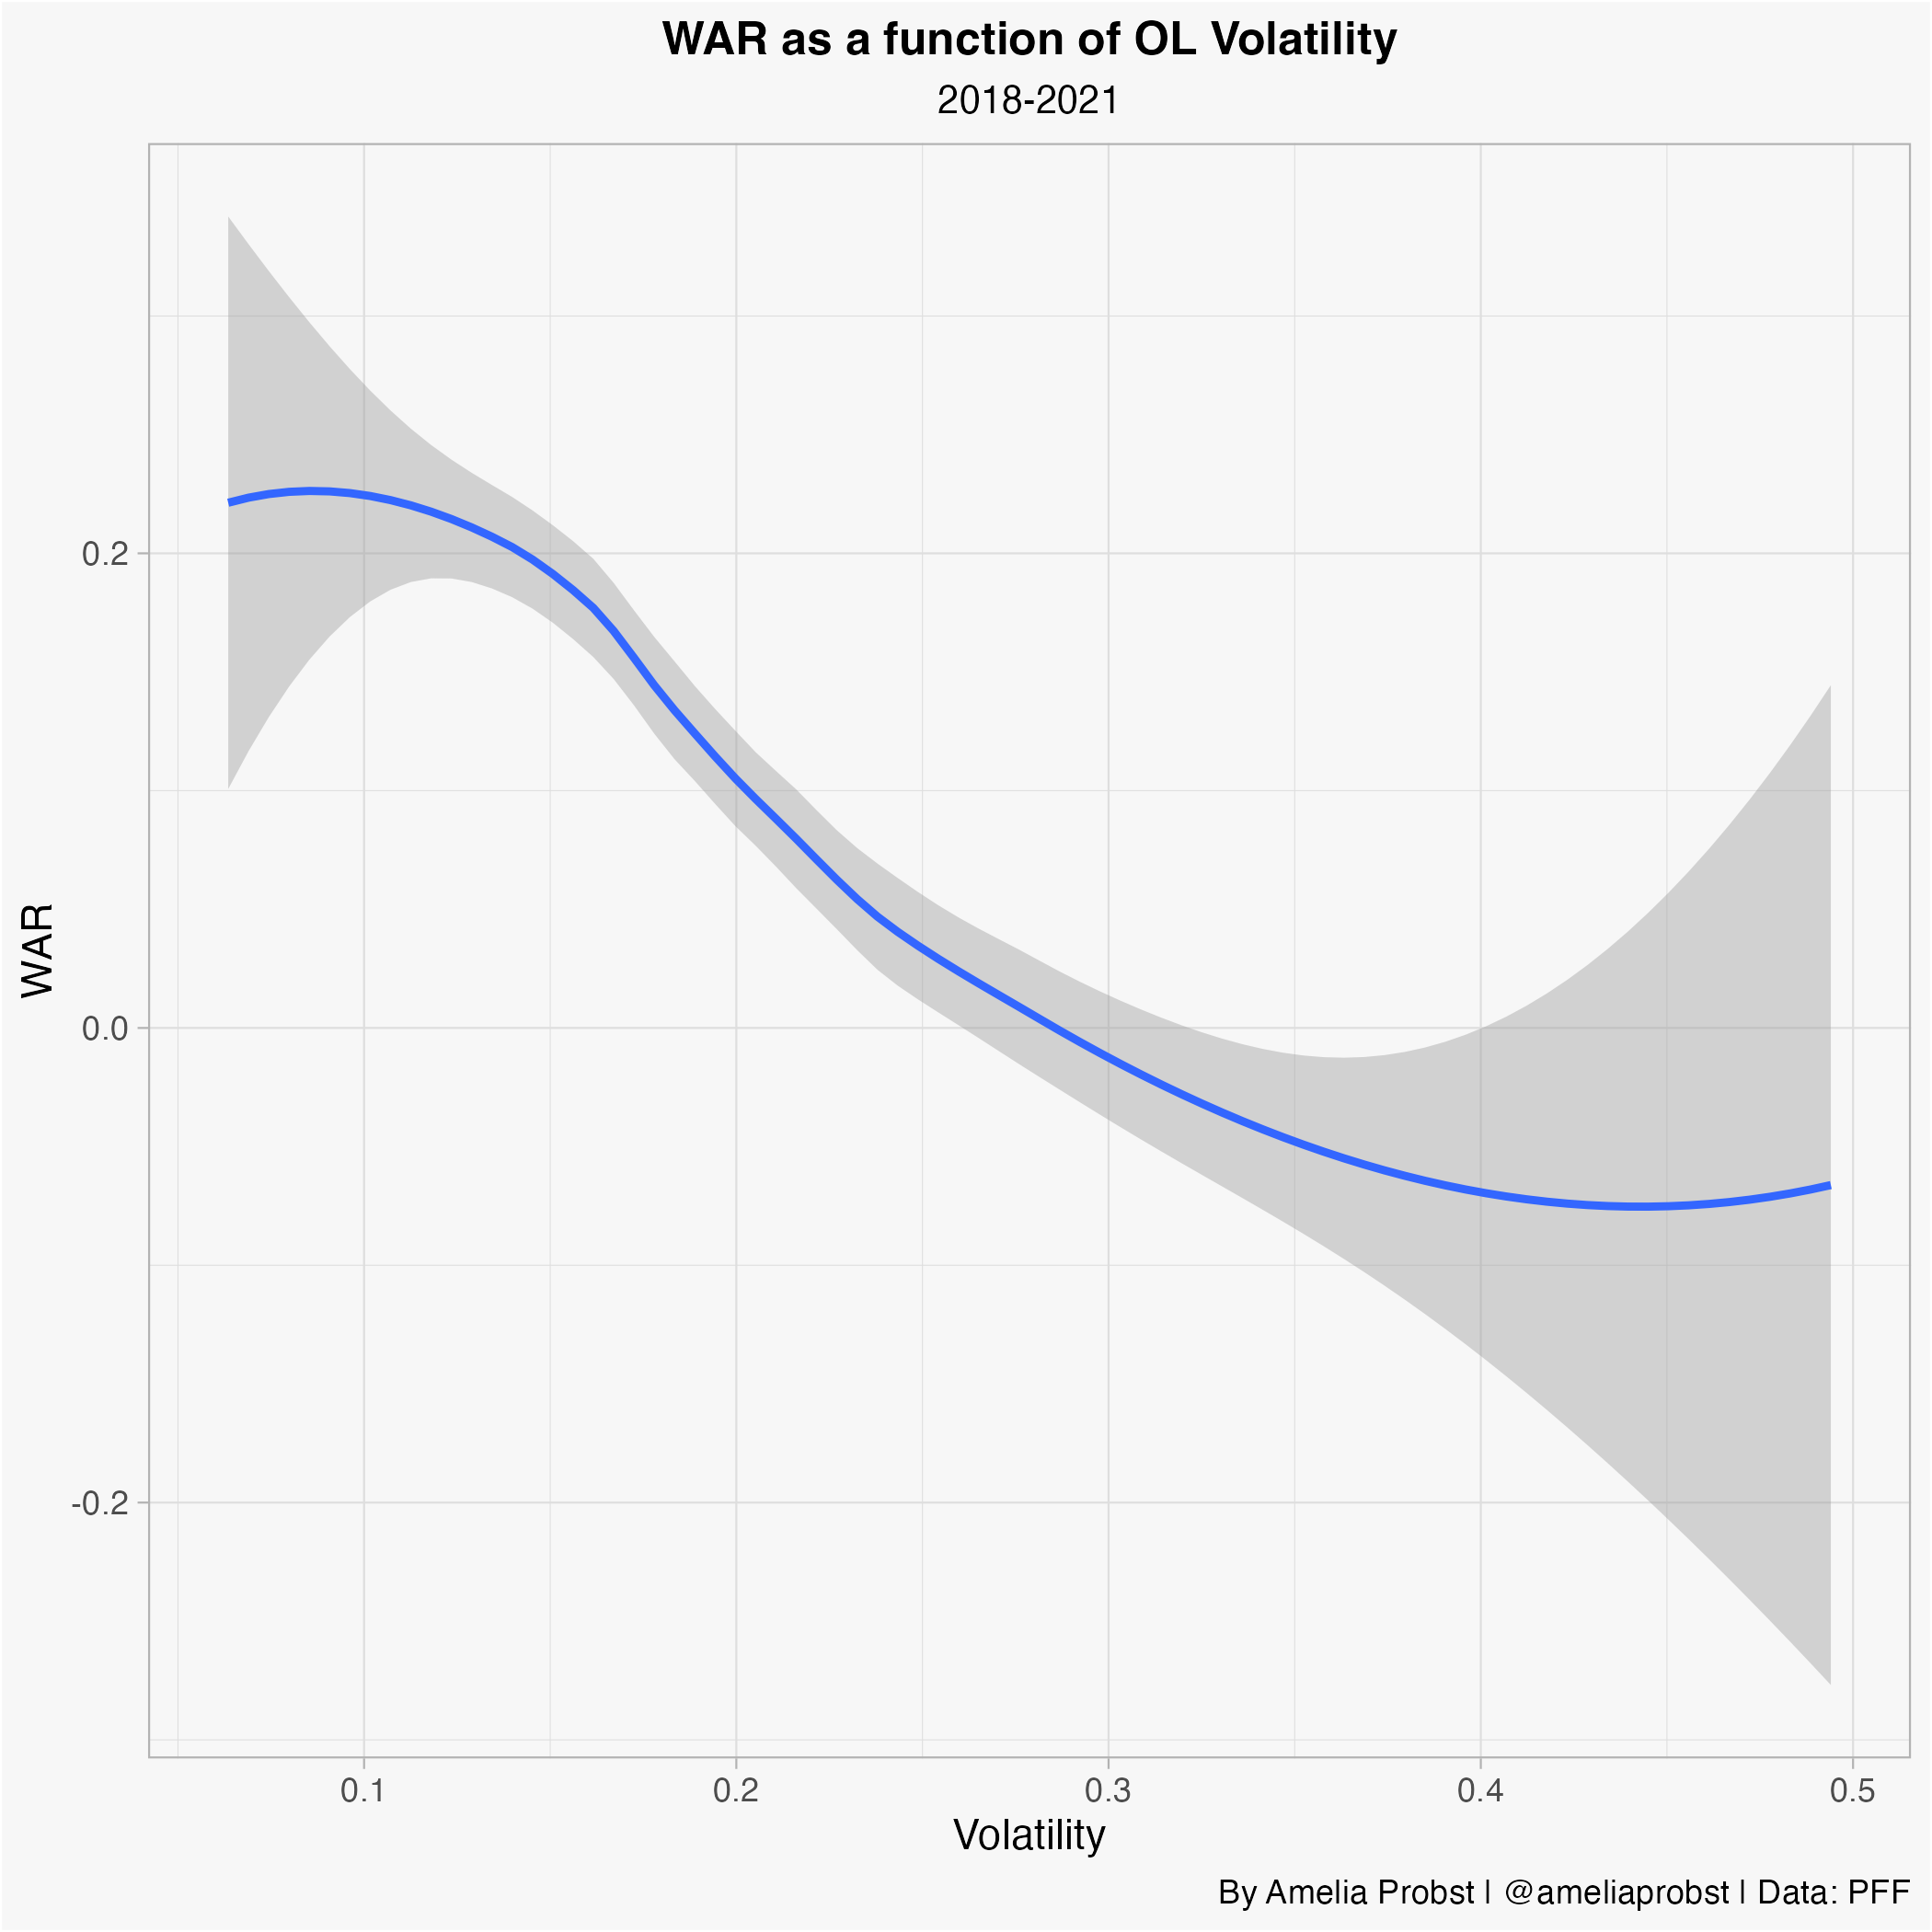
We also wanted to look at how current PFF metrics correlated with volatility. It was pretty strongly correlated with WAR (-0.48) and WAA (-0.47). The graphic below shows this relationship — WAR declines as volatility increases. Volatility is also strongly correlated with double team win rate (-0.42).
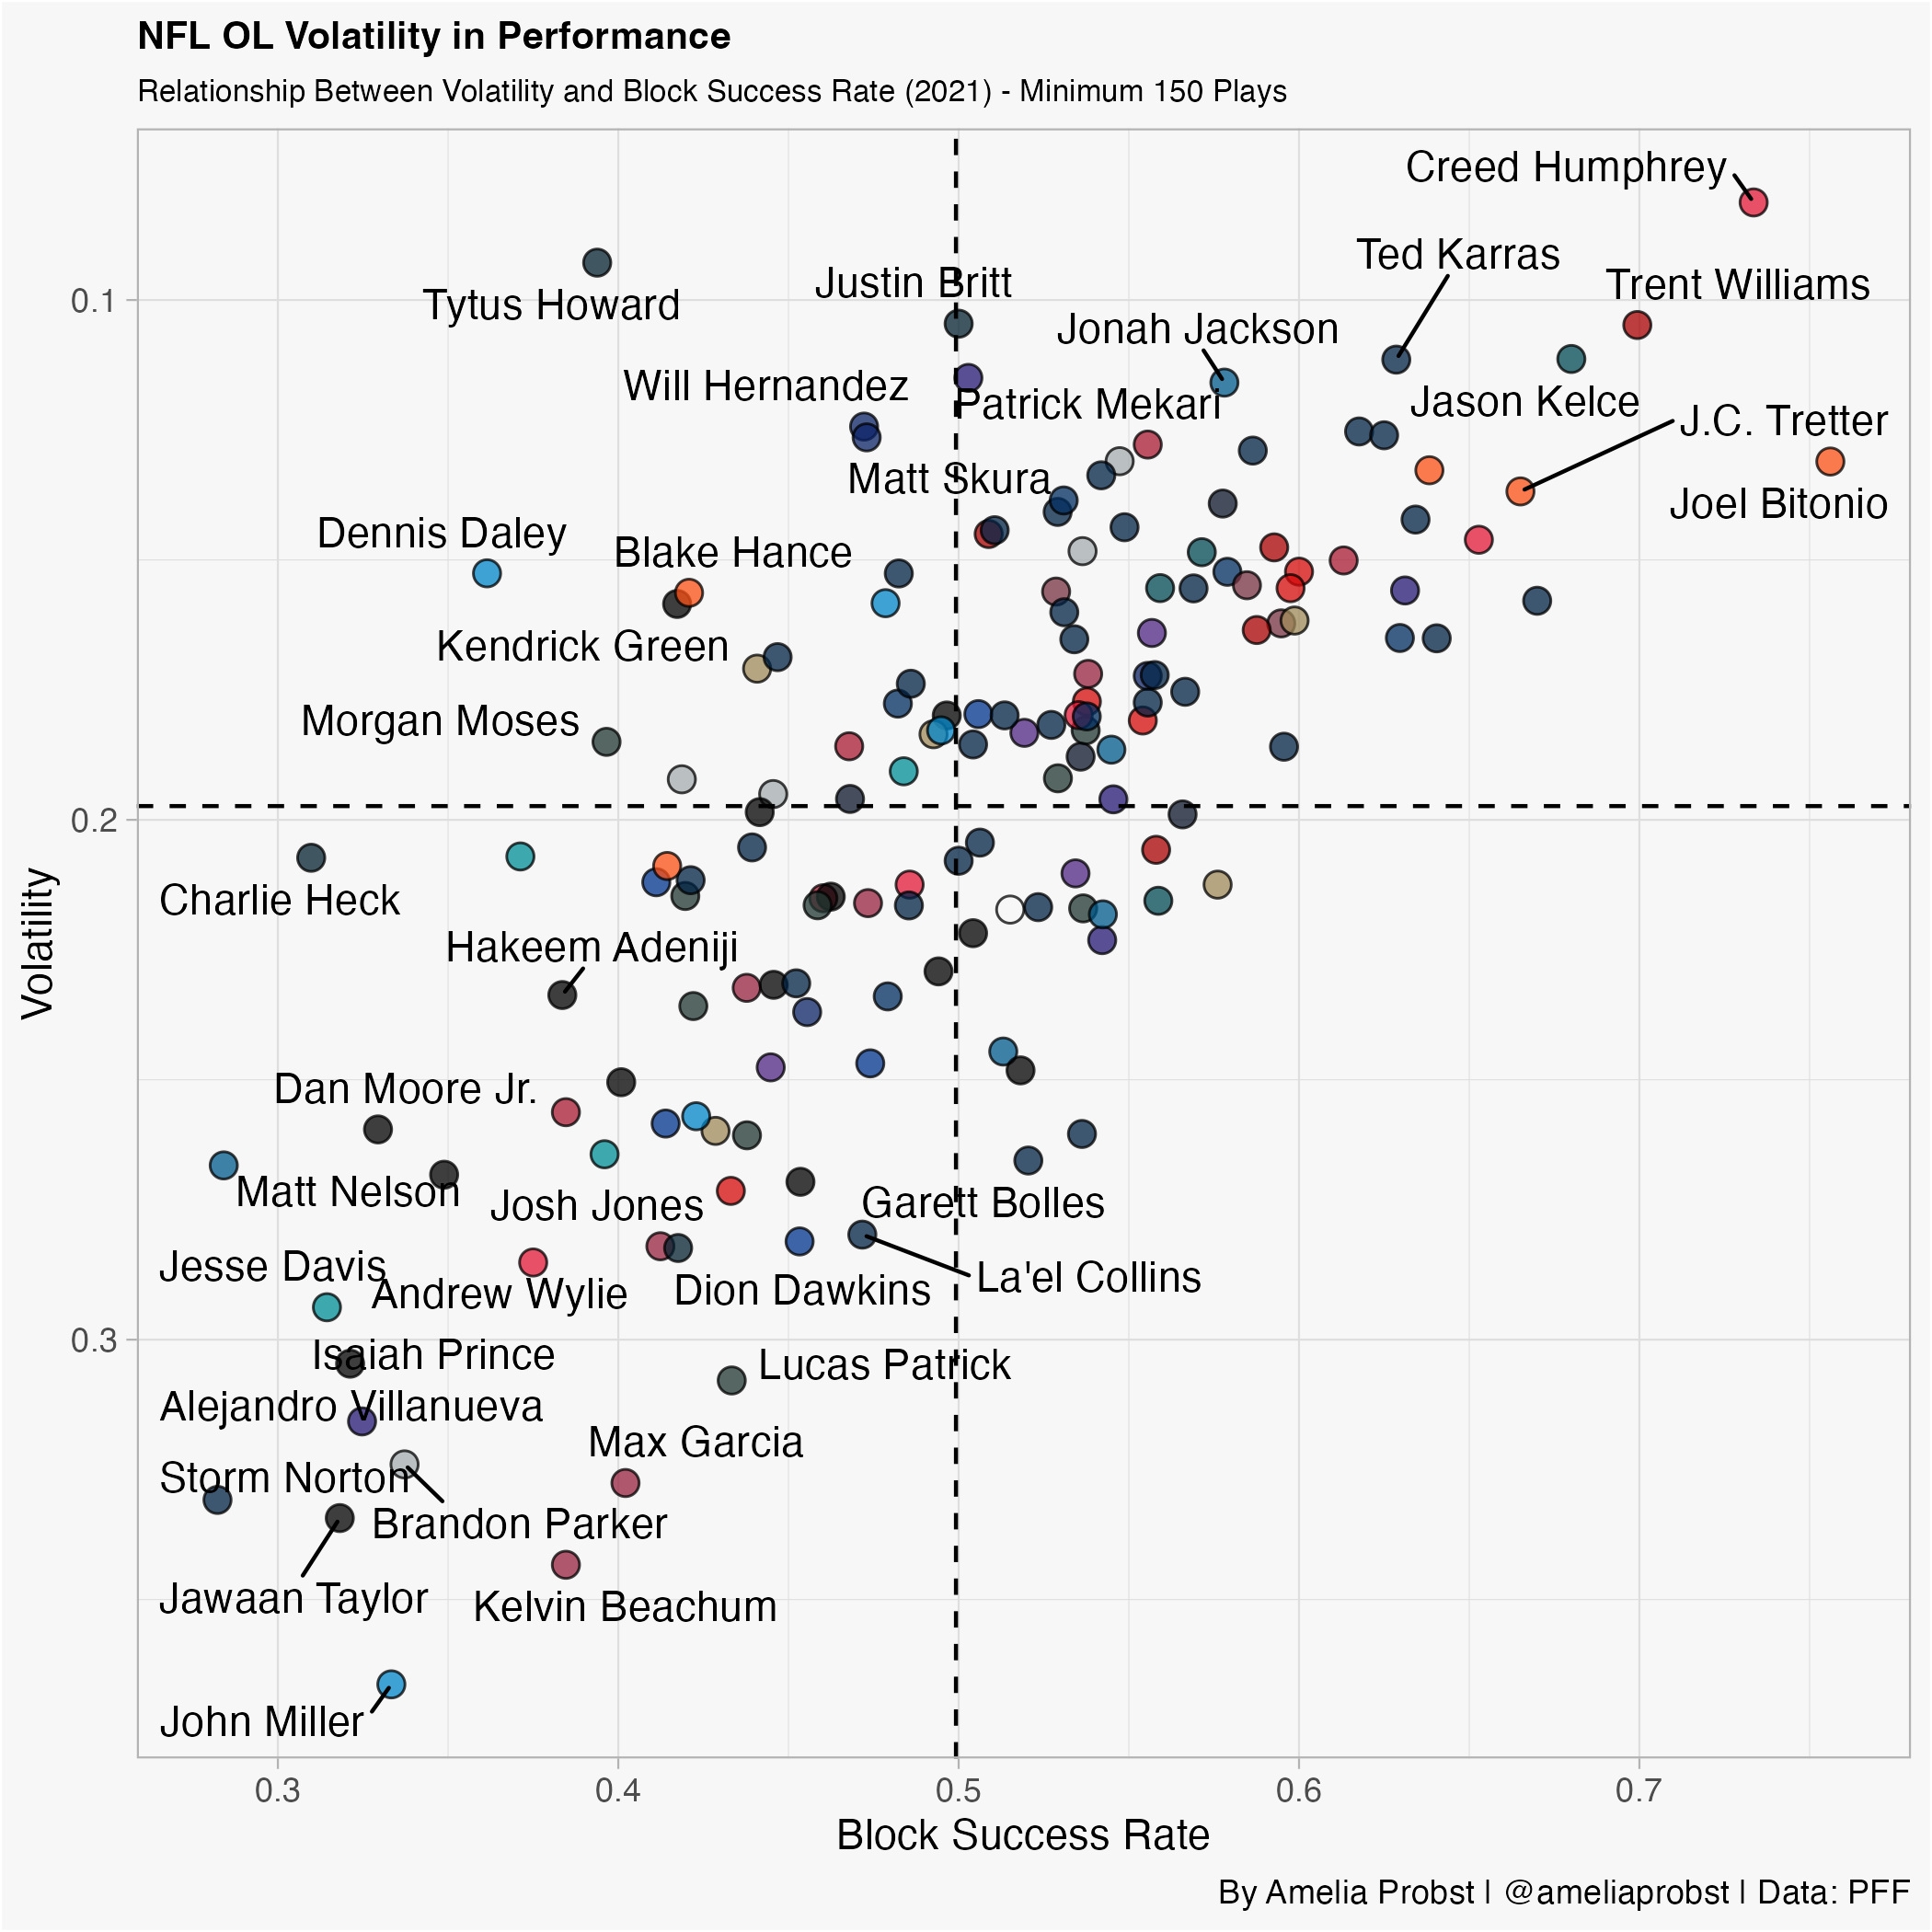
The graphic above shows how volatility related to block success rate in 2021. Block success is defined by a lineman’s grade on a play; therefore, if they had a positively graded play, that was a successful block. The linemen in the upper right corner have the highest block success rate and the lowest volatility — Creed Humphrey, Trent Williams and Joel Bitonio are known as good offensive linemen, which their low volatility emphasizes.
Which linemen are the most and least volatile?
