Offensive line play is one of the more intricate elements of football, and until Pro Football Focus came onto the scene, an aspect of the sport completely untouched by quantitative analysis. While more valuable positions like quarterback will get their fair share of attention this time of year, there are a bevy of teams that need an influx of talent along their front five if their offense is going to improve from 2018. This need is nontrivial from a statistical perspective, as we’ve found in our wins above replacement (WAR) study that the benefits in going from below replacement level to average along the offensive line are higher than those going from average to elite, which should increase the value of offensive linemen that, in the right scheme, can be competent pros right away.
A year ago, we wrote a series of articles laying out the statistical case for the predictiveness of our college grades and data at the NFL level. A year later and we now have five years of data for every college football player in the FBS, with which we will study how said data translated (so far) to the NFL for the 115 offensive linemen that have at least 250 pass-blocking snaps at tackle, guard or center at the college level and 100 pass-blocking snaps at the NFL level and the 105 players that have the same minimums met for run blocking.
As with everything, if you have any questions don’t hesitate to ask us on Twitter @PFF_Eric and @PFF_George. Enjoy!
Pass Protection
Since pass protection is the most important thing an offensive lineman does, it only makes sense to start there. We’ve previously found PFF grades and pressure data to be pretty predictive and stable for NFL players as they transition from season to season in the NFL. That’s certainly a great start in terms of documenting the rigor of the PFF system, but is not the same as answering whether or not play at the college level, as measured by PFF, is predictive of play at the pro level. We’re going to do this in a few phases, starting from the simple and getting to the more complex.
Metrics considered are per-play averages at the college and pro level for the duration of time the player is both at that level and charted by PFF. This does introduce some issues since players drafted in 2015 will have only one PFF college year and players drafted in 2018 will have only one NFL season. As we collect more data, these issues will dissipate, but we acknowledge them here.
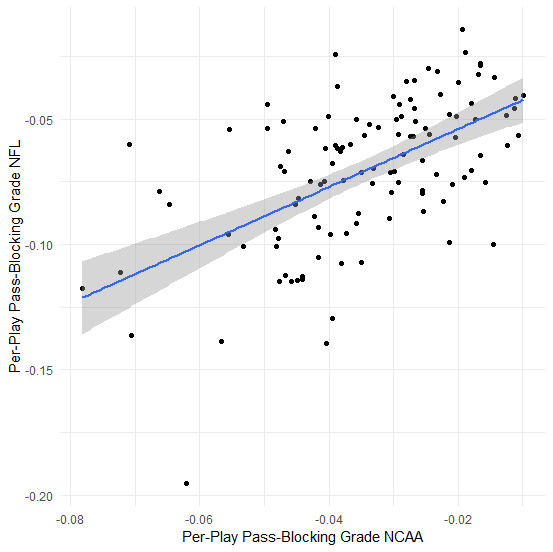
First, PFF grades (on the play-by-play level, not scaled to 0-100) at the college level correlate with PFF grades, “win” rate, pressures allowed and sacks allowed at rates of 0.56, 0.54, -0.52 and -0.39 (the latter two being negative is what you want — higher grades in college yield lower pressure and sack rates allowed at the NFL level). These rates are -0.49, -0.47, 0.48 and 0.33 for pressure rates mapping to the same four variables, whereas “win” rate (defined by earning a zero or positive grade on a pass-blocking rep) correlated at rates of 0.58, 0.56, -0.54 and -0.40. These results are very encouraging, and the fact that PFF grades and “win” rates, while correlating highly with pressure rates (r ~ 0.95), do a better job of prediction at the NFL level than pressures, is a feather in the cap for the PFF system.
Breaking a sample of 115 players into three or five position groups is going to be problematic sample-size wise, but there are 49 players who meet the snap threshold at the college and NFL level while playing tackle, and their college-to-pro correlation in terms of PFF grade is 0.54, which is similar to the entire group pooled above. Interior linemen made a sample size of 51, and their grades were not quite as predictive, with a correlation of 0.19. Danny Isidora and Bradley Bozeman were both players with good college grades and poor NFL performances so far, albeit in just a combined 343 pass-blocking snaps.
With returns on simple analyses high, we turn our attention to adding other contextual variables like height, weight, draft pick (if applicable) and combine metrics. For a number of reasons, data is not always available for every player for every feature, but for the 59 players that had a value for each metric (either from the NFL combine or their pro day), we fit a random forest with five-fold cross-validation to per-play PFF grade and pressure rate at the NFL level and computed variable importances.
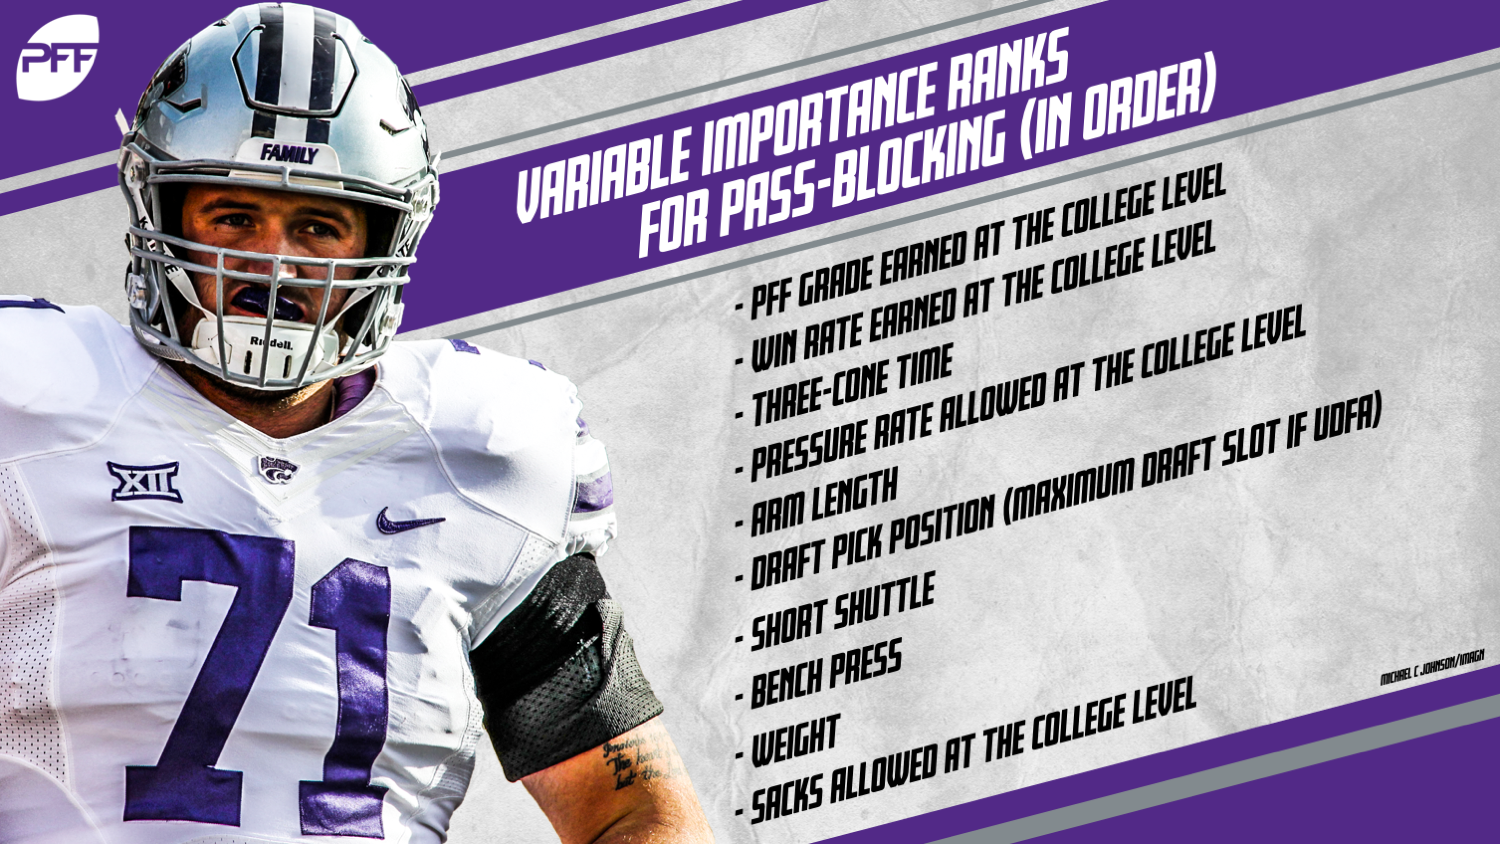
For PFF per-play grade earned, the 10 most important variables are, in order:
— PFF grade earned at the college level
— Win rate earned at the college level
— Three-cone time
— Pressure rate allowed at the college level
— Arm length
— Draft pick position (maximum draft slot if UDFA)
— Short shuttle
— Bench press
— Weight
— Sacks allowed at the college level
The order changes slightly when projecting pressure rate, but with the exception of hand size in place of weight, and hit rate allowed in place of sack rate, the top 10 variables stay the same. Thus, while combine metrics measuring size, strength and athleticism certainly matter at the next level in terms of pass protection, PFF grades and charting data, to this point, reign supreme in terms of projection, and other variables offer only a scant increase in predictiveness at the career level.
Run Blocking
While not as important, offensive linemen need to be able to block in the running game, and we need to be able to project them well as they emerge from college to pro. As with pass-blocking, we look at per-play PFF grade (not on the 0-100 scale), “win” rate (the proportion of run-blocking plays given a positive grade by PFF) and “loss” rate (a negative grade).
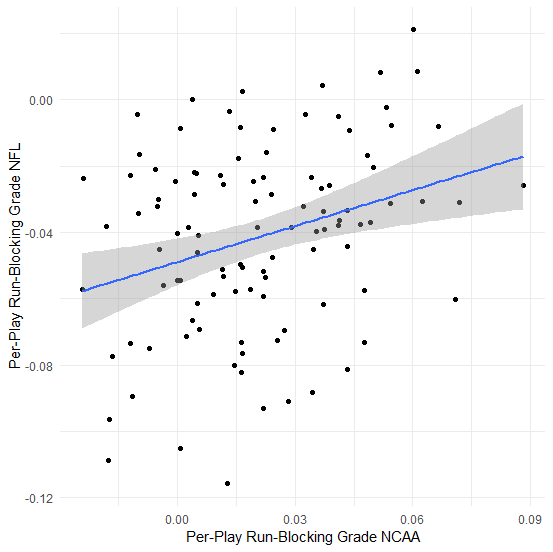
Per-play PFF grade is correlated at rates of 0.30, 0.25 and -0.21 with PFF grade, win rate and loss rate in the run game from college to pro. Win rate is correlated at rates of 0.21, 0.31 and -0.03 with the aforementioned variables, respectively, while loss rate -0.18, 0.03 and 0.27. This is not nearly as high as the correlations for pass-blocking, but are still good considering that there are numerous different run concepts at the college and pro level, relative to differences seen in passing game schemes. It’s also interesting to note that “winning” as defined by PFF grades, is not the opposite of “losing” as we’ve defined in the previous section on pass-blocking, and are relatively uncorrelated with each other as a player transitions from college to pro.
Filtering down to different positions, the 45 players that meet the snap thresholds at tackle have a higher correlation between their college and pro PFF run-blocking grades (0.42, n = 45), while interior offensive linemen have lower (0.15, n = 45), just as we saw for pass-blocking. Drilling down by run scheme decreases sample size too much at the career level, but is generally useful at the play level to predict future performance (more on this below).
As we did with pass-blocking, we folded in additional data from the NFL combine and pro days in a random forest, and found the following variables had the highest variable performance (n = 56 full cases):
Hand size
Loss rate at the college level
Draft pick position
Win rate at the college level
Short shuttle
Grade at the college level
Three-cone drill
Forty time
Broad jump
Weight
Hand size? While the rest of the upper-tier variables make sense, we tested this algorithm on the two other variables to make sure that there is signal here and not mostly noise, and as expected for win rate and loss rate, hand size remains one of the more important variables, but not in the top five. Thus, as the initial correlation studies would suggest, translating run blocking from college to pro is doable, but not as clean as pass-blocking.
Looking Ahead
While this article has given you an idea of the quality of PFF’s work grading offensive linemen in the passing and running game at the career level, we have play-by-play data at both the college and NFL level, and our actual projection of offensive line play leverages this rich data set by controlling for scheme, opponent, play-level situation, etc. to make projections on players subject to the scheme in which they will play at the NFL. While these specific projections are largely reserved for internal discussions, the PFF Forecast and our clients, viewing offensive line play through this model points us towards an offensive lineman that people have been fading in recent months: Kansas State’s Dalton Risner.
Risner’s ability to win in pass protection, with PFF grades above 84.0 in that area each year (and over 90.0 the last two), statistically overcome his age (23) and questions about whether or not he would be better suited to play guard. His statistical comps in an “average” scheme are David Bakhtiari and Cordy Glenn, and his 75th percentile comps to players like Duane Brown and Mitchell Schwartz.
While the players that we and most have mocked in the first round are certainly worthy of such acclaim, whichever team gets Risner in the draft will be getting a great value — if recent trends in PFF grading continue!
