A common exercise during draft season is to find NFL comparisons for draft prospects. And while this might not always be useful in terms of setting realistic expectations, it can be helpful for wide receivers, as there are many different types when it comes to the position.
For example, a wide receiver who is compared to DeSean Jackson is unlike someone who is compared to Julio Jones, even though both could be considered the best at their specific craft over the last decade. And knowing whether a draft prospect could be either compared to one of those two or a Cole Beasley-type of receiver certainly gives a long-time viewer of the NFL, one who might not know much of the prospect, a first idea of what kind of a receiver he is and whether or not that player could help their team.
Extending wide receiver clustering
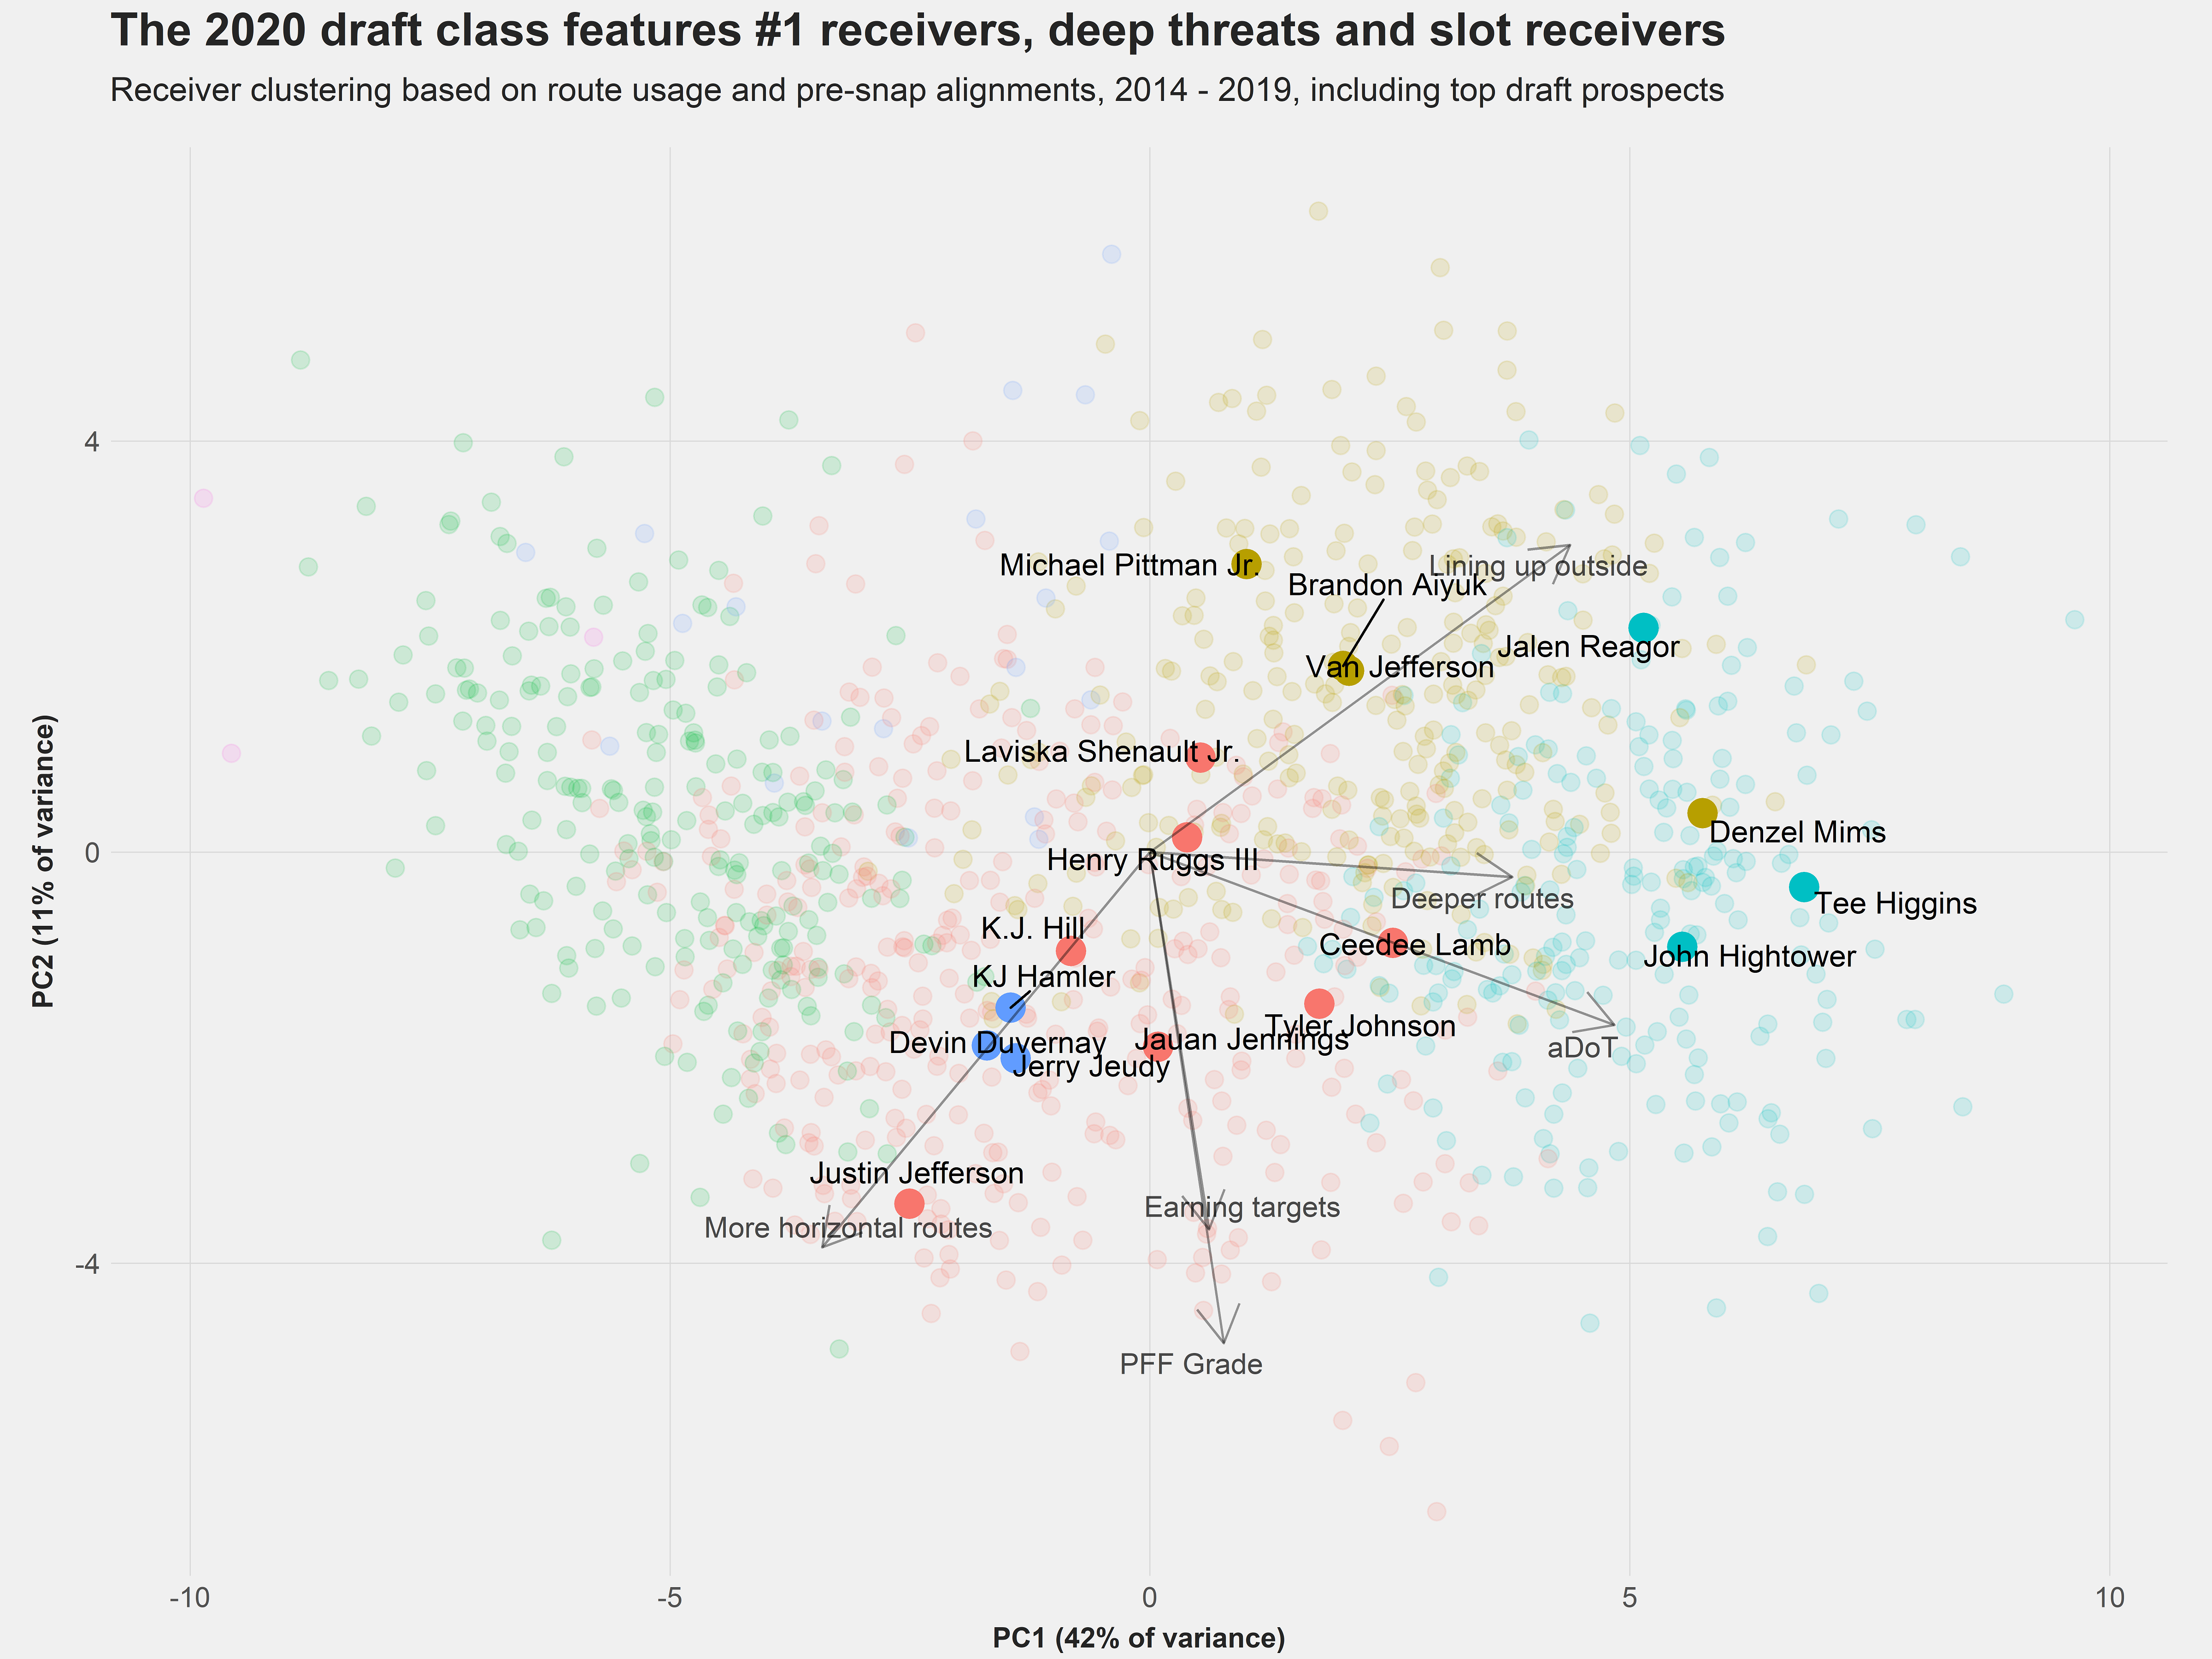
We’ve used wide receiver clustering before, but it was based only on route usage and pre-snap alignments and not on performance. Obviously, we don’t want to compare a projected sixth-round pick to Julio Jones just because he ran similar routes, so to avoid this, we extend our wide receiver clustering with performance features like PFF receiving grade, yards per route run, targets/air yards above expectation as well as measures that judge whether or not a receiver earns his targets while he's on the field. To find comps for a receiver, we will just look at which players are closest to him in the clustering data set.
We will find comparisons in two different ways: We can find the closest single seasons for prospects and use them to gain a PFF WAR projection, i.e., we will consider the 20 closest seasons and find a WAR forecast by computing the weighted (by the distance to the prospect) mean of the WAR of these wide receiver seasons. Additionally, we will find the closest comparison to a player using the career (since 2014, as we don’t have the route data prior to 2014) of an NFL receiver as a comparison. For that matter, we will only use receivers who have played at least three years in the NFL since 2014.
Since we include performance metrics in the clustering, we have to find reasonable projections for the production of draft prospects, as, naturally, Ceedee Lamb is very unlikely to reproduce the 3.99 yards per route run figure that he posted in the 2019 NCAA season. To account for this, we will use the performance metrics from both 2018 and 2019. Other than that, we don’t use a complicated model, but rather search for two different comparisons. The first run of our algorithm will regress the prospect’s college metrics to the mean by 25%, e.g., if a college receiver had one more yard per route run than an average NFL receiver, this figure is regressed to 0.75 yards per route run above average (if a prospect had a below-average performance by some measure, we leave that figure as it is). This can be considered as a reasonable best-case scenario for the respective prospect.
For the second run, we will regress the college production to the mean by 80%, and the result will represent a slightly worse future outcome. One could think of that scenario as how Corey Davis turned out at the pros: Not necessarily a clear bust, but still somewhat disappointing. Note that our top prospects' college production is almost always above average by all metrics we use, so our algorithm will still mostly shy away from comparisons to really bad players, and therefore, the full range of outcomes (think Laquon Treadwell or Corey Coleman) might not be properly reflected.
When reading through the comparisons, there are a few general things happening. When regressing to the mean by 80%, the most impressive comparisons from the best-case scenario are often gone or appear farther down the list. Consequently, the less impressive comparisons are closer. For the season comparisons, we often observe the same player for both scenarios, but the best season of the player is to be found in the best-case scenario while a worse season occurs in the worse scenario. If a player occurs as a comparison through multiple seasons with diametric performance, one can conclude that he is pretty close to the prospect in terms of usage. For example, this happens for Jalen Reagor, who is closely compared to Amari Cooper. In the scenario that regresses him to the mean by 80%, he is “only” compared to Coopers’ rookie season in 2015, while he is close to Coopers’ strong 2019 campaign in his best-case scenario.
We will study in detail the 10 best prospects, according to PFF's lead draft analyst, Mike Renner.
Ceedee Lamb, Oklahoma
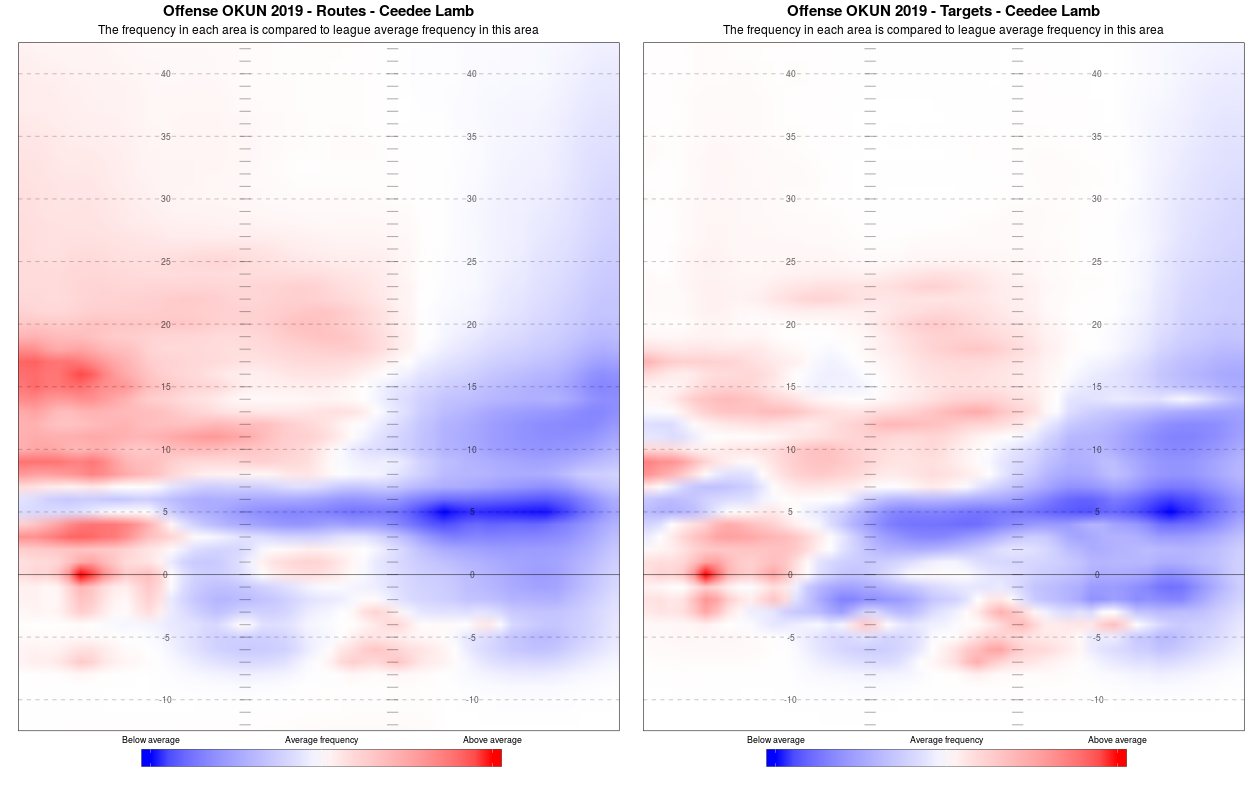
Ceedee Lamb’s role within the Oklahoma offense was an outside receiver who lined up almost exclusively at the left side of the field. From that alignment, he mostly ran go and post routes (34% of the time), hitches and comebacks (20% of the time) or prepared himself to catch a bubble screen (10% of the time). He ran 46% of his routes deeper than 15 yards and had an average depth of target of 14 yards. This would project him as an outside receiver who can attack downfield all over the map (provided he lines up at both sides) but also one who can also be used as a weapon with the ball in his hands on screen passes or jet motion.
Ceedee Lamb’s 91.3 receiving grade is the fourth-best among draft-eligible receivers, and he averaged 3.43 yards per route run from 2018 to 2019, the best figure among all Power-5 receivers who played during both years. Even if we regress this to the mean according to our choices, we still get figures of 2.9 and 1.8 yards per route run, with the first figure indicating an elite receiver and the second still indicating a solid receiver. Given his production, it’s no surprise that his best-case comparisons are vastly impressive, and they include Antonio Brown and Julio Jones.
Comparable seasons with 25% performance regression to the mean (the number below the year shows the PFF receiving grade)
|
Emmanuel Sanders 2014 88.3 |
Antonio Brown
2014 91.1 |
Tyreek Hill
2018 89.8 |
Marquise Brown 2019 72.6 |
|
Demaryius Thomas 2014 87.7 |
Taylor Gabriel
2016 85.9 |
Ted Ginn Jr.
2017 73.0 |
Julio Jones 2015 92.1 |
|
Taylor Gabriel 2014 72.6 |
Travis Benjamin
2016 67.3 |
Jeremy Maclin
2014 80.3 |
Jeremy Maclin 2015 80.1 |
Forecast: 0.61 WAR
Comparable seasons with 80% performance regression to the mean
| Travis Benjamin
2016 67.3 |
Marquise Brown
2019 72.6 |
Christian Kirk
2018 70.1 |
Ted Ginn Jr. 2017 73.0 |
|
Taylor Gabriel 2014 72.6 |
Donte Moncrief
2014 69.9 |
Travis Benjamin
2017 66.4 |
Curtis Samuel 2018 71.9 |
|
D.J. Moore 2018 73.7 |
Christian Kirk
2019 62.0 |
Tyler Lockett
2017 67.2 |
Deonte Thompson 2016 69.5 |
Forecast: 0.24 WAR
Comparable players with 25% performance regression to the mean
Antonio Brown, Tyreek Hill, Stefon Diggs, Travis Benjamin, Julio Jones, Demaryius Thomas, Emmanuel Sanders, T.Y. Hilton.
Comparable players with 80% performance regression to the mean
Travis Benjamin, Josh Bellamy, Tyler Lockett, Marqise Lee, Brandin Cooks, Stefon Diggs, Jeremy Maclin, Demaryius Thomas.
