• Kansas City Chiefs QB Patrick Mahomes enters the season as the favorite in PFF's simulation. He is currently tied for the third-best odds in the betting market.
• Justin Herbert and Joe Burrow are the most overpriced quarterbacks on the MVP betting market. They are both great quarterbacks, but it won't be easy for them to win their respective divisions.
• The most promising long shots include Tua Tagovailoa, Jameis Winston and Trevor Lawrence.
While winning the Lombardi trophy is the ultimate goal of every player in the league, the MVP award also plays a significant role during the NFL season.
The favorites
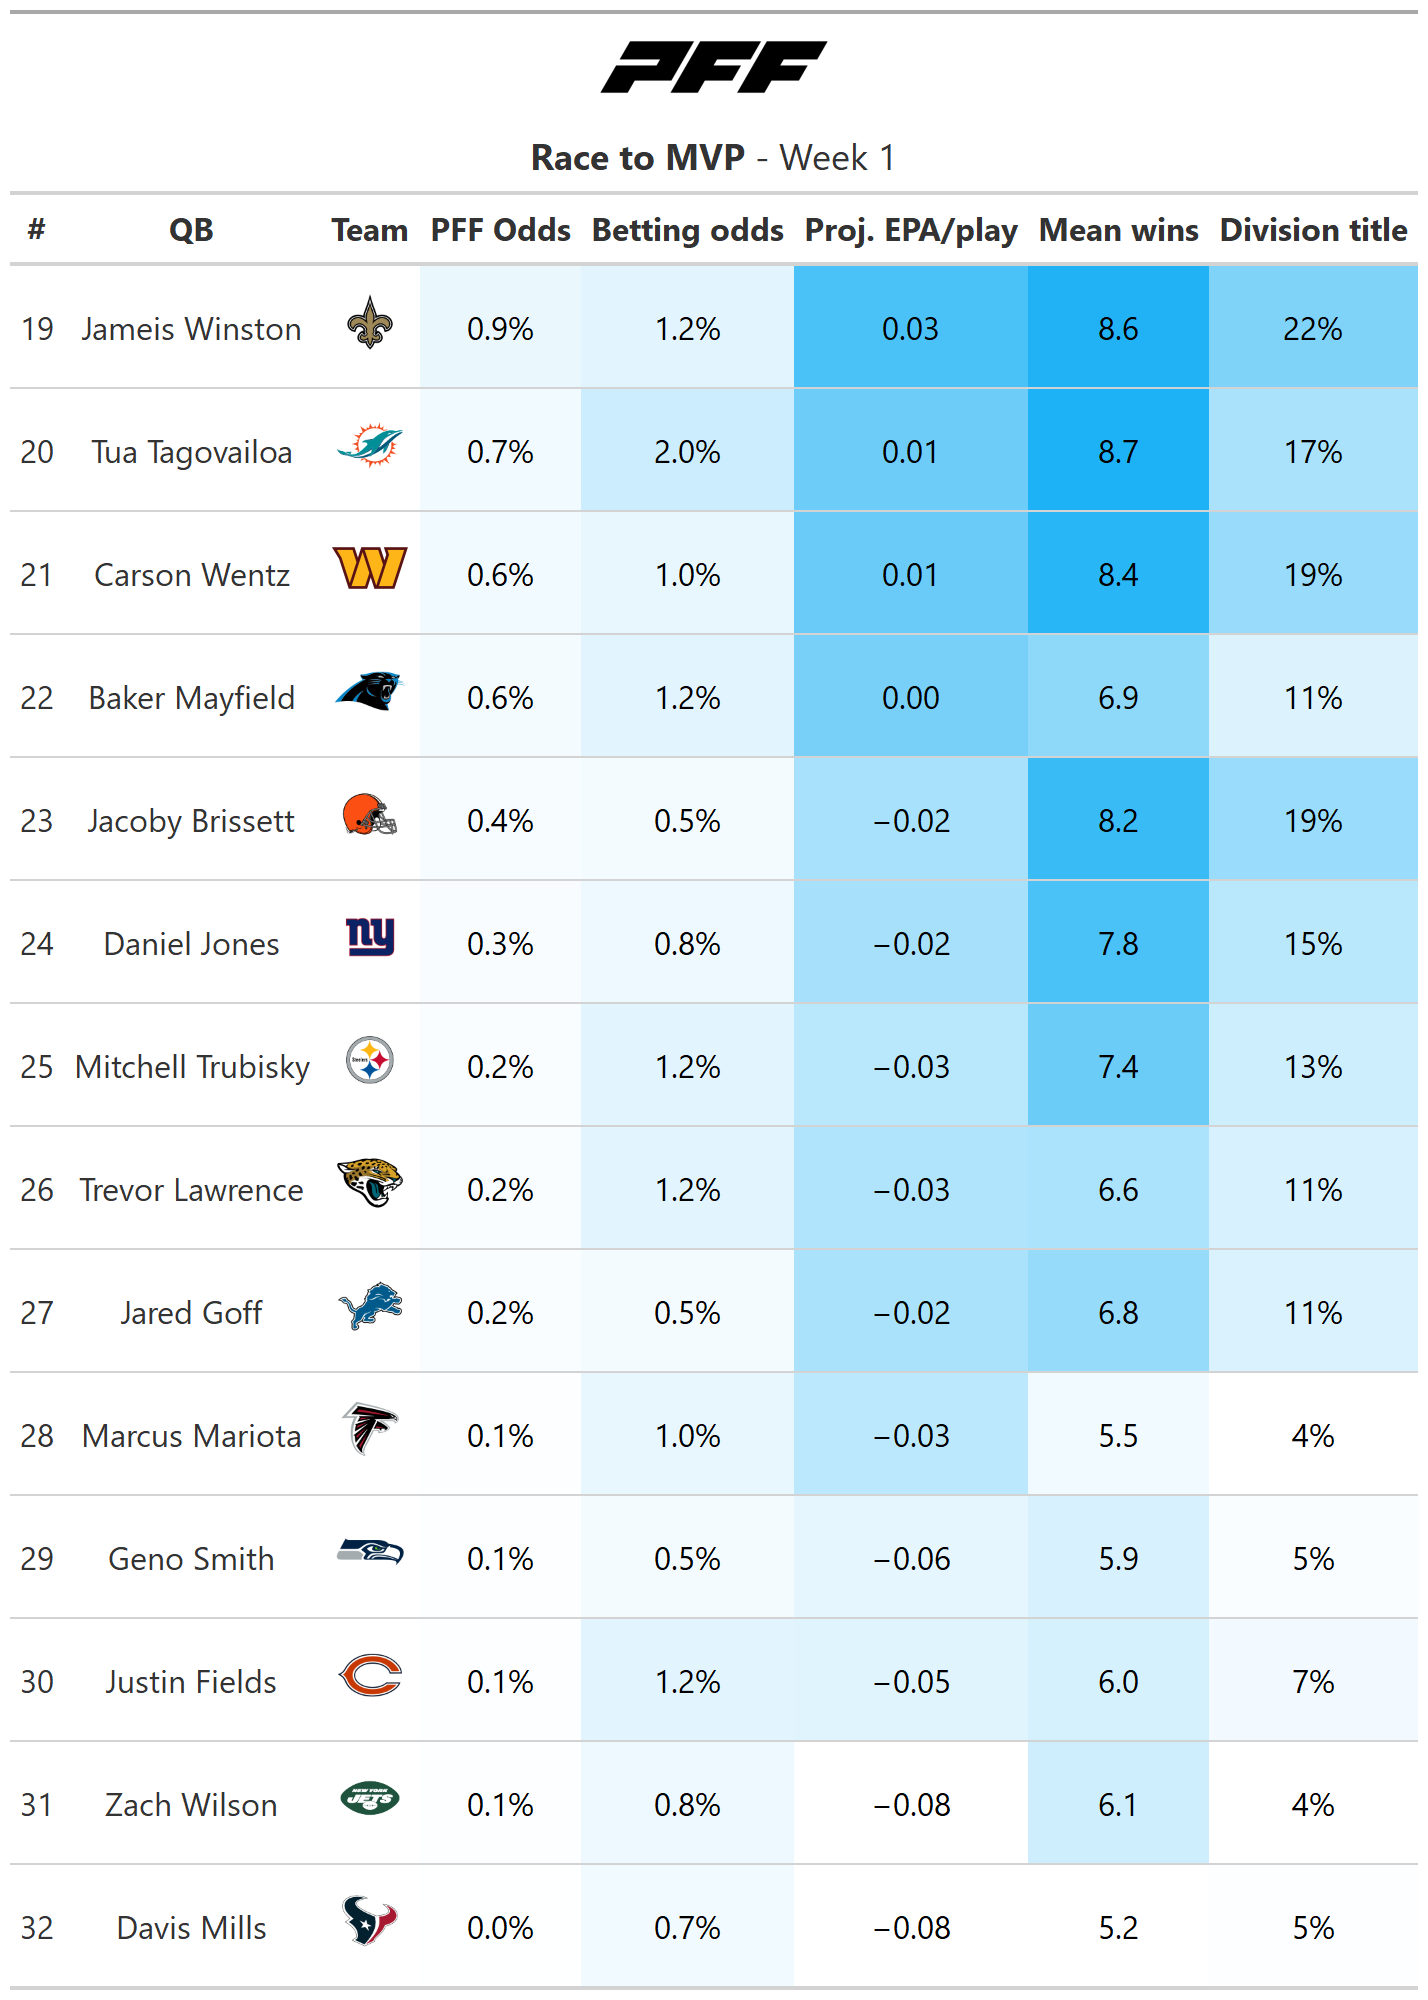
The 2022 MVP is one of the below players in 79% of our simulations. Note that PFF odds are odds we computed with our methodology as explained below, while the betting odds are the implied odds (vig not removed) from the current betting line at DraftKings. Since the vig is relatively high for the MVP market at this point of the season, most MVP bets are actually negative value at this point.
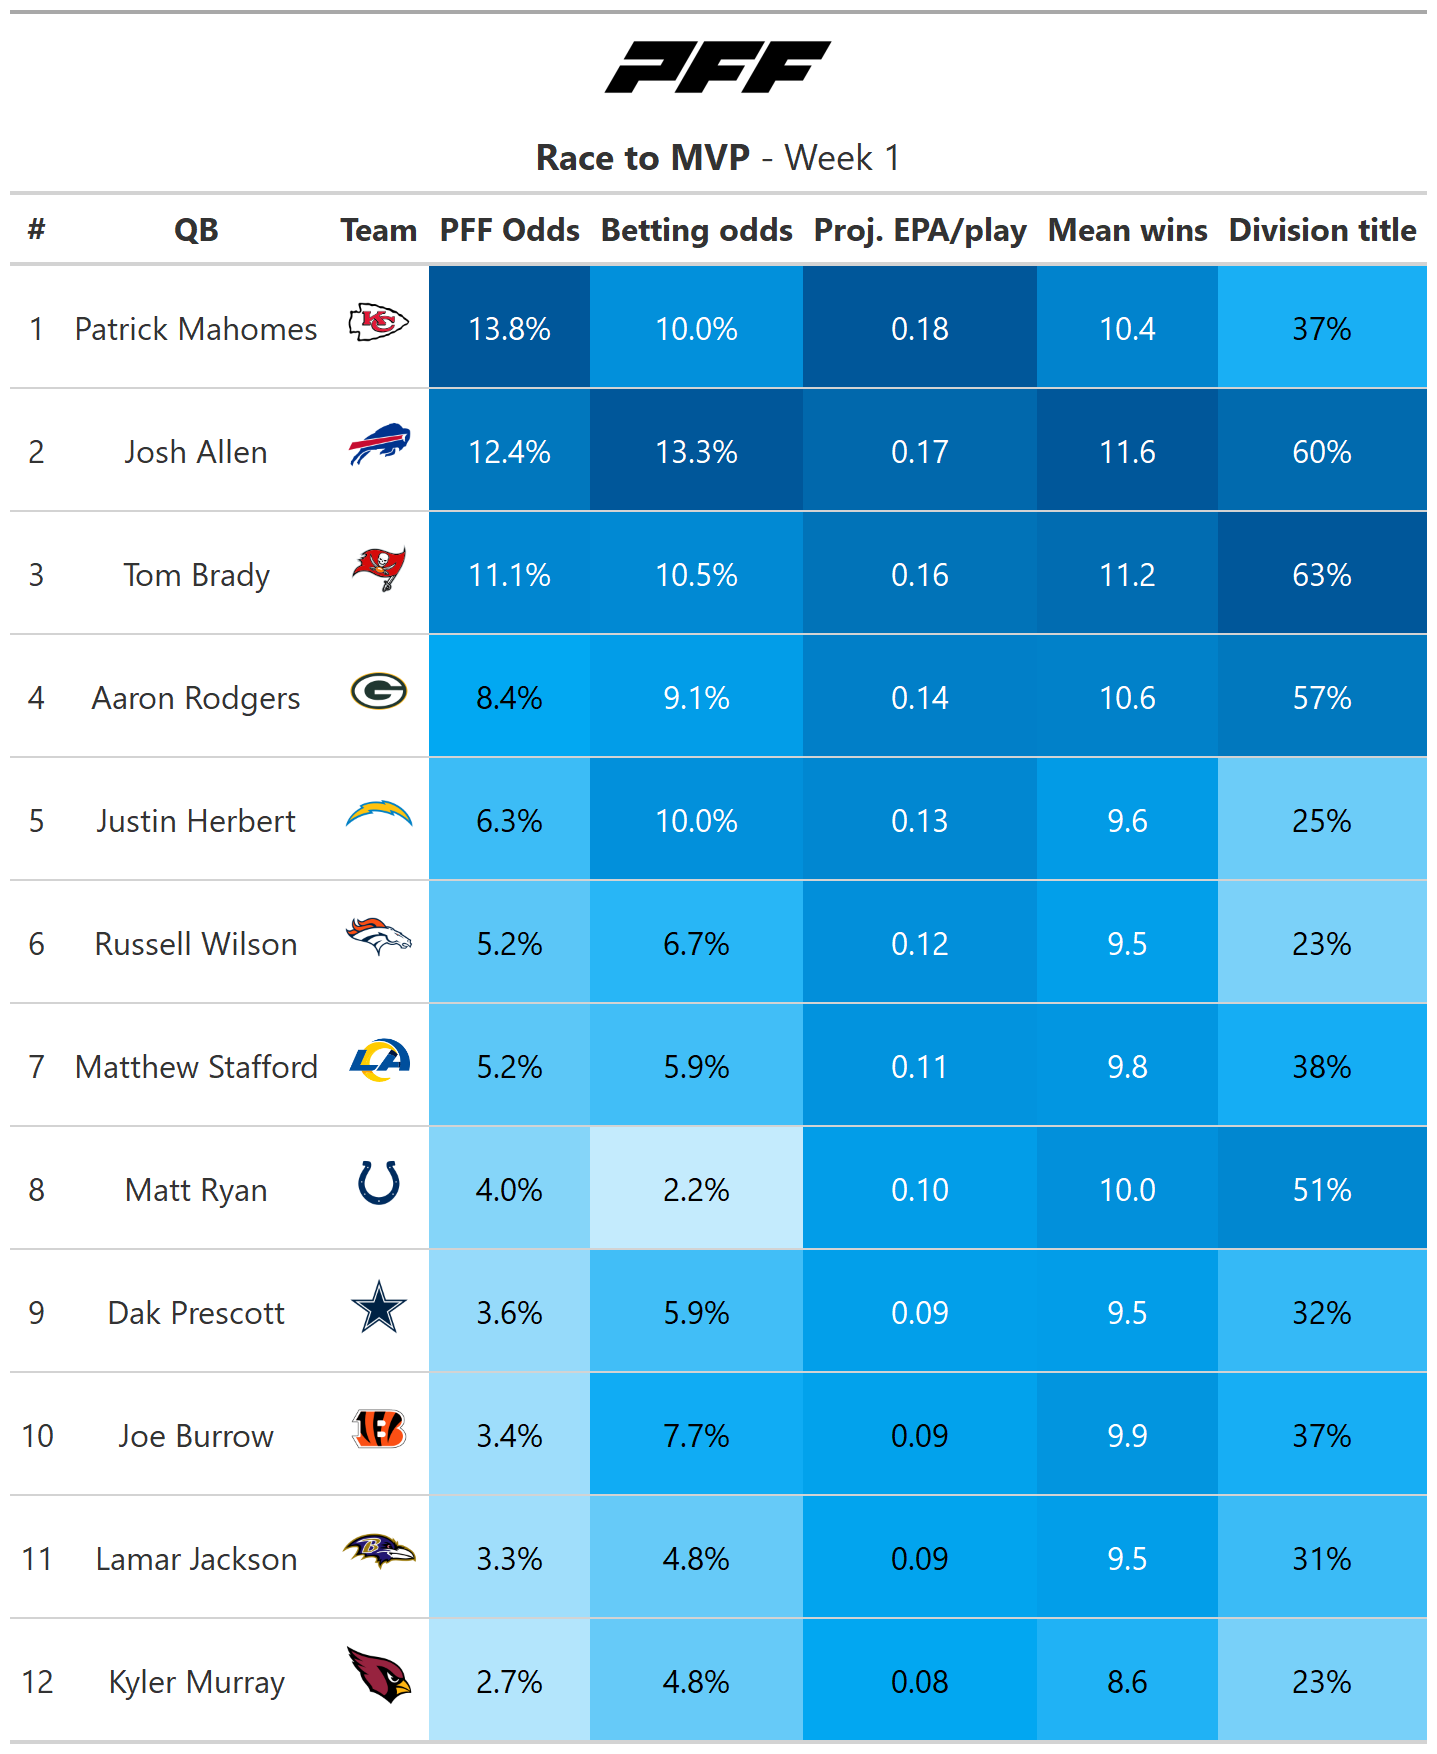
It’s 2022, and we might have reached the point at which Patrick Mahomes is underrated, given that he has only the tied-third best MVP odds right now.
We don't project Mahomes' Kansas City Chiefs to be the best team in the NFL this year, but the combination of Mahomes and Andy Reid is still expected to be the most efficient. Given the loss of wide receiver Tyreek Hill, much of the credit would need to be given to Mahomes in this case.
Given how much the media has compared Justin Herbert and Joe Burrow, it’s no surprise that these two are the most overpriced quarterbacks on the MVP market. They are both great quarterbacks, but we shouldn’t forget that there are other top passers in the league, and it won't be easy for these two players to win their respective divisions.
The interesting name in this table is Matt Ryan, a signal-caller who hasn't looked like an MVP in recent years. However, it’s notable that Ryan has the best supporting cast since 2016 or 2017; he is also projected to have a favorable schedule of opposing defenses and will have one of the easier roads toward a division title. With him, the overarching question is how to weigh the prospect of him simply being washed against the fact that we already know what he is capable of under perfect circumstances.
If everything breaks right
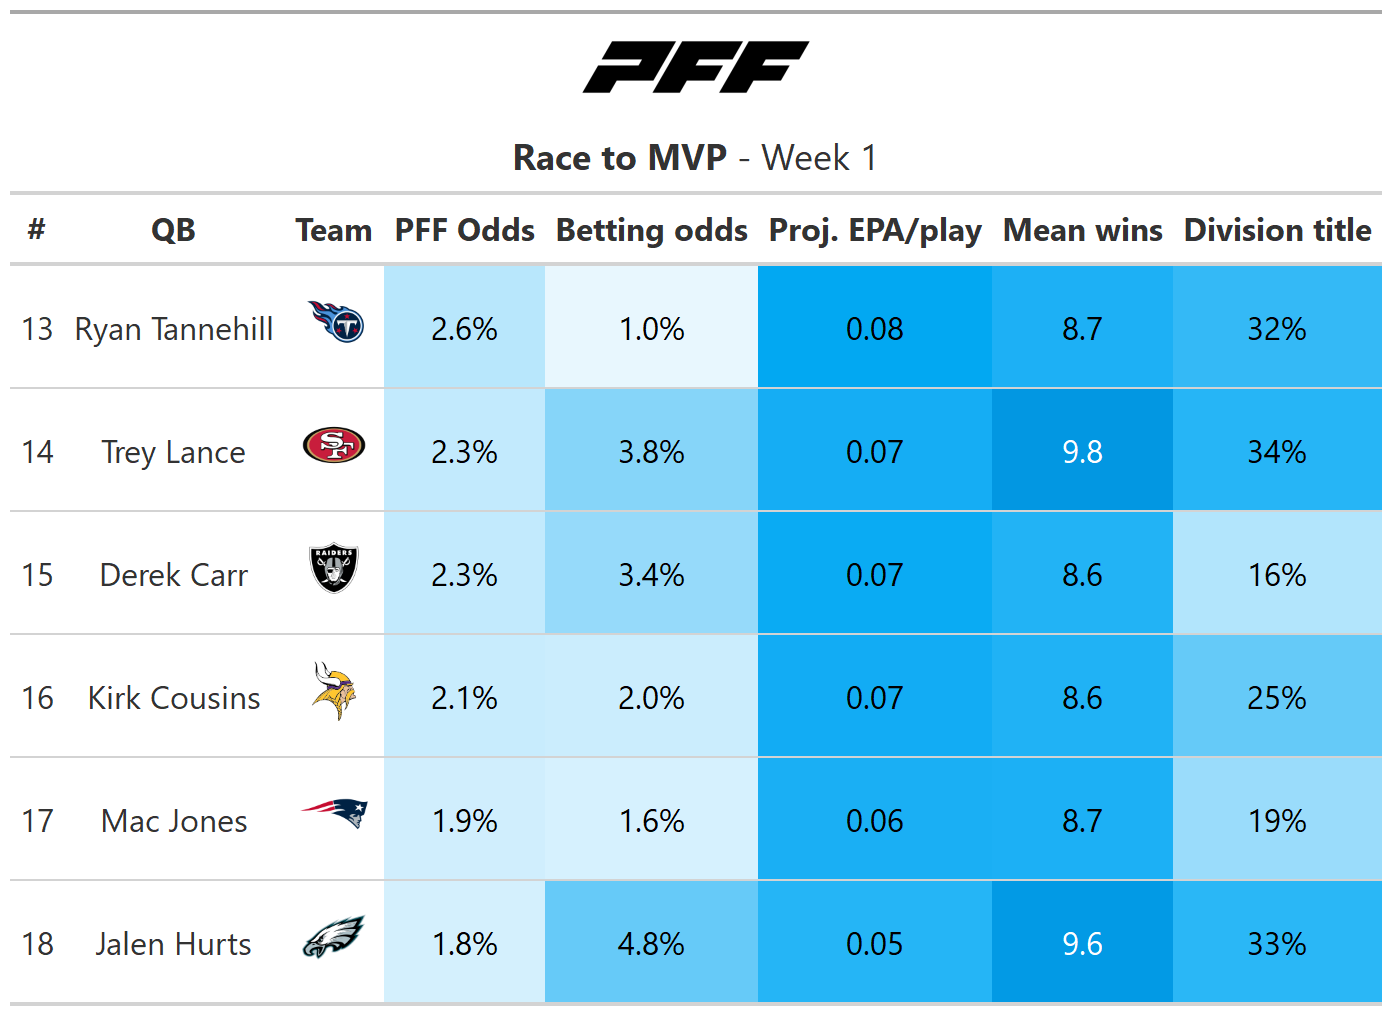
Every quarterback in this group is very unlikely to win the MVP Award. However, there is a 13% chance that everything breaks right for one of them, resulting in a surprise MVP Award like we almost observed three times in a row from 2017 through 2019, with Carson Wentz, Patrick Mahomes and Lamar Jackson, respectively.
So you’re telling me there's a chance?
All these quarterbacks are 100/1 or longer to win the award, but their collective odds still add up to 5%. The most promising candidates from this group should be Tua Tagovailoa, Jameis Winston and Trevor Lawrence.
THE METHODOLOGY
Two years ago, we created a model to forecast the MVP race by simulating each quarterback’s end-of-season stats to accurately predict the MVP voting.
Predicting the MVP is pretty straightforward if you know each quarterback’s passing efficiency and win-loss record. Unless there is a quarterback with an overwhelming number of wins (15 or more), the prize usually goes to the most efficient quarterback of the season. Over the last two seasons, this has been Aaron Rodgers.
By forecasting rather than looking at the current situation, we got things right in 2020 when the MVP race was largely between Russell Wilson, Patrick Mahomes and Aaron Rodgers. We also got things right last year when we had Rodgers as a repeat winner when the market still was all over Tom Brady.
Here is a quick reminder of our methodology:
We trained a model to predict the winner of the MVP Award based on only three regular-season parameters after Week 18:
- The number of wins and the league-wide rank
- Rank in the division
- Expected points added (EPA) per play and the league-wide rank
Since the model works with the regular-season stats in hindsight, we need to simulate the remaining games of the season so we can feed the model with the results. We utilize our weekly win total simulations and a Bayesian Updating method to have a prior for each quarterback's EPA per play in 2022.
The number of wins and the final division standing are obtained from our win totals simulations and win-total simulations derived from market odds. We will draw 10,000 simulations from each and thus simulate the season a total of 20,000 times.
During the season, we update our beliefs on all quarterbacks with Bayesian Updating, incorporating up-to-date EPA numbers and making adjustments based on the PFF passing grade, our accuracy charting and the quality of defense faced.
Using these updated beliefs, we can simulate each quarterback's EPA per play for the remainder of the season. The new part this year is that we connect the simulated EPA per play and the simulated game results of our simulation on the game level by updating the prior expected EPA numbers with the information of the game result. This also allows us to add dynamic updating to the simulation — the priors of a quarterback change throughout each simulation based on whether he plays well or poorly in this particular simulation.
Here is an example of how this process works. We use the Week 1 Las Vegas Raiders at Los Angeles Chargers game for illustration. Going into this game, the expected distribution of EPA per play for the two quarterbacks looks like this, with Justin Herbert having the higher prior.
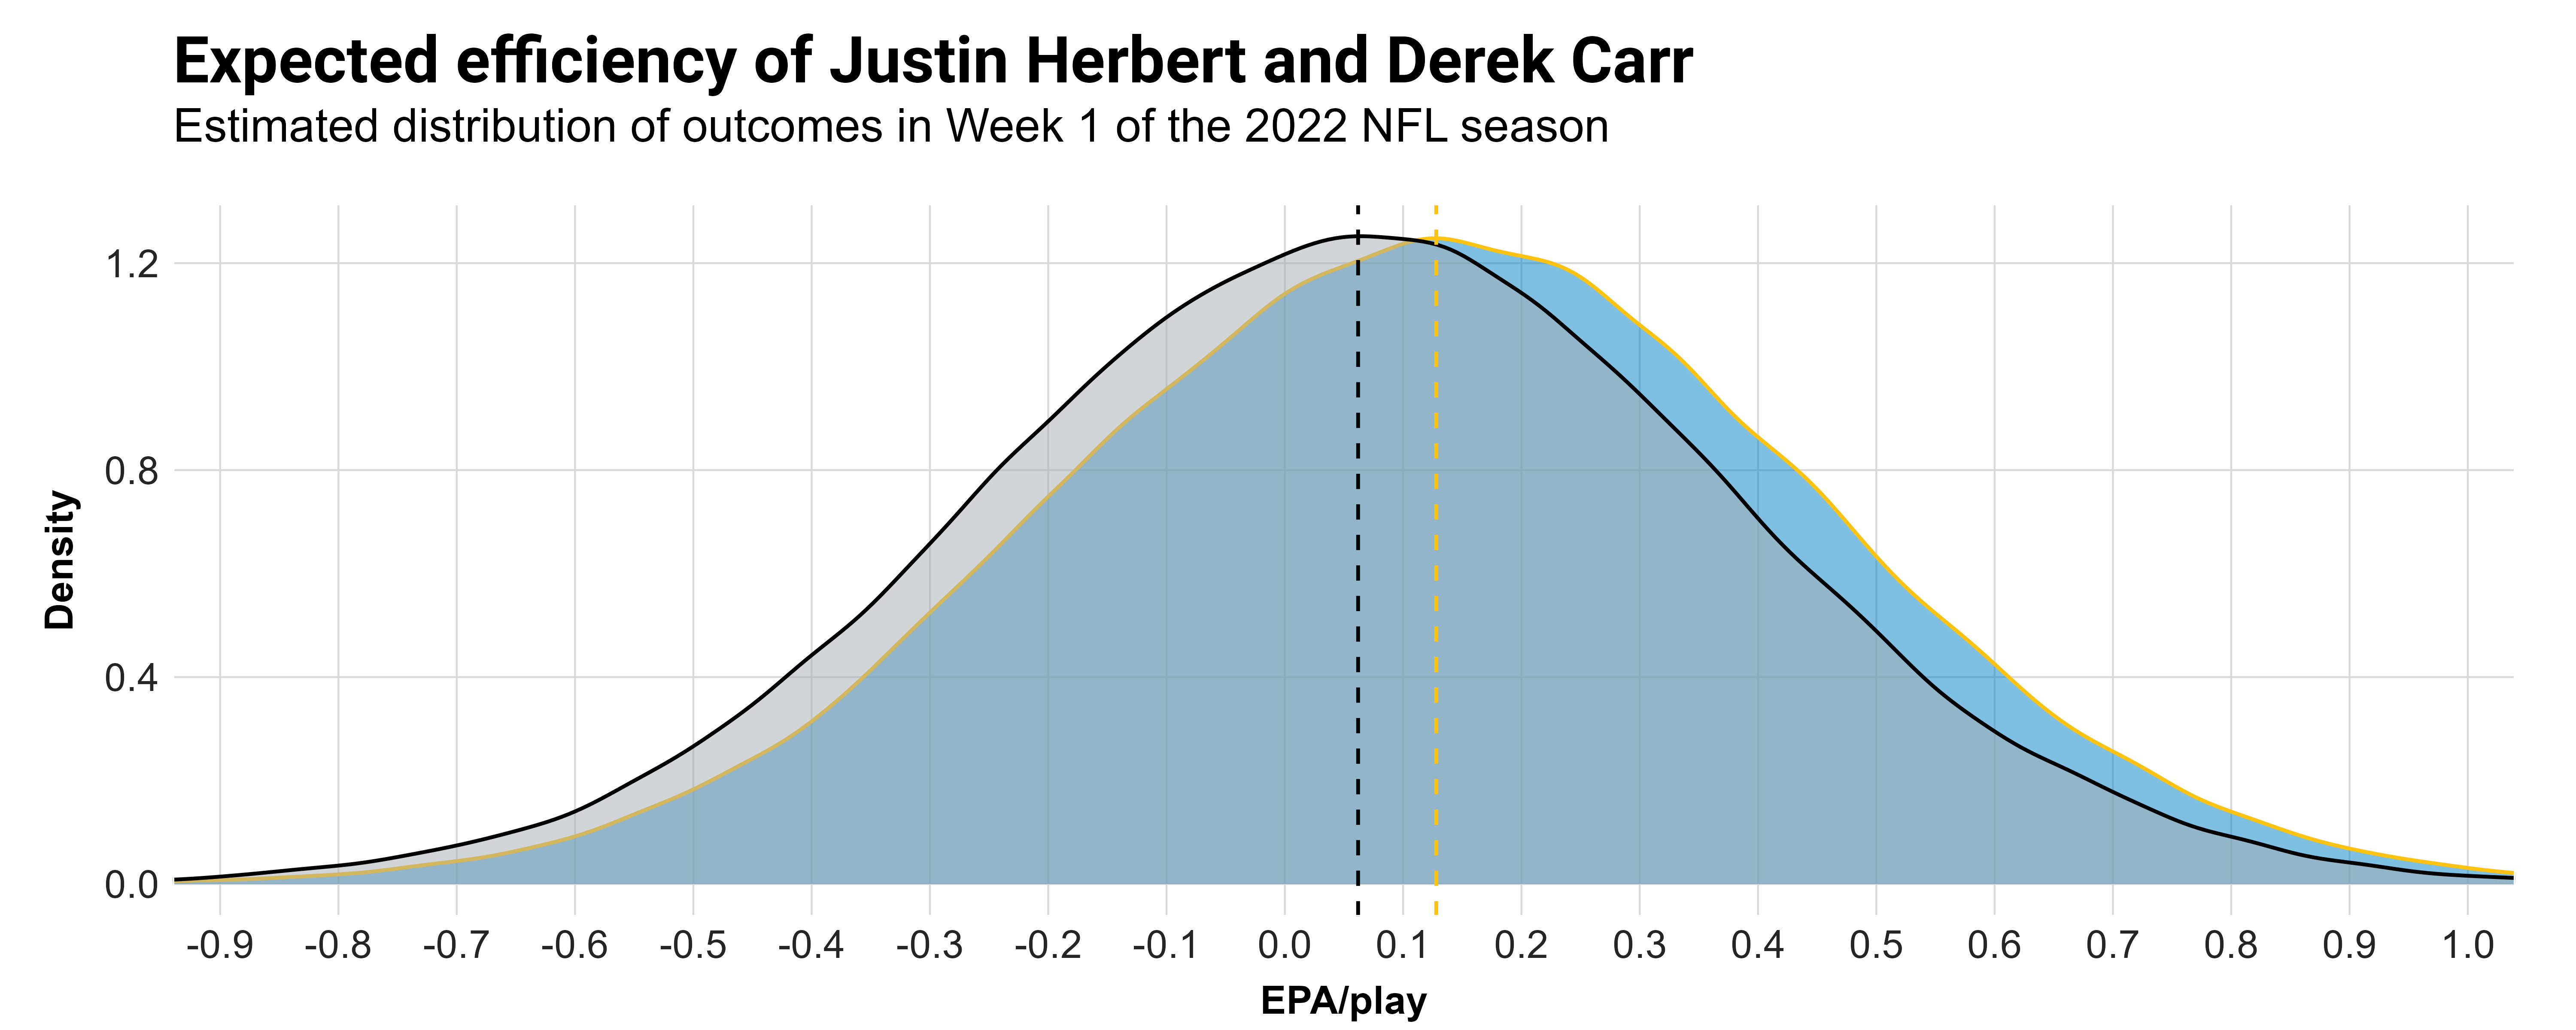
The distribution is pretty wide, as the NFL's game-by-game variance is reasonably high. However, if we know the game's final score, the distribution of outcomes that could have led to this score is narrower. For example, if the Chargers win by 14 in a particular simulation, this is how the distributions change:
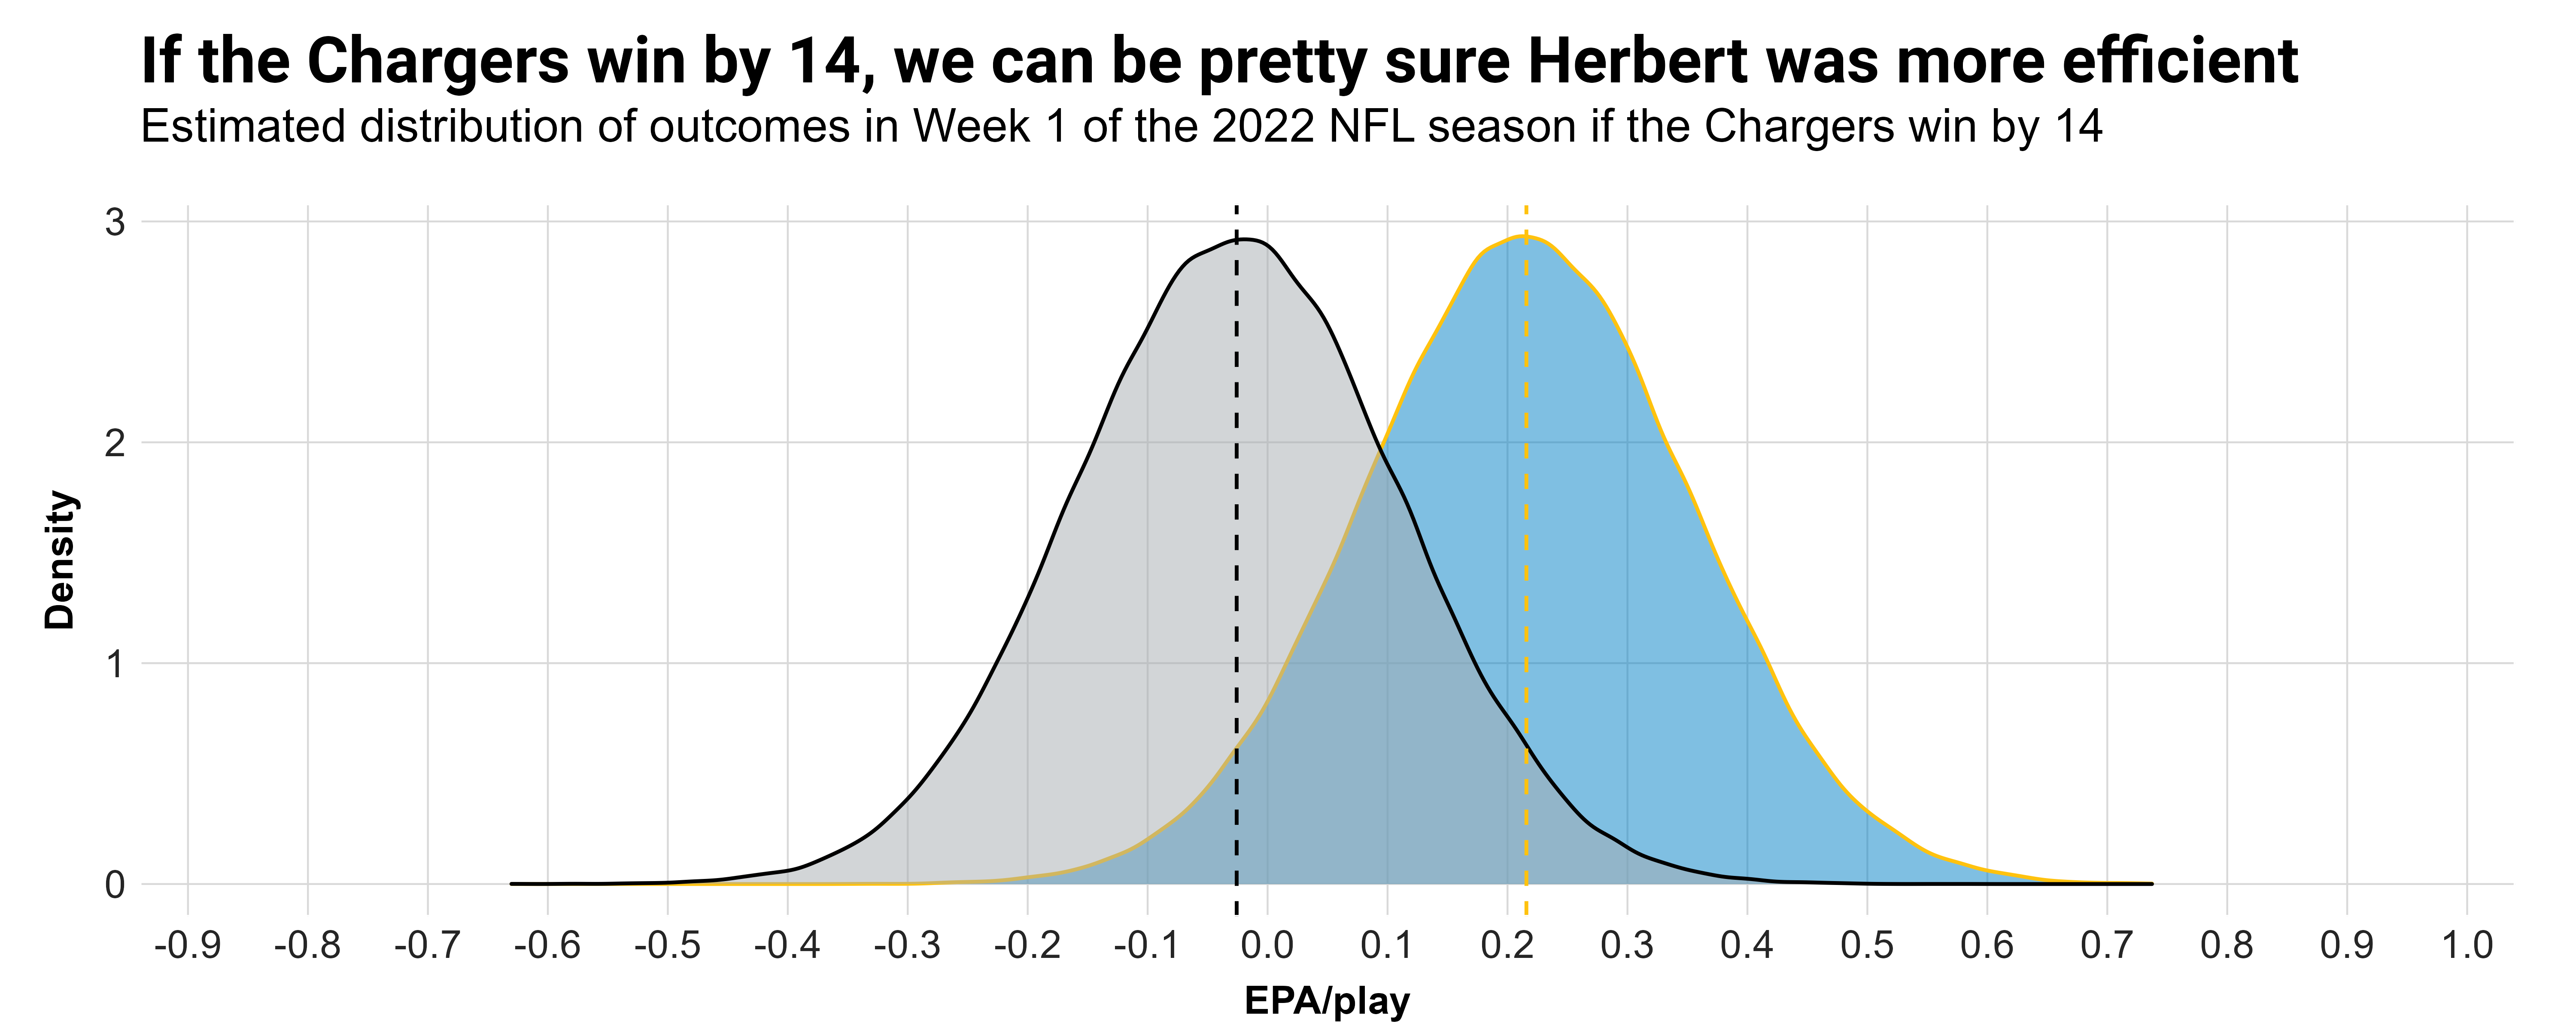
The standard deviations are much smaller, and Herbert’s mean went up while Derek Carr’s mean went down. That’s because a 14-point win would be higher than the expectation (the Chargers are currently favored by 3.5 points).
As another example, let’s say the Raiders win a close game by one point. This is what the estimated distribution of outcomes would look like (note that the scale of the x-axis is changed, but the standard deviation is still the same as in the previous plot):
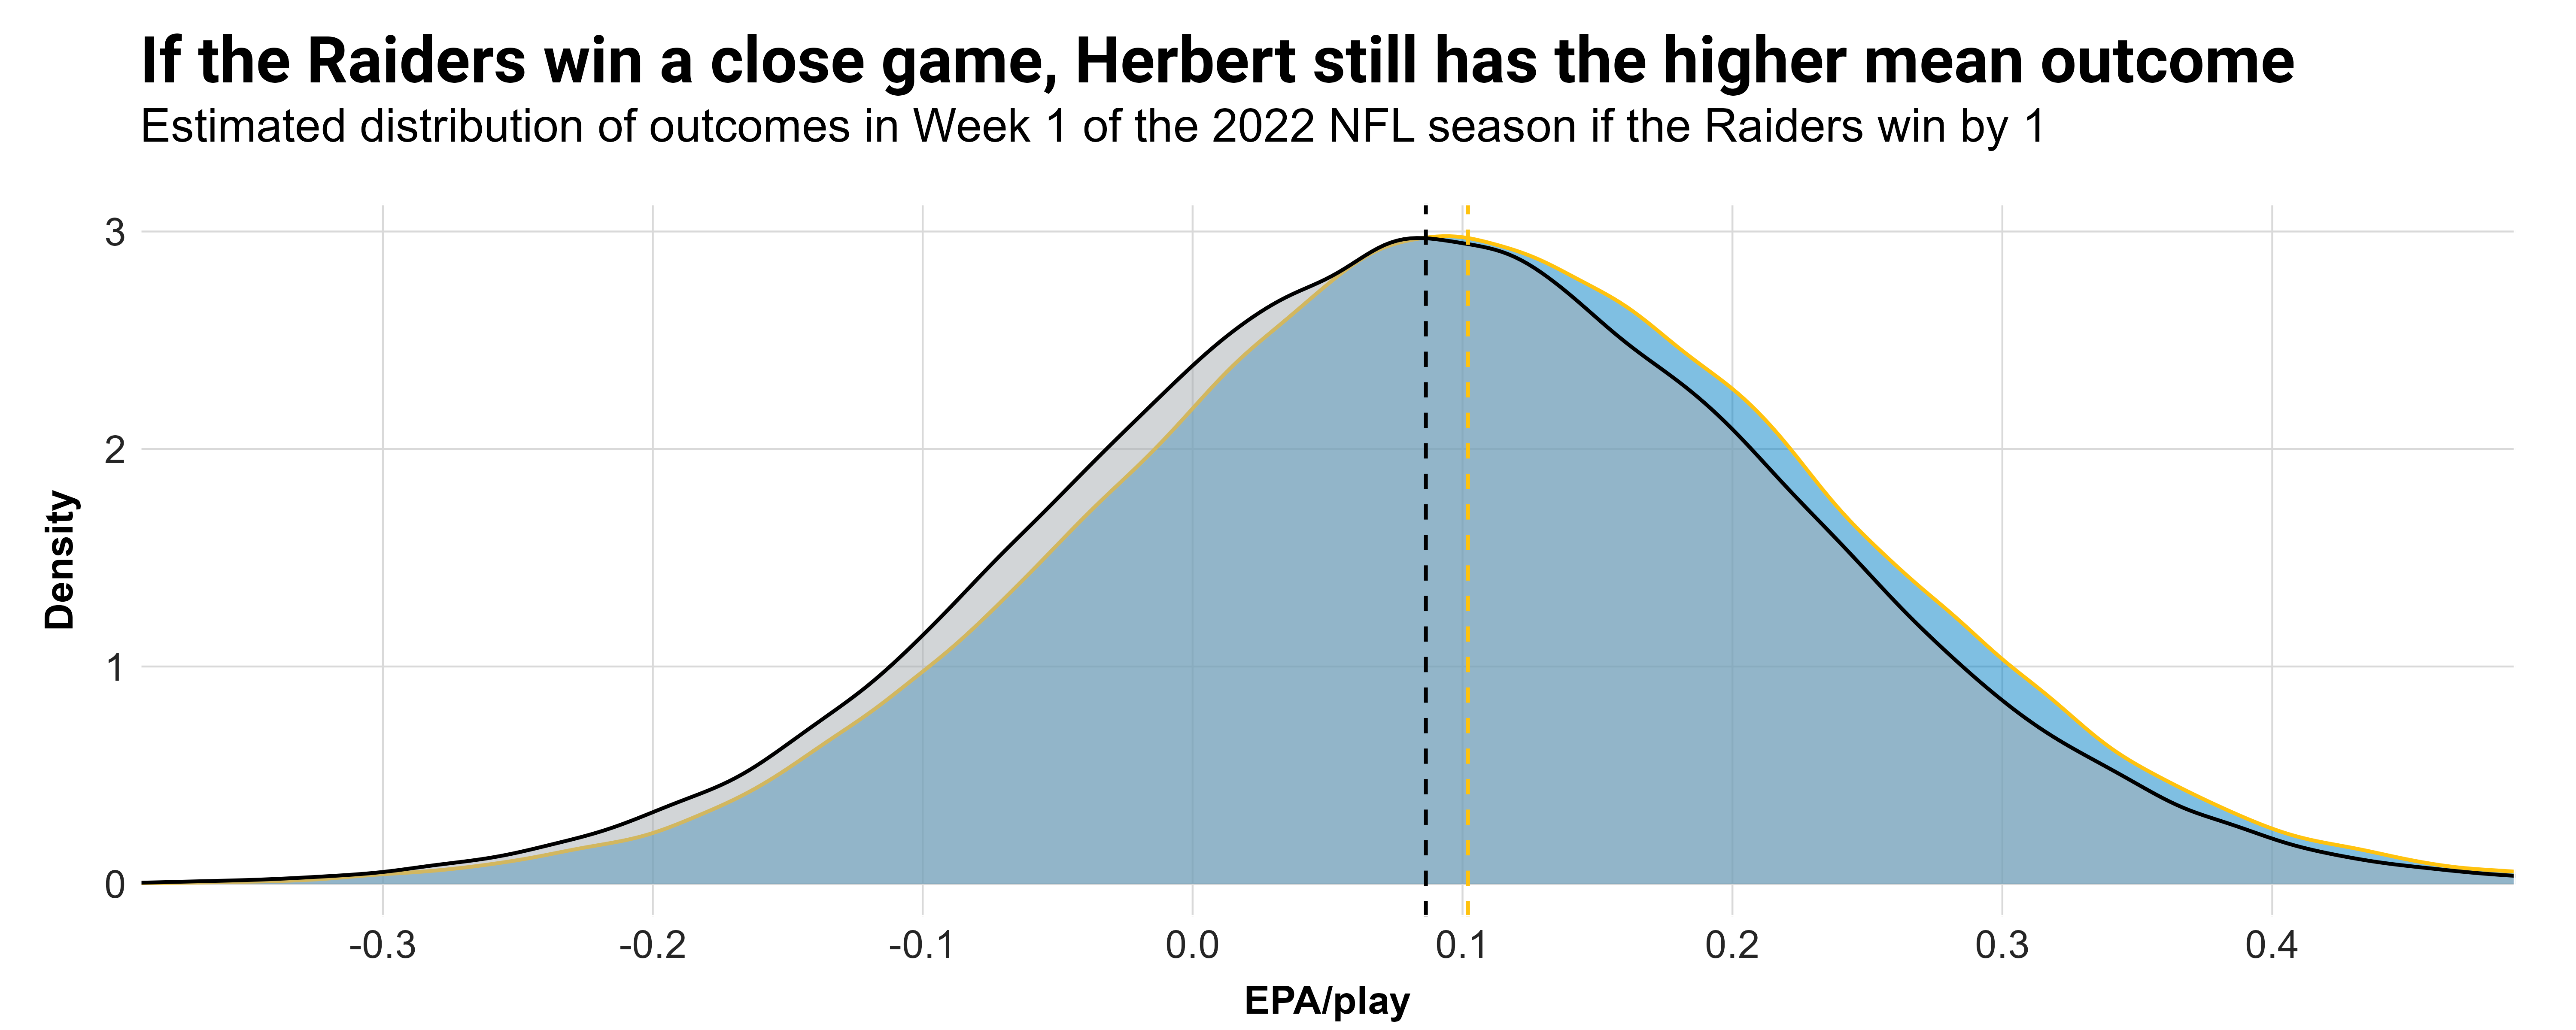
Herbert has the slightly higher mean despite losing at home, and that’s because his prior going into the game was higher. A close Raiders win narrows the gap between the two quarterbacks, but given the different priors of Herbert and Carr, it’s likely that win was caused by other things than passing efficiency — namely the running game, special teams or just noise.
If this seems counterintuitive, note that Herbert averaged 0.24 EPA per play in the Chargers’ heartbreaking Week 18 loss to the Raiders last season, while Carr averaged 0.04 EPA per play in the same game.
Ultimately, this means that the simulated EPA for a quarterback in a game or the season is a function of both his prior EPA and the expected success of his team using our simulations. This approach automatically accounts for the changes in quality of a quarterback’s supporting cast, something the EPA priors don’t do. If a quarterback has a much better supporting cast than he had in the last few years, his team is probably expected to be more successful than his EPA priors would imply, and our win-total simulations would pick that up. Through our approach and the dynamic updating, his prior will slightly increase every week throughout the simulations, and his end-of-season EPA per play will be better than his prior.
Our initial simulations suggest that Jalen Hurts, Trey Lance, Joe Burrow and Matt Ryan will end the season with better stats than their priors. Ryan Tannehill, Mac Jones and Patrick Mahomes are supposed to underachieve compared to their priors. Given Mahomes’ insanely high prior going into the season, he is still projected to lead the league in EPA per play this year, as we will see below.
Another advantage of this approach is that we can study what the typical MVP season looks like in terms of game-by-game efficiency and quarterback wins. The following chart shows how efficiently the MVP in each of our 20,000 simulations played from game to game.
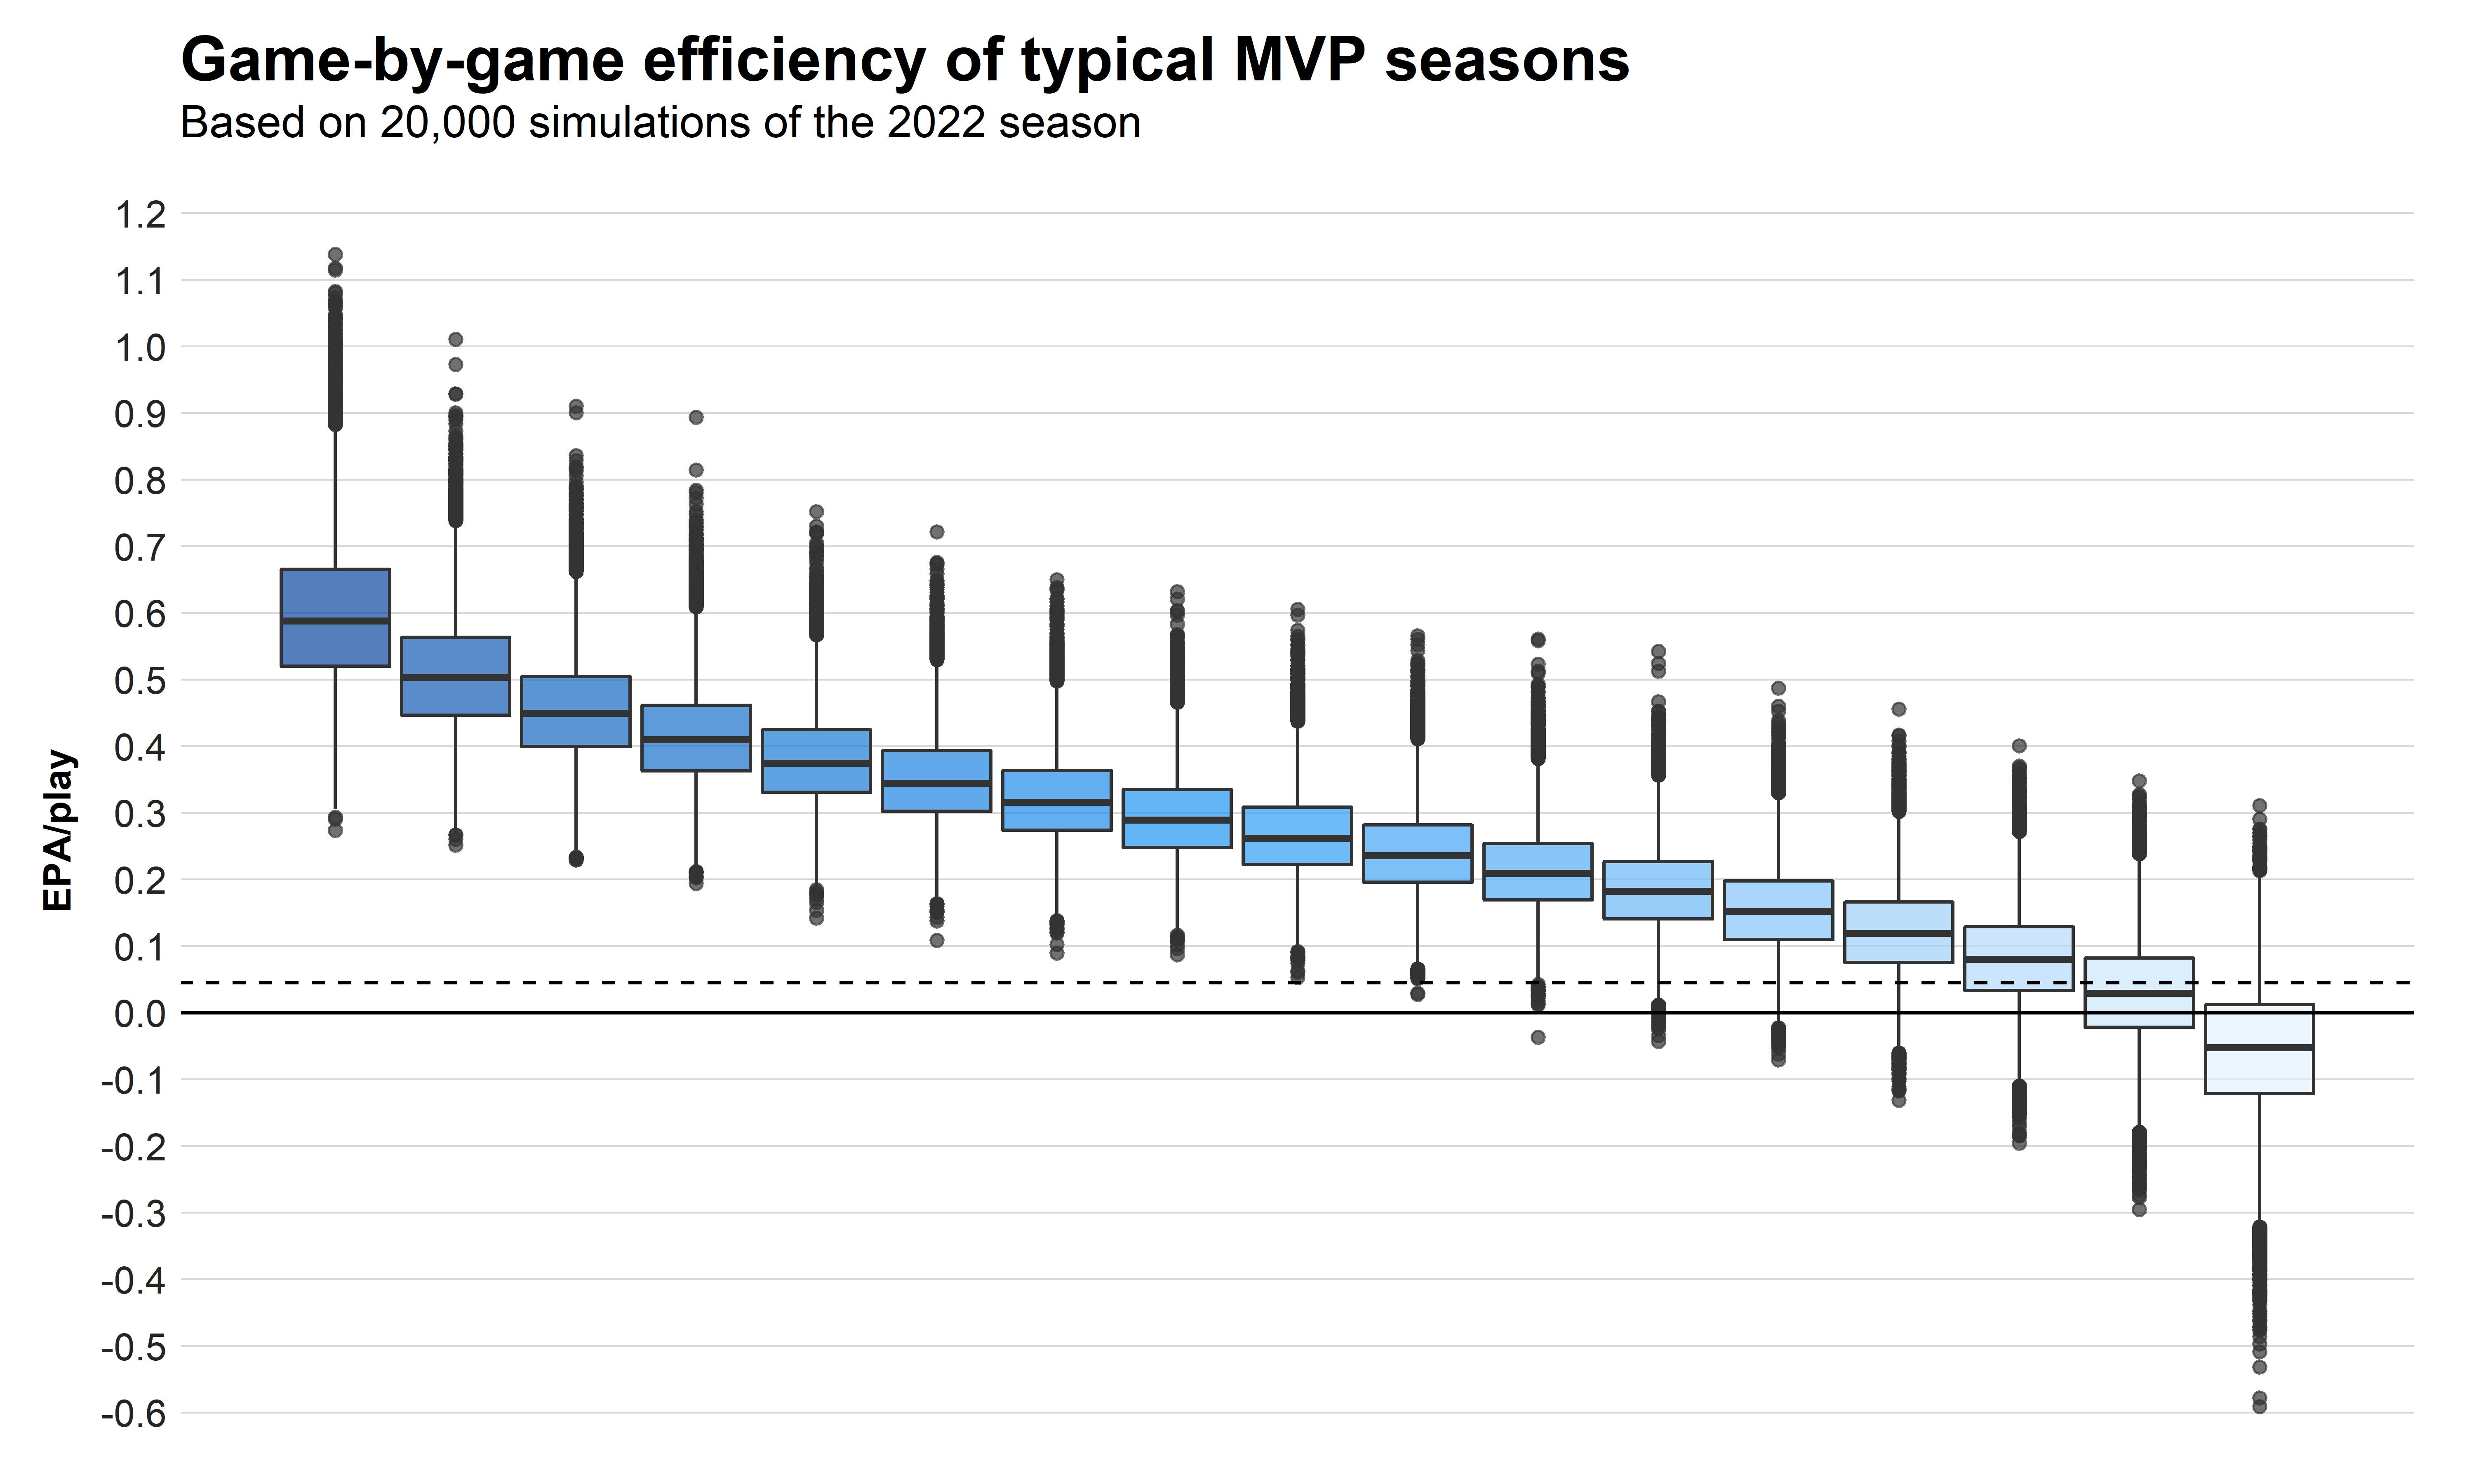
How to read this chart: The best game of the season for the MVP (first boxplot from the left) tends to come with a median of 0.58 EPA per play. On the right, we can see that even the MVP will eventually play one or two bad games in a season. This chart can help us estimate the likelihood of a non-QB MVP throughout the season. Right now, we are assuming a quarterback wins it 97% of the time, so the percentages of each quarterback add up to 97% (which might be a low estimate in today’s game).
Throughout the season, when the current front-runner is on track to have similar or even better game-by-game efficiencies than the median in this chart, we can safely move this number closer to 100%. However, if the front-runner were to have significantly worse efficiency numbers than the median MVP season, this would potentially open up the door for a player of another position to win the award.
One more notable thing is that no quarterback is expected to have an “MVP season” going into the season. Our highest projected quarterback, Patrick Mahomes, is projected to finish the season with 0.17 EPA per play. However, an average “MVP season” in our simulations comes with 0.25 EPA per play. There is a 50% chance that some starting quarterback will reach that threshold, but we don’t know which player will do it. We can only forecast who has the highest chance of doing it. This is very similar to win total projections going into the season, as the best teams are projected to win 11-12 games, even though there will almost certainly be some team that will win 13 or even more games.
Adjustments for defense
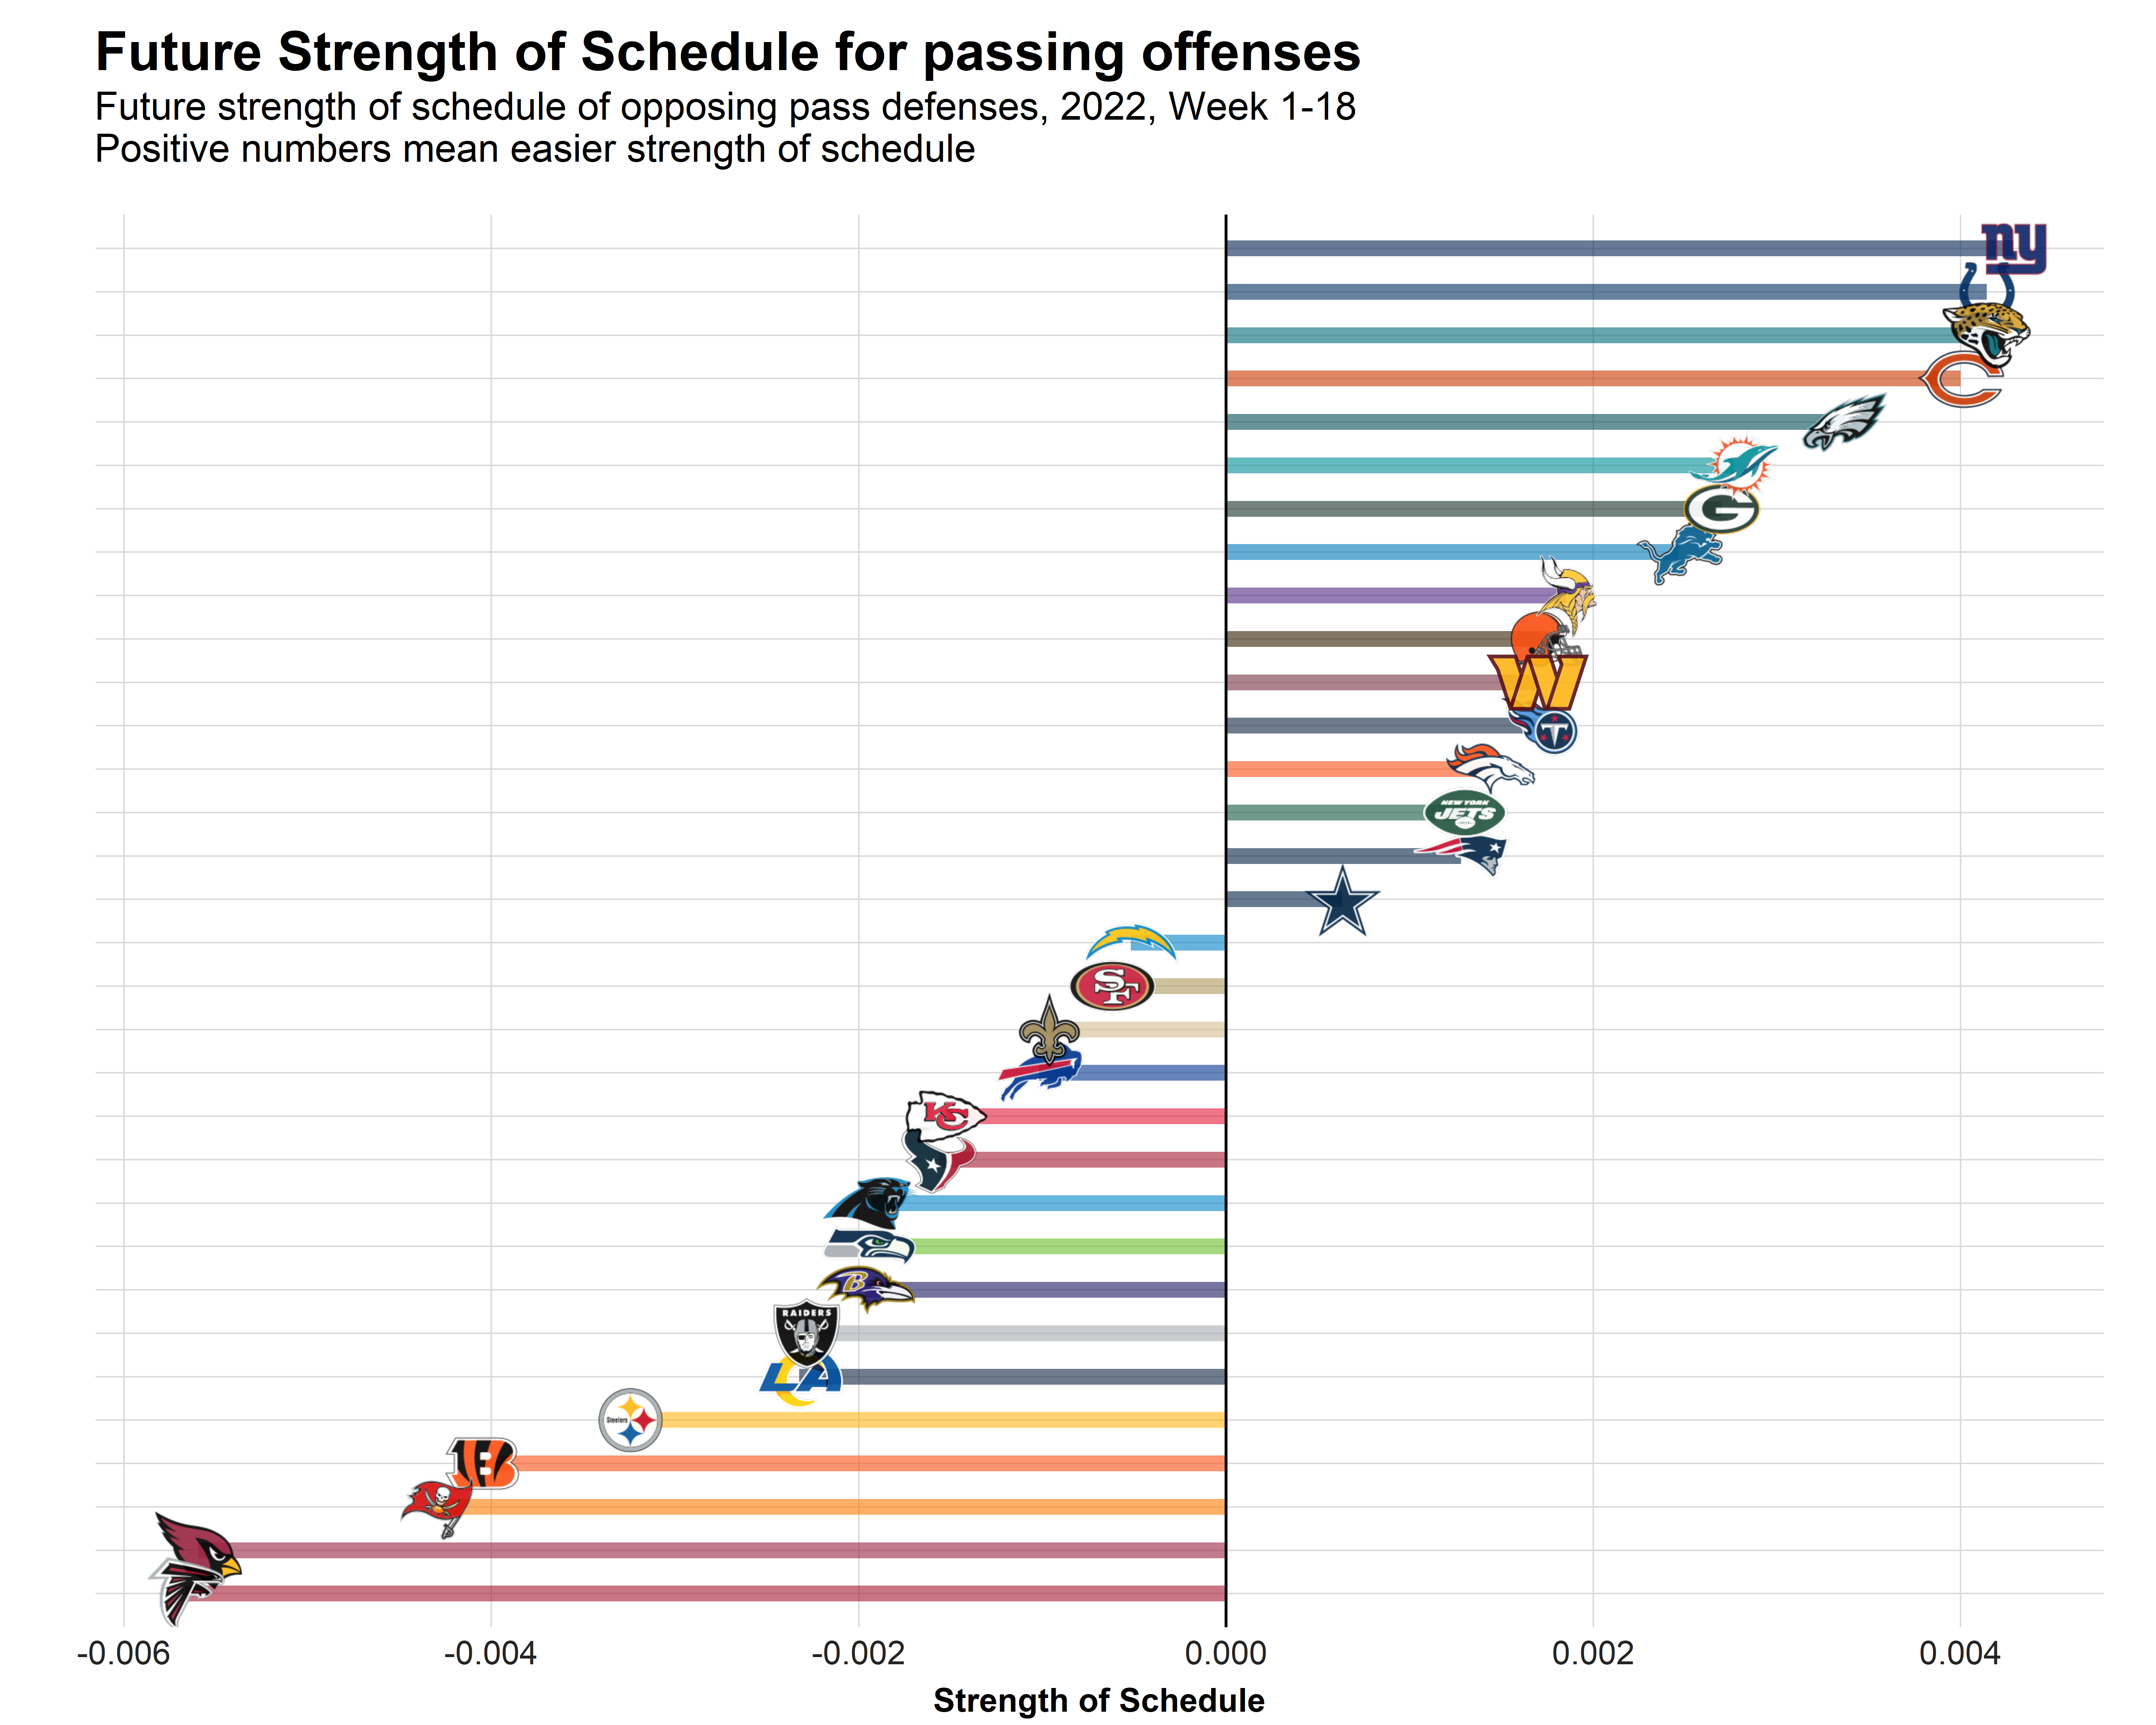
Just like last year, we will also adjust for defenses faced. We will update our pass-defense rankings throughout the season. As of now, we put them in tiers based on last year’s performance and roster strength (note that negative numbers indicate better defenses in this chart).
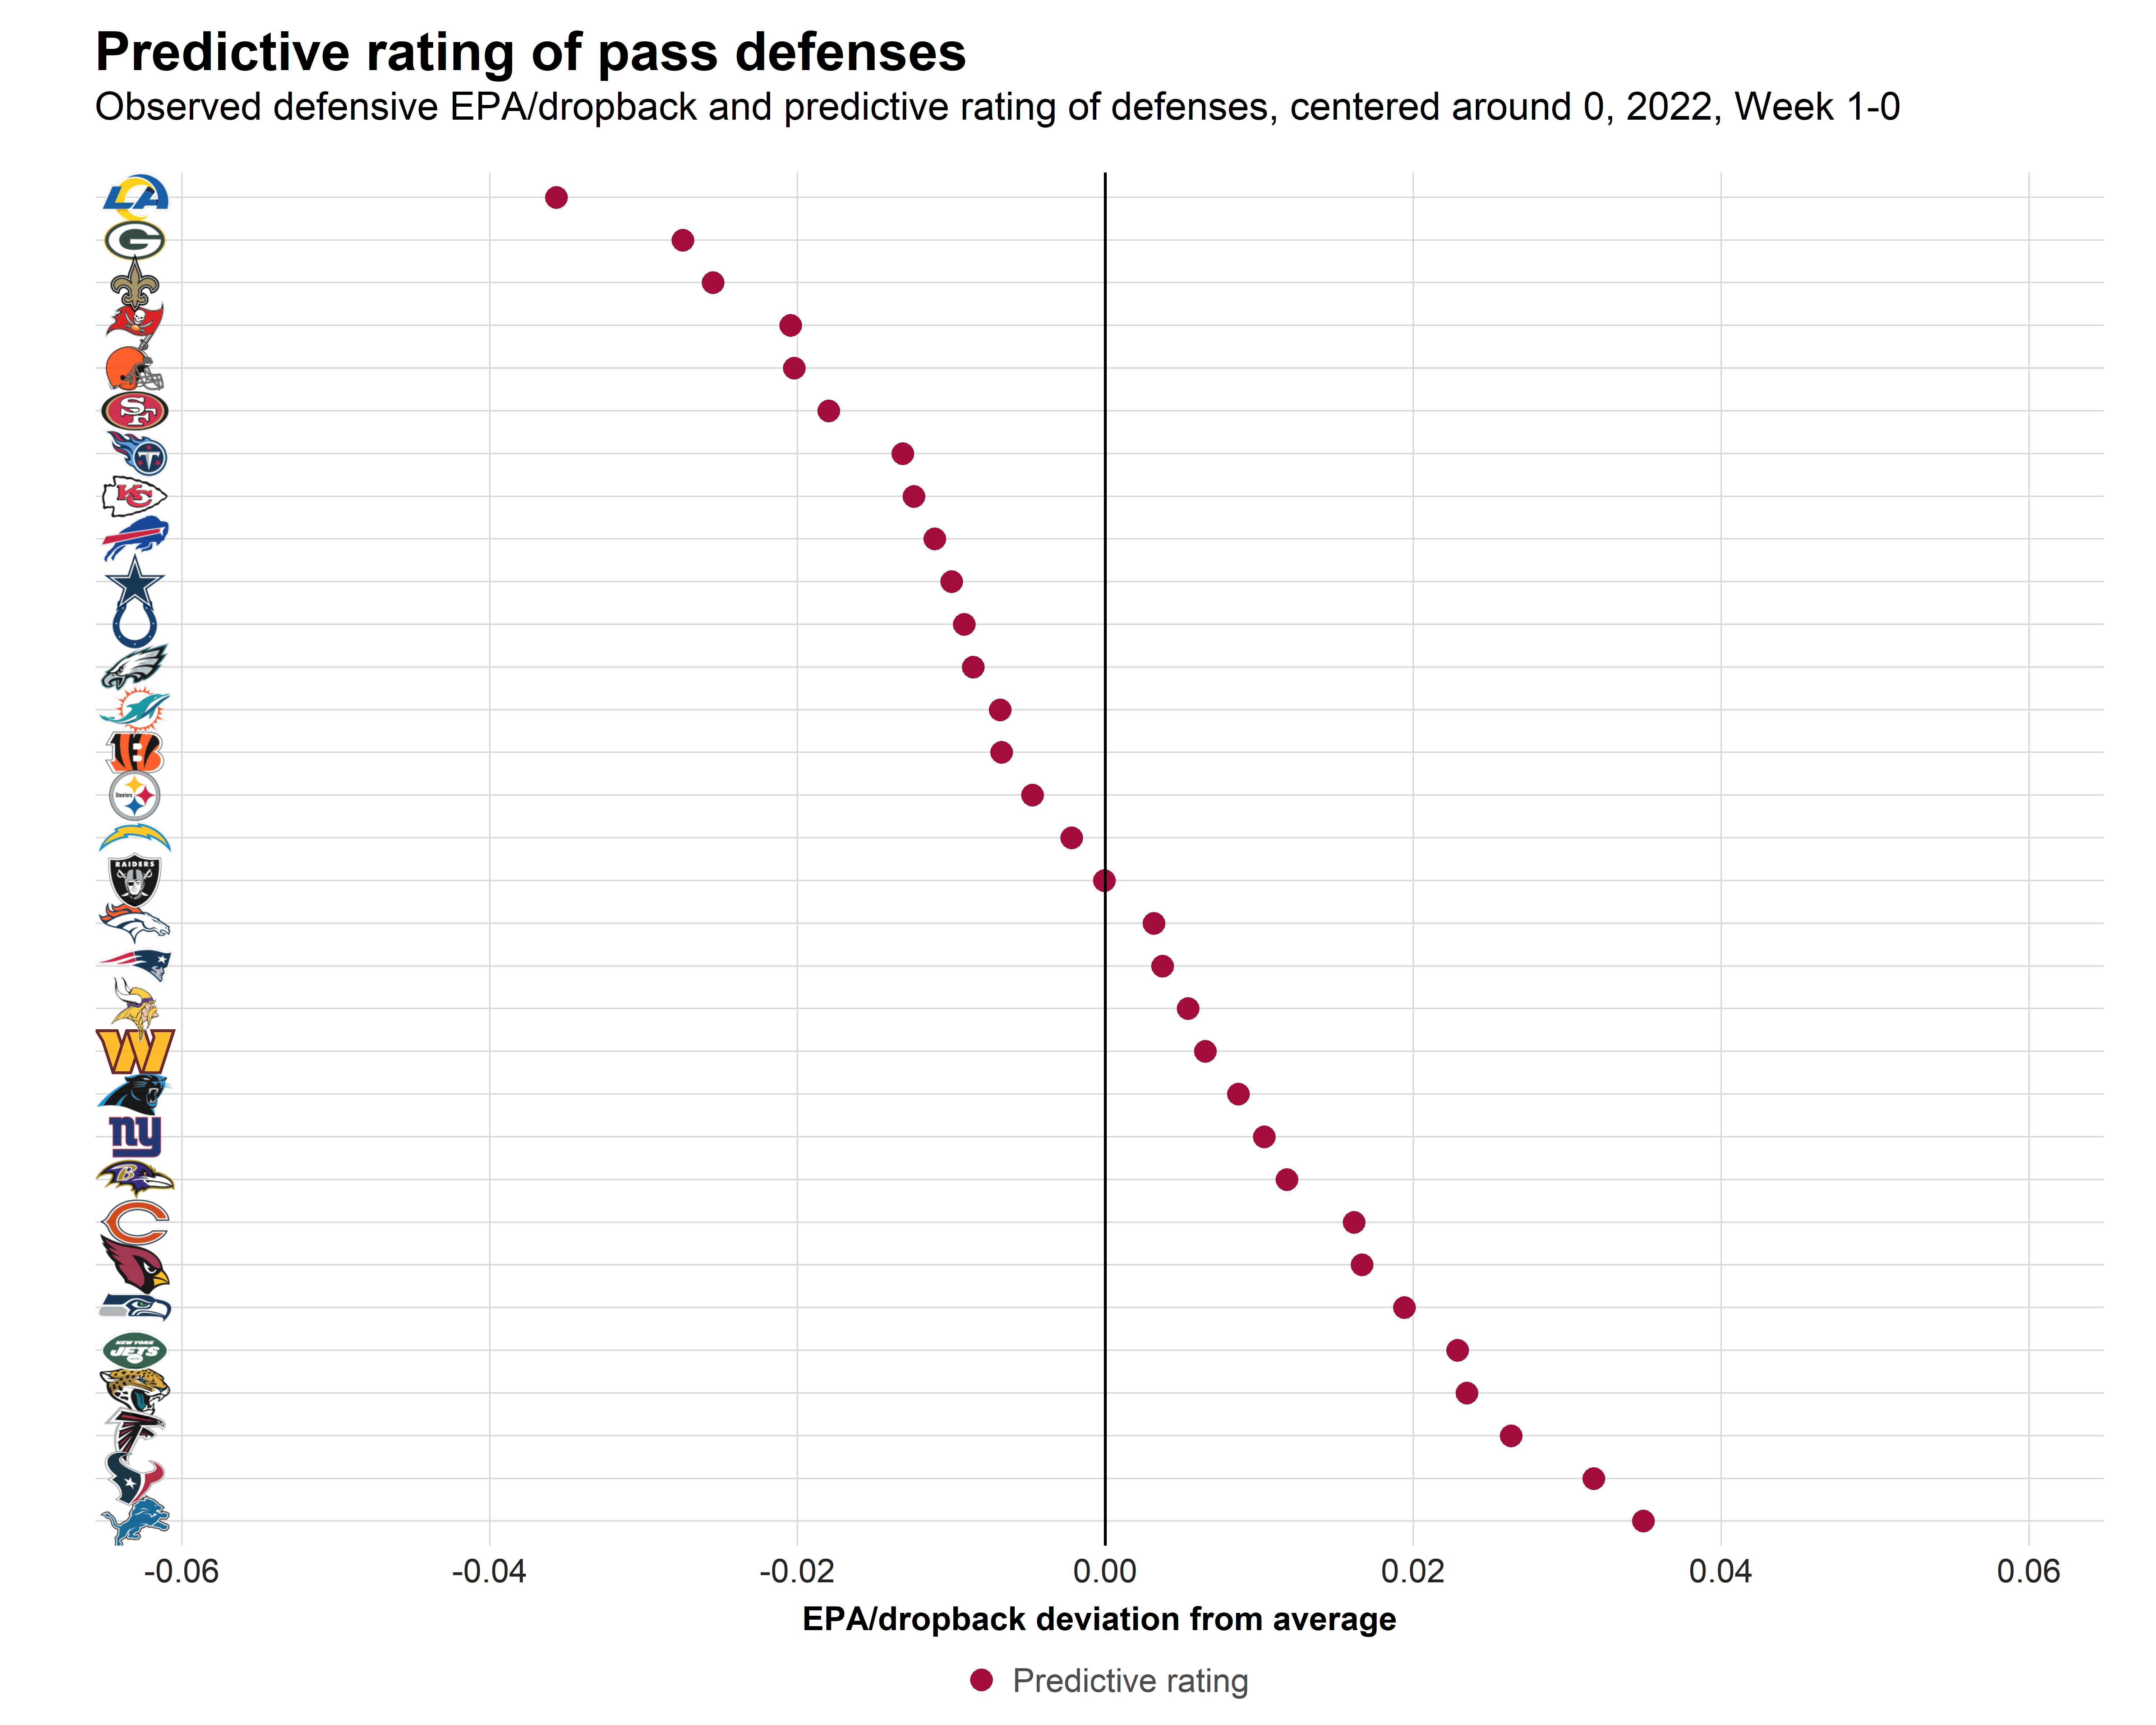
Here is the strength of schedule of opposing pass defenses for each team in the league: