• Charting: PFF’s all-coverage charting can provide an in-depth look at the average separation generated by different route concepts and additional factors that tie in.
• Who ranks best?: The San Francisco 49ers and Miami Dolphins‘ combinations of scheme and talent helped create significant separation on route concepts that typically don’t get open often .
• Draft and trade for yourself: Try PFF's Mock Draft Simulator — trade picks and players and mock for your favorite NFL team.
Estimated reading time: 9 minutes
Targeting pass-catchers in open windows correlates highly with an efficient passing attack. When targeting players in open instead of tight windows, offenses move the ball through the air more effectively, quarterbacks connect with their pass-catchers more often, and receivers have more room to work after the catch.
League Average Passing Efficiency by Degree of Separation | Since 2020
| Statistic | Targeting open windows | Targeting tight windows |
| EPA per dropback | 0.35 | -0.41 |
| Completion % | 77.9% | 24.5% |
| YAC per reception | 5.4 | 2.3 |
In the 2023 NFL regular season, all four teams that went on to make the conference championship ranked top-eight among all offenses in the highest percentage of pass attempts into open windows: 1) Kansas City Chiefs (88.7%), 2) Baltimore Ravens (85.7%), 5) Detroit Lions (85.0%) and 8) San Francisco 49ers (84.3%).
A number of factors influence whether or not a particular player gets open on each dropback, including scheme, play-calling, route concepts, mismatches and individual ability. We can examine the relationship between common route concepts and separation created on a league-wide and individual team/player level with PFF’s all coverage data.
PFF’s all-coverage charting tracks all routes run by players on any given play, not just the player that was targeted. Using this data, we can determine which route concepts players got open on most/least often and which created the highest/lowest quality of separation.
Using all coverage data to determine openness and quality of separation
All coverage charting tracks the separation created by all route runners involved on any given pass play. For this study, “open” qualifies as the receiver being outside of the arm’s length of a coverage defender (at least one step of separation) within the proper timing of the route. In the example below, Puka Nacua gets open by crossing the face of the defender at the top of his out route while Cooper Kupp is open on a drag route across the middle of the field with his coverage defender in off-man.
Additionally for this study, “not open” qualifies as the receiver being within arm’s length of a coverage defender in the proper timing of the route. The defender will typically be in a position to break up an accurate pass if thrown. In the example below, all three of the Carolina Panthers’ available route-runners are not open. D.J. Chark and Adam Thielen are blanketed downfield on corner and hitch routes while the linebacker is in a great position to take away the check-down option in the flat.
PFF grading (+2 to -1 scale) is also used to determine the quality of separation generated by players. Route runners receive a positive grade for creating separation against a defender in primary coverage within the proper timing of the route being run. The magnitude of the positive grade is dependent on route depth, down and distance, amount of separation created, and YAC (yards after the catch) potential. Route runners receive a neutral (zero) grade for doing what is expected of them on the play with separation being attributed to the play design or coverage scheme (ex. screens, decoy routes, defender lets up in coverage, busts, etc.). Lastly, route runners receive a negative grade for being unable to create separation or getting unwillingly taken out of their routes. The magnitude of the negative grade is dependent on route depth, number of defenders in primary coverage, and unforced errors (falling down, running the wrong route, etc.).
Excluding outliers, slant routes got open most often in 2023
A handful of route concepts jump out when measuring open rate (percentage of routes run charted as open), which are predominantly run at or behind the line of scrimmage. These include screens, quick outs, leaks off of jet/ghost motion and flares/pivots/outs from the backfield, all of which exceeded a 90% open rate in 2023. The vast majority of these routes also received neutral grading because the separation is primarily derived from the play design and reaction of the defense. Going forward in this study, these data outliers will be excluded from tables and summaries to quantify the quality of separation created on downfield route concepts that take longer to develop.
Now examining the data under these parameters, slant routes achieved the highest open rate across the NFL in 2023 while comeback routes generated the highest quality of separation.
Highest Open Rate and Avg. Separation Grade by Route Concept | 2023 Season
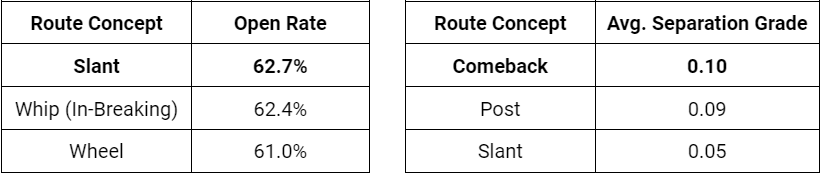
Slant routes stand out as the only concept to rank top-three in both measurements this past season, as receivers running slants regularly created significant separation. Slant routes are most commonly used with in-out pass concepts, often stacked with in-routes/digs to create segmented windows across the middle of the field and quick outs to clear out the flat or middle of the field, depending on the decision of the coverage defender.
Jacksonville Jaguars route-runners created separation on slant routes more effectively than any other team in the NFL last season. On slants, the Jaguars led the NFL with a 74% open rate and a 0.11 average separation grade. Additionally, only the team/route combination of Chiefs/out-breaking whip routes had a higher open rate (76%) than Jags/slant routes in 2023. On an individual level, T.J. Hockenson led all players (min. 25 slant routes run) with an 87% open rate and a 0.16 average separation grade on slant routes. Below, we can see Hockenson force the coverage defender to bite with an outside step at the top of the stem of his route, creating separation and an excellent YAC opportunity on this slant route.
Conversely, Atlanta Falcons route-runners struggled to get open on slants, ranking last in the NFL with a 45.1% open rate and a 0.0 average separation grade. The Falcons' -17.6 % difference to the league-average open rate on slants was the largest negative difference between any team/route combination and the respective average. Drake London, in particular, struggled on slants, ranking last among qualified players with a 34% open rate.
Man and press coverage are significant factors in separation by route
Defensive coverage schemes play a big factor in separation created by route runners with certain route concepts much more affected than others. Against man coverage, slant routes remain the best at getting receivers open, ranking first with a 63.9% open rate, but there isn’t a significant change from their overall open rate against all coverages (+1.2%). The biggest positive difference against man coverage is reflected in corner routes with a 27.5% overall open rate increasing to 43.5% (+16.0%) against man coverage, which impacts hitch routes by the largest negative factor with a 7.8% decrease in open rate from 54.6% to 46.8%.
Against zone coverage, in-breaking whip routes ranked first with a 65.6% open rate. However, when comparing the difference to the overall open rate, zone coverage is a less significant factor than man coverage. On average, route concepts saw a difference of (+/-) 5.7% against man coverage compared to (+/-) 2.4% against zone coverage.
Biggest Differences Between Man and Zone Open Rate (min. 50 routes) | 2023 Season
| Route Concept | Man Open Rate | Zone Open Rate | Difference |
| Hitch | 46.8% | 57.3% | +10.4% |
| Whip (In-Breaking) | 57.7% | 65.6% | +7.9% |
| Seam | 42.4% | 26.9% | -15.6% |
| Corner | 43.5% | 22.1% | -21.4% |
Looking at the differences when facing man and zone coverage, players running hitch routes benefitted the most against zone coverage while players running corner routes benefitted the most against man coverage. The increase in open rate on corner routes against man coverage was also reflected in how often those players were targeted. Players running corner routes against man coverage were targeted on 18.4% of snaps compared to 10.8% against zone coverage.
Press coverage also has a tangible impact on the ability to generate separation. In 2023, players got open on only one-third of routes run against press coverage (33.2%); that number jumps to 62.2% when not facing press. There were only a handful of routes to generate a positive average separation grade against press coverage in 2023: seam, post, and crossing routes. All other concepts averaged out to a neutral or negative grade. In the example below, CeeDee Lamb fights through contact by two different defenders, but the hole defender doesn’t carry him up the seam, creating an open window for Lamb in the deep middle of the field against Cover 2.
Which team/player route combinations created separation above/below average?
On a team and individual level, we can determine which routes players had above-average and below-average success in getting open. Out of 15 total route concepts, seam routes (29.7%) and go routes (26.1%) both fell in the bottom five in overall open rate in 2023 as two of the more difficult route concepts to consistently get open on. However, the 49ers and Miami Dolphins had a lot more success than the rest of the NFL when utilizing these concepts.
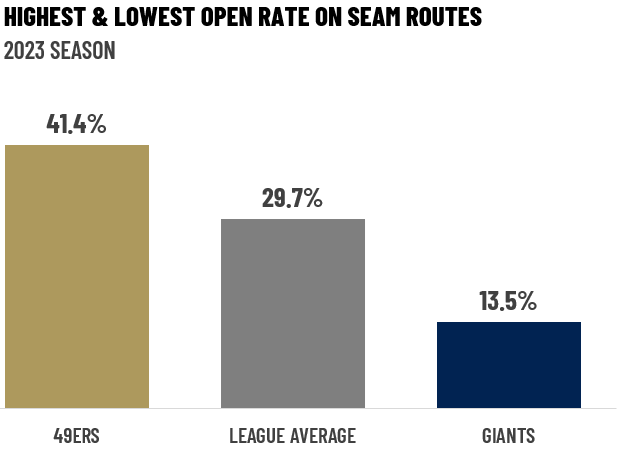
The 49ers led the NFL with a 41.4% open rate on seam routes, and their 11.7% increase over the league average was the eighth-largest positive difference of any team/route combination in the NFL. These numbers are further reflected in their efficiency when targeting seam routes, ranking second in the NFL with a 79% success rate on those pass attempts. On the opposite end of the spectrum, the Giants struggled to generate separation on seam routes, only getting open 13.5% of the time (16.2% below average). The New York Giants‘ 13.5% open rate on seam routes was the lowest-performing team/route combination in 2023.
With a 42.1% open rate, the Dolphins were the NFL’s best team at getting open on go routes and star wideout Tyreek Hill was a big reason why. When compiling the largest individual differences in open rate compared to the league average, he was the only player to appear multiple times in the top 10. His 24.5% open rate above average on crossing routes ranked sixth highest and his 22.5% open rate above average on go routes ranked 10th highest. On go routes, Hill earned the highest average separation grade of any player and the largest difference compared to the league average.
Highest Avg. Separation Grade (mark over average) | Min. 25 routes run | 2023 Season
| Player | Route | Avg. Separation Grade |
| Tyreek Hill | Go | 0.34 (+0.37) |
| Justin Watson | Corner | 0.26 (+0.23) |
| Garrett Wilson | Seam | 0.24 (+0.20) |
Key takeaways
- PFF’s all-coverage charting can provide an in-depth look at the average separation generated by different route concepts and additional factors that tie in.
- Beyond the line of scrimmage, players running slant routes got open most often in 2023 and players running comeback routes generated the highest average quality of separation.
- Coverage scheme and aggressiveness play significant roles in the ability to generate separation on particular route concepts.
- The 49ers and Dolphins' combinations of scheme and talent helped create significant separation on route concepts that typically don’t get open often.
- Additional factors that can be further investigated with this study include looking at receiver alignment, pre-snap motion, route depth, alignment of primary coverage defender, and penalty frequency.