Last offseason, we made a pretty significant claim that pass-rush was not as important as previously thought and that coverage was more important than we’ve been led to believe.
PFF coverage grades correlated with winning in sample more than pass-rush did from 2006-2018, and it was more predictive of defensive success year-on-year, as well. This upset some people, but it has gotten an increasing amount of support within both traditional football circles and the analytics community.
We then circled back at some of the mechanisms for why coverage might be more important than pass-rush. We found that, as expected, proficiency in coverage increases time to throw (which is generally bad for an offense). In contrast, proficiency in pass-rush ability decreases time to throw, which is generally better for an offense given the league’s movement towards shorter, more efficient passing plays.
In this article, I want to look at how this narrative has stood up this year. In a season where many quarterbacks have either retired, been hurt or simply been ineffective, defense has not been as helpless as it was in 2018. There are a lot of ways to skin the cat here, but we start with success rate and expected points added allowed as a pass defense, and we use our 0-100 grades (available through a PFF Elite subscription) to see how they correlate.
2019 entanglements
It’s not terribly hard to imagine that pass-rush and coverage are correlated with each other, as good coverage elicits more time for the pass-rush to do well, and good pass-rush makes mistakes on the back end far less costly. While historically, these two things were only weakly correlated year-to-year, in 2019, the 0-100 grades for pass-rush and coverage were correlated at a rate of 0.43. Looking forward, it will be interesting to see if this is something that is changing fundamentally in the NFL or if it's just a product of a small sample of defenses that have been either good at both or bad at both over the course of the last 17 weeks.
Defensive efficiency and coverage versus pass-rush
Below is a plot of coverage grades versus pass-rush grades. In this case, up and to the right is better.
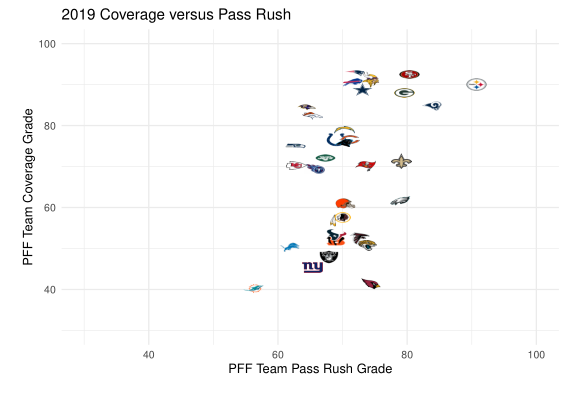
The high correlation between the two variables in 2019 is apparent, and some pretty palpable clusters are emerging, with all six of the seven defenses in the upper right cluster earning a top-10 spot in both yards per play allowed and EPA allowed.
Interestingly, among the very best defenses — those with coverage grades above 80.0 — the returns appear from the graph to be minimal when pass-rush increases. Additionally, some defenses were poor in coverage but had some pretty good performances from their pass-rushers (Arizona’s Chandler Jones and Oakland’s Maxx Crosby come to mind) that ultimately did not matter when it came to passing efficiency allowed.
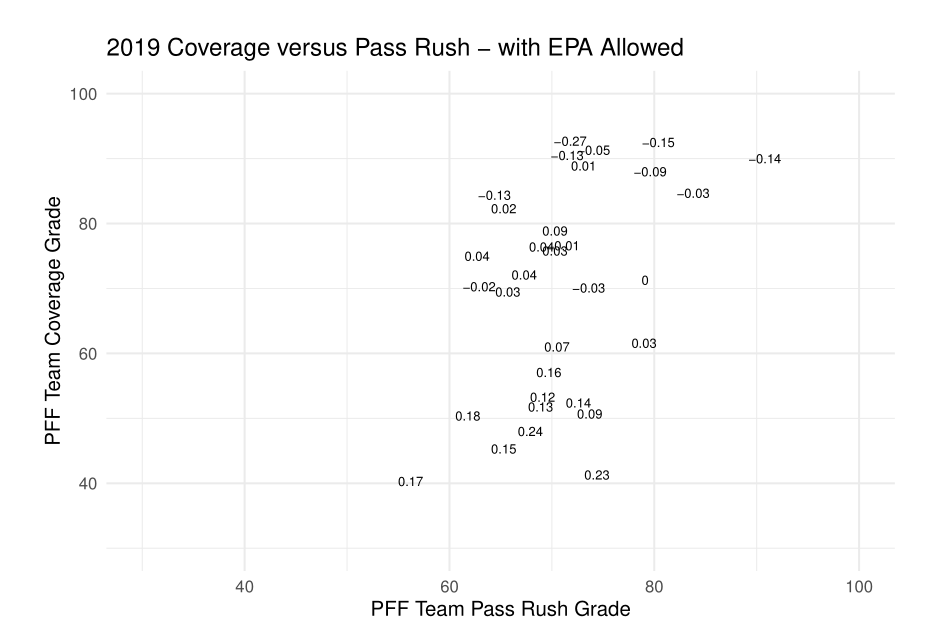
And this is what is borne out of the data. While PFF pass-rushing grades correlate with EPA allowed at an impressive -0.43 (better pass-rush yields smaller EPA), PFF coverage grades correlate at a rate almost double that of pass rush (-0.88). Correlations are similar when looking at other variables like yards per attempt.
Coverage is never going to be mistaken for our most stable variable, and indeed, some teams have gotten better at it (Kansas City Chiefs) and gotten worse at it (New England Patriots) as the season has progressed. Still, our offseason claim that coverage was what drove defensive success in the passing game passes at least the initial first test.
The mechanisms
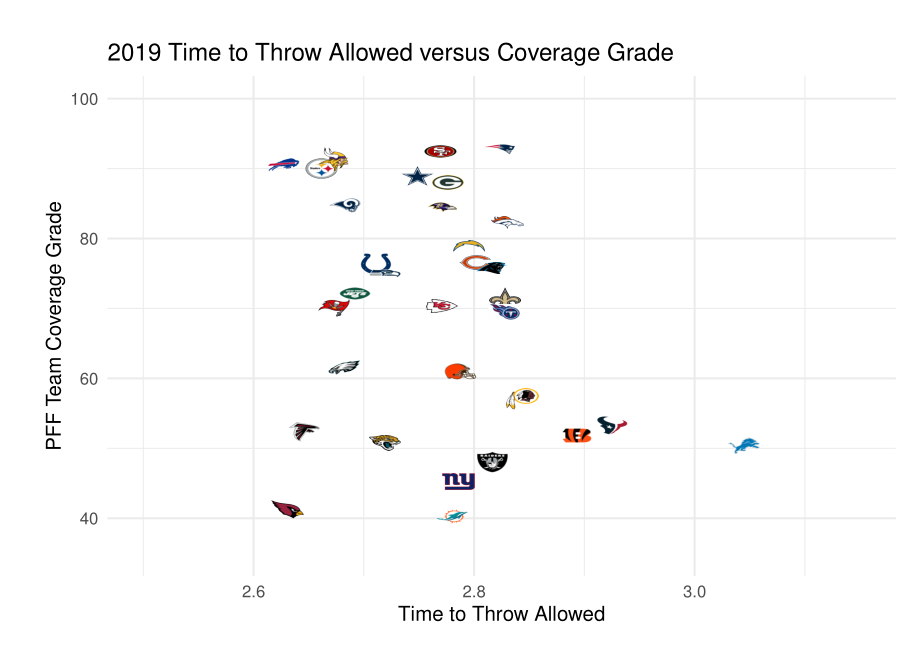
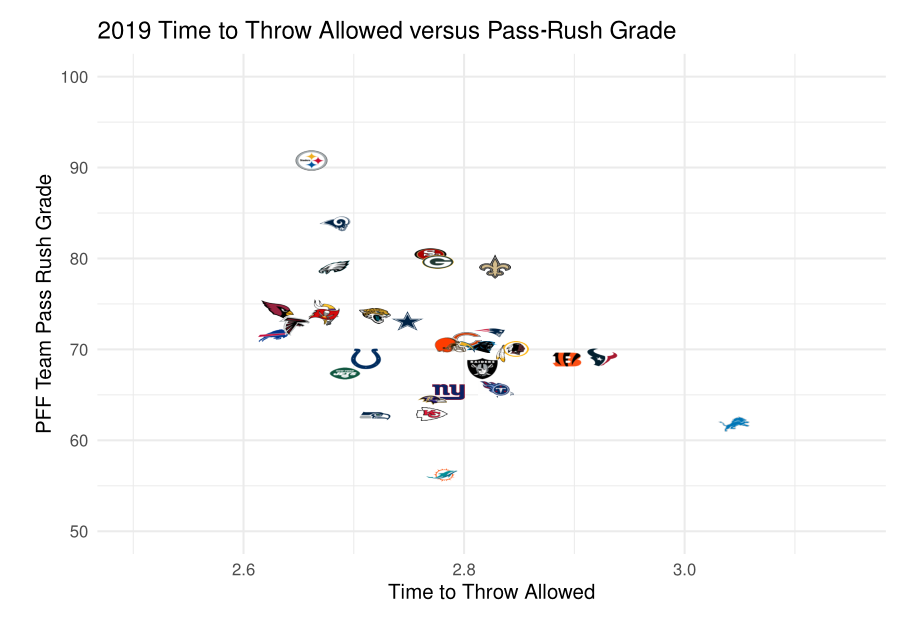
Let’s take a deeper look into the mechanisms that drive defensive success and how that influences coverage. As we discussed in previous work, good (bad) coverage tends to increase (decrease) an offense’s time to throw at the play level, while pass-rush has the opposite effect.
What we find when we look into the 2019 data is that there are significant amounts of noise in that realization. For example, the Detroit Lions (over 3.0 seconds per opposing pass attempt, slowest) had one of the worst coverage groups in the NFL in 2019, while the Buffalo Bills forced opposing teams to get rid of the ball in just over 2.6 seconds and were one of the best teams in the league at defending the pass. A decent number of good pass defenses dealt with teams hanging on to the ball for a long time (e.g., the Patriots), but after aggregating at the play level, we can see that it was the latter relationship (time to throw with pass-rush) that carried in 2019.
The Detroit Lions stand out here. While they acquired both a pass-rusher and a cornerback in free agency and had Darius Slay already in the fold, they had a poor pass defense in large part by choosing to rush the fewest players on average (4.0 rushers per play) among all NFL defenses.
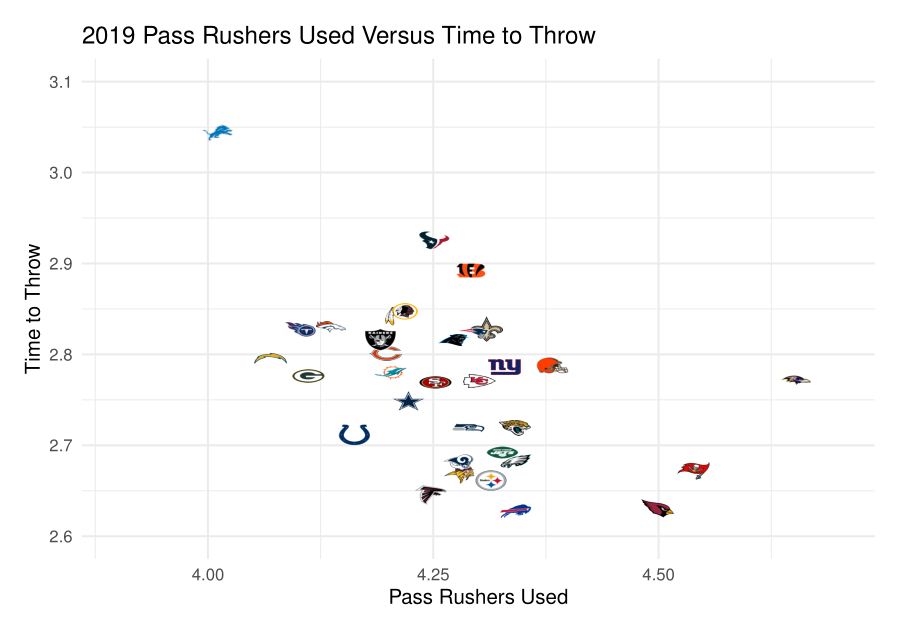
The Baltimore Ravens, on the other hand, send the most rushers per play (4.65) but make the opponent hang on to the ball longer than the average team, and they have had a top defense as a result.
My colleague Steve Palazzolo wrote about the Ravens' approach a while back, highlighting how they manufacture pressure and build through the secondary. There’s no bigger testament to this approach than cornerback Marcus Peters, who is our fifth-highest graded cornerback since arriving in Baltimore for Week 7.
The Ravens' opponents have been forced to hold onto the ball for 2.9 seconds per pass attempt since the trade as opposed to 2.6 seconds beforehand. Now that they have a defense with Earl Thomas III, four starting-caliber cornerbacks, a resolved linebacker group and a great scheme, look out for the Ravens' defense in the playoffs.
Baltimore Ravens average time to throw allowed
| Average time to throw (seconds) | |
| Pre-Marcus Peters trade | 2.62 |
| Post-Marcus Peters trade | 2.90 |
What do we take from this?
In 2019, we found what we’ve observed that each time we have studied how different PFF grade facets affect defensive efficiency, coverage correlates more highly to things like EPA allowed than pass-rush does. Some of the premier defenses in the NFL — the Patriots, Ravens and Bills, for example —are explicitly favoring coverage in their personnel preferences, while the San Francisco 49ers, Los Angeles Rams, Pittsburgh Steelers and Green Bay Packers have all made an effort to improve in the secondary through the draft, free agency and trades, and they have reaped the benefits as a result.
This has been a weird year for defenses in the NFL. With Big Ben, Drew Brees, Patrick Mahomes, Cam Newton, Matthew Stafford and Sam Darnold all missing time through injury, and several young quarterbacks playing significant snaps in their stead, the relationship between pass-rush and coverage was stronger than we’ve seen in recent years. With pressure rates being such a quarterback trait, it’s not out of the realm of possibility that some defenses are getting an opportunity to wreak havoc up front and on the back end against these inexperienced quarterbacks more often than against previous stables of great signal-callers.
The relationship between time to throw and coverage prowess (at least aggregated at the team level) was not the same as we saw during the rest of the PFF era (2006 – present), while the relationship between time to throw and pressure rates remained as previously seen (with the exception of the Ravens, who appear to be bucking every league-wide axion). The debate between coverage and pass-rush, to the degree that you can untangle the two of them, is not over, but 2019 pushed us further towards the conclusion that coverage is very, very important and should increasingly be a point of emphasis for teams in the future.
