Last year, we investigated the individual draft success of each NFL team by comparing the performance of each draft pick against the expectation based on draft position. With the 2021 NFL Draft now just over two months away, we want to revisit this study using another method to describe draft success.
The success of a draft pick is measured by the PFF WAR (wins above replacement) of the respective player over the first four years, as this is the time frame in which a drafted player yields surplus value due to his relatively cheap rookie contract.
Subscribe to
We want to examine recent draft success, but players drafted in 2018 or later haven’t yet played four years. Luckily, WAR after four years is highly correlated to WAR after three or even two years, with R^2 values of 0.96 and 0.87, respectively. Therefore, we can assess each team's 2018 and 2019 draft success by predicting the WAR numbers after four years with a high degree of accuracy.
It even makes sense to include the 2020 draft, as rookie WAR and draft position predict the WAR after four years with an R^2 value of 0.60 (the draft position adds 0.05 compared to only using rookie WAR).
Using the projected four-year WAR for each draft pick from 2018 through 2020, along with the actual four-year WAR for the 2017 draft class, we can compute the draft success of each NFL team by adding the difference between the outcome and the expectation for each draft pick.
This is a measure of the magnitude of the surplus value a team enjoyed from their draft picks during the 2020 season since these were the players on a rookie contract.
The following chart displays the outcome of each draft pick and the total draft success through the team logos.
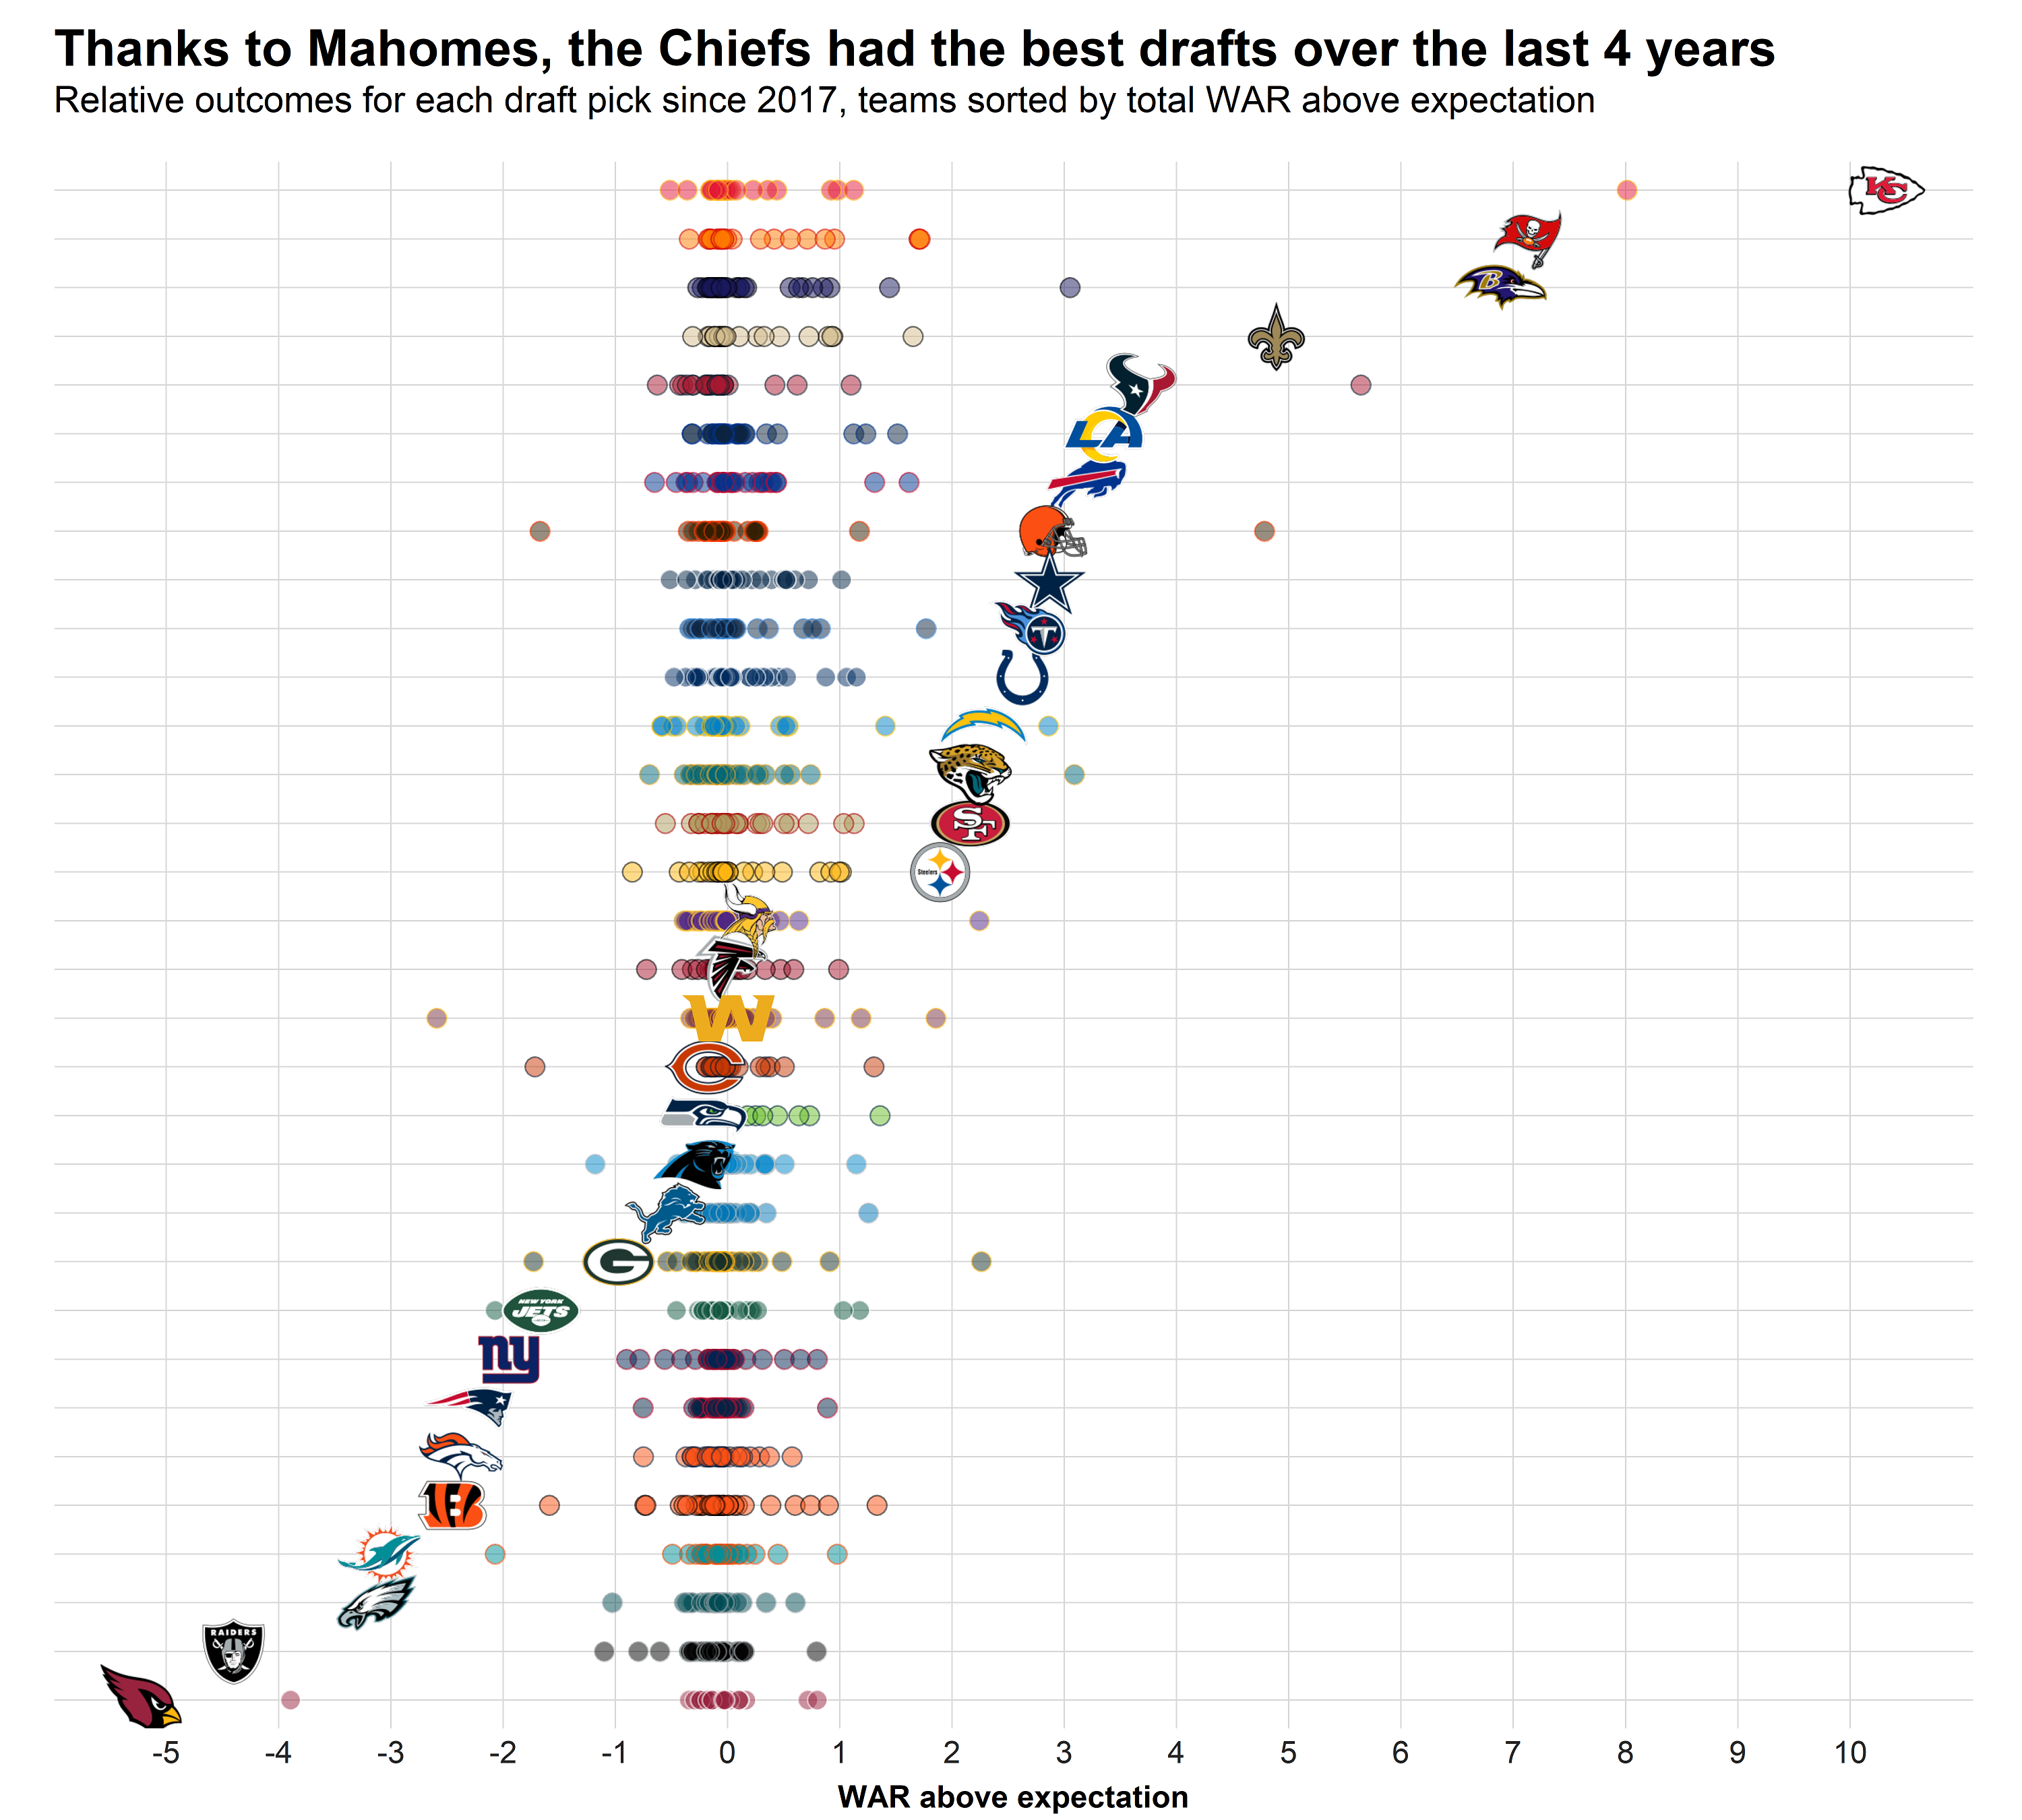
The two Super Bowl teams from the 2020 NFL season are at the top, illustrating the importance of draft success and surplus value toward team success.
However, a closer investigation of this chart reveals that it might be misleading when it comes to representing draft success in terms of consistency, as 80% of the Kansas City Chiefs‘ positive value stems from the Patrick Mahomes pick alone.
The Houston Texans are in a similar position thanks to quarterback Deshaun Watson, but their other picks combine for a negative value above expectation. That would explain why the Texans went 4-12 despite Watson’s magical season.
On the other side of that spectrum, the Washington Football Team falls in the middle of the pack despite having a large negative impact from drafting quarterback Dwayne Haskins, who has performed well below expectation so far (and this won’t change, as he very likely won’t be a starter in 2021). The fact that they are still average even with this one huge negative draft pick suggests that they have been pretty consistent otherwise.
To develop a better method of measuring draft consistency, we note that we not only built an expectation for each draft slot but also considered the full distribution of outcomes for each position. Consequently, we can describe the percentile in which a player landed after considering his draft slot and his position.
For example, Mahomes landed in the 99.9th percentile of outcomes for a quarterback selected with the 10th overall pick, as he was the most valuable player we’ve ever measured after four years of play, with 11 WAR. The same is true for Quenton Nelson, as his projected WAR of 1.6 after four years is the 99.9th percentile of outcomes for offensive guards selected within the top 10.
By accounting for the position and measuring the percentile instead of the WAR difference between outcome and expectation, we measure draft success in the same way teams might think about it. For instance, due to the high value of wide receivers, Calvin Ridley and Quenton Nelson are projected to have the same WAR above expectation after four years. Still, Ridley’s outcome falls “only” in the 80th percentile for wide receivers drafted at the end of the first round. This reflects that most people would consider Nelson as the better pick, as he became a perennial All-Pro player while Ridley is just a “good” wide receiver.
We can now look at the teams that got the best draft outcomes in terms of consistency. Below, we are ranking teams by the average percentile their draft picks landed in across the full distribution of outcomes.
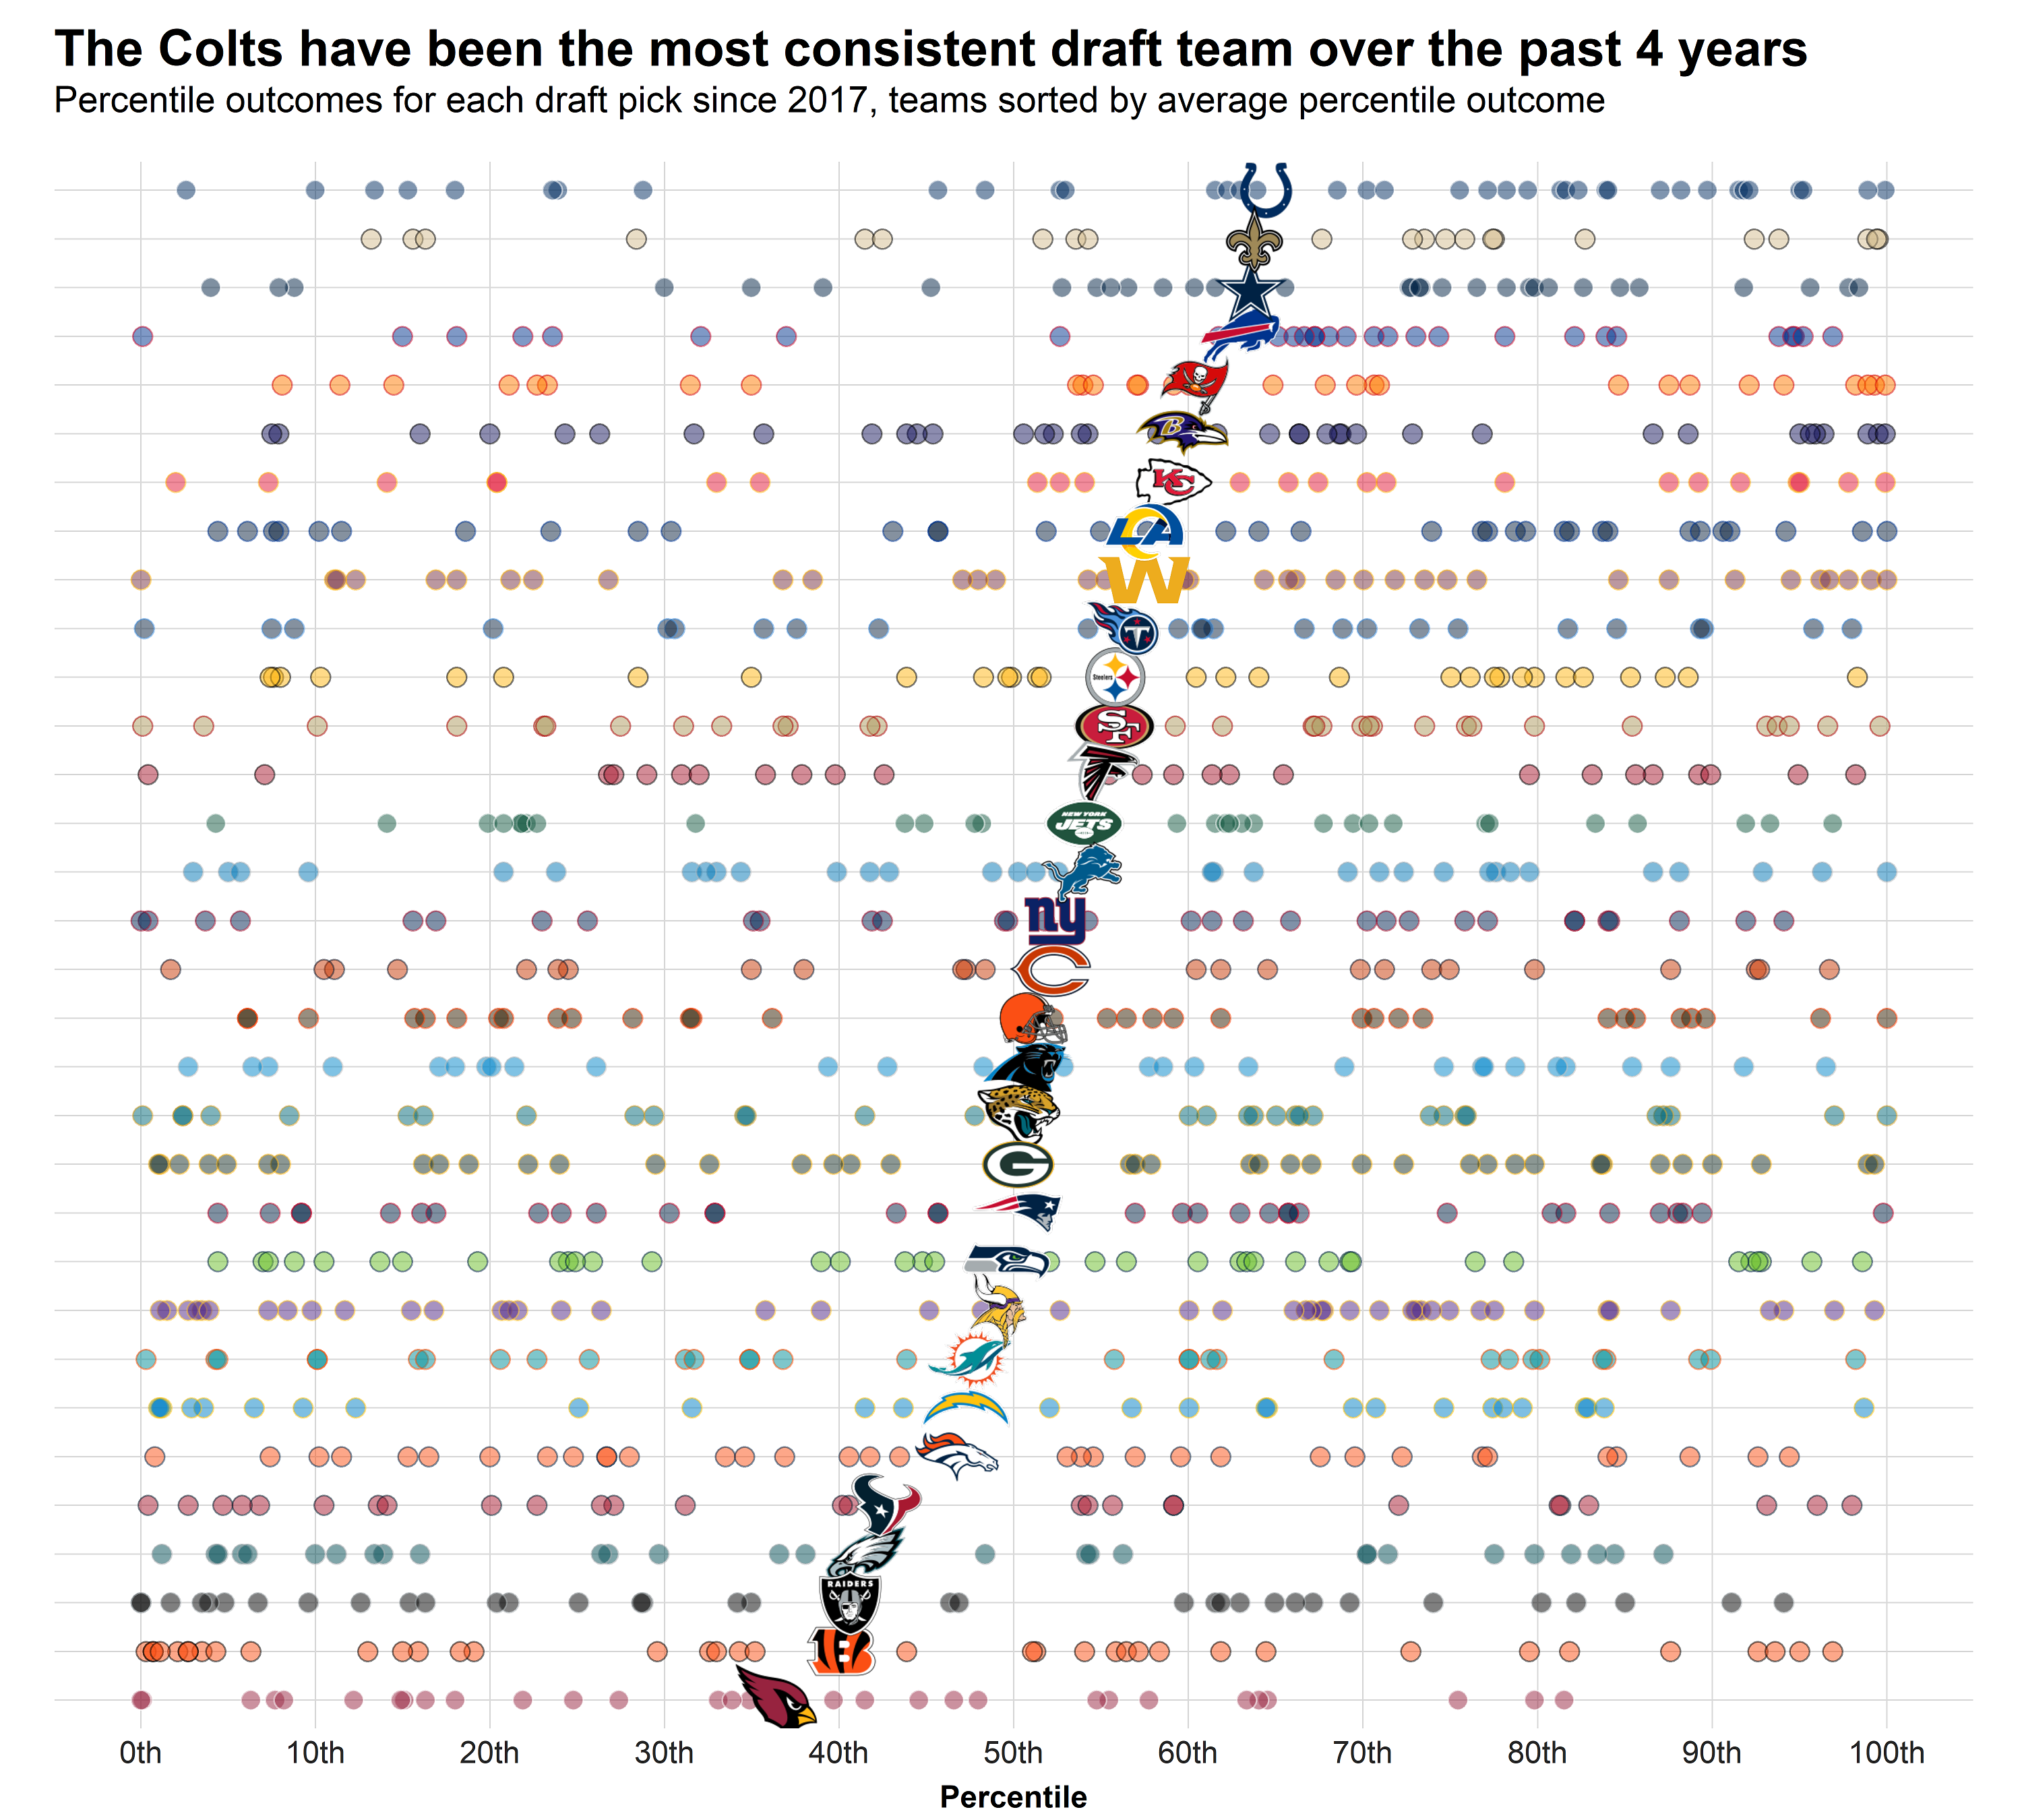
The Indianapolis Colts replace the Chiefs at the top due to an extremely high number of picks that landed in the 75th percentile. Coming back to our example of the Washington Football Team, we note that they were a top-10 draft team over the last four years when we measure consistency instead of overweighting the failure that was the Haskins pick. Their recent draft success is a reason why they are a good quarterback away from becoming an outstanding team.
Weighing by round helps to describe the impact
A 90th-percentile hit in the top 10 is obviously much more impactful for a franchise than a 90th-percentile hit in the seventh round, as the former would generate almost 2 WAR over four years, while the latter separates from his peers by simply making the roster and generating roughly 0.2 WAR over four years.
This sounds intuitive, and it’s supported by hard data: When correlating the average percentile of a team's top-100 draft picks over the last four years to point differential in a season, the result is much larger than when we do the same with draft picks beyond the top 100.
So, when computing the average outcome percentile of a given team's draft picks, we should weigh those draft picks by draft position.
This is done in the following chart, where the dot's size indicates the weight (and thus the draft position) of each unique draft pick. The average is computed with the respective weights.
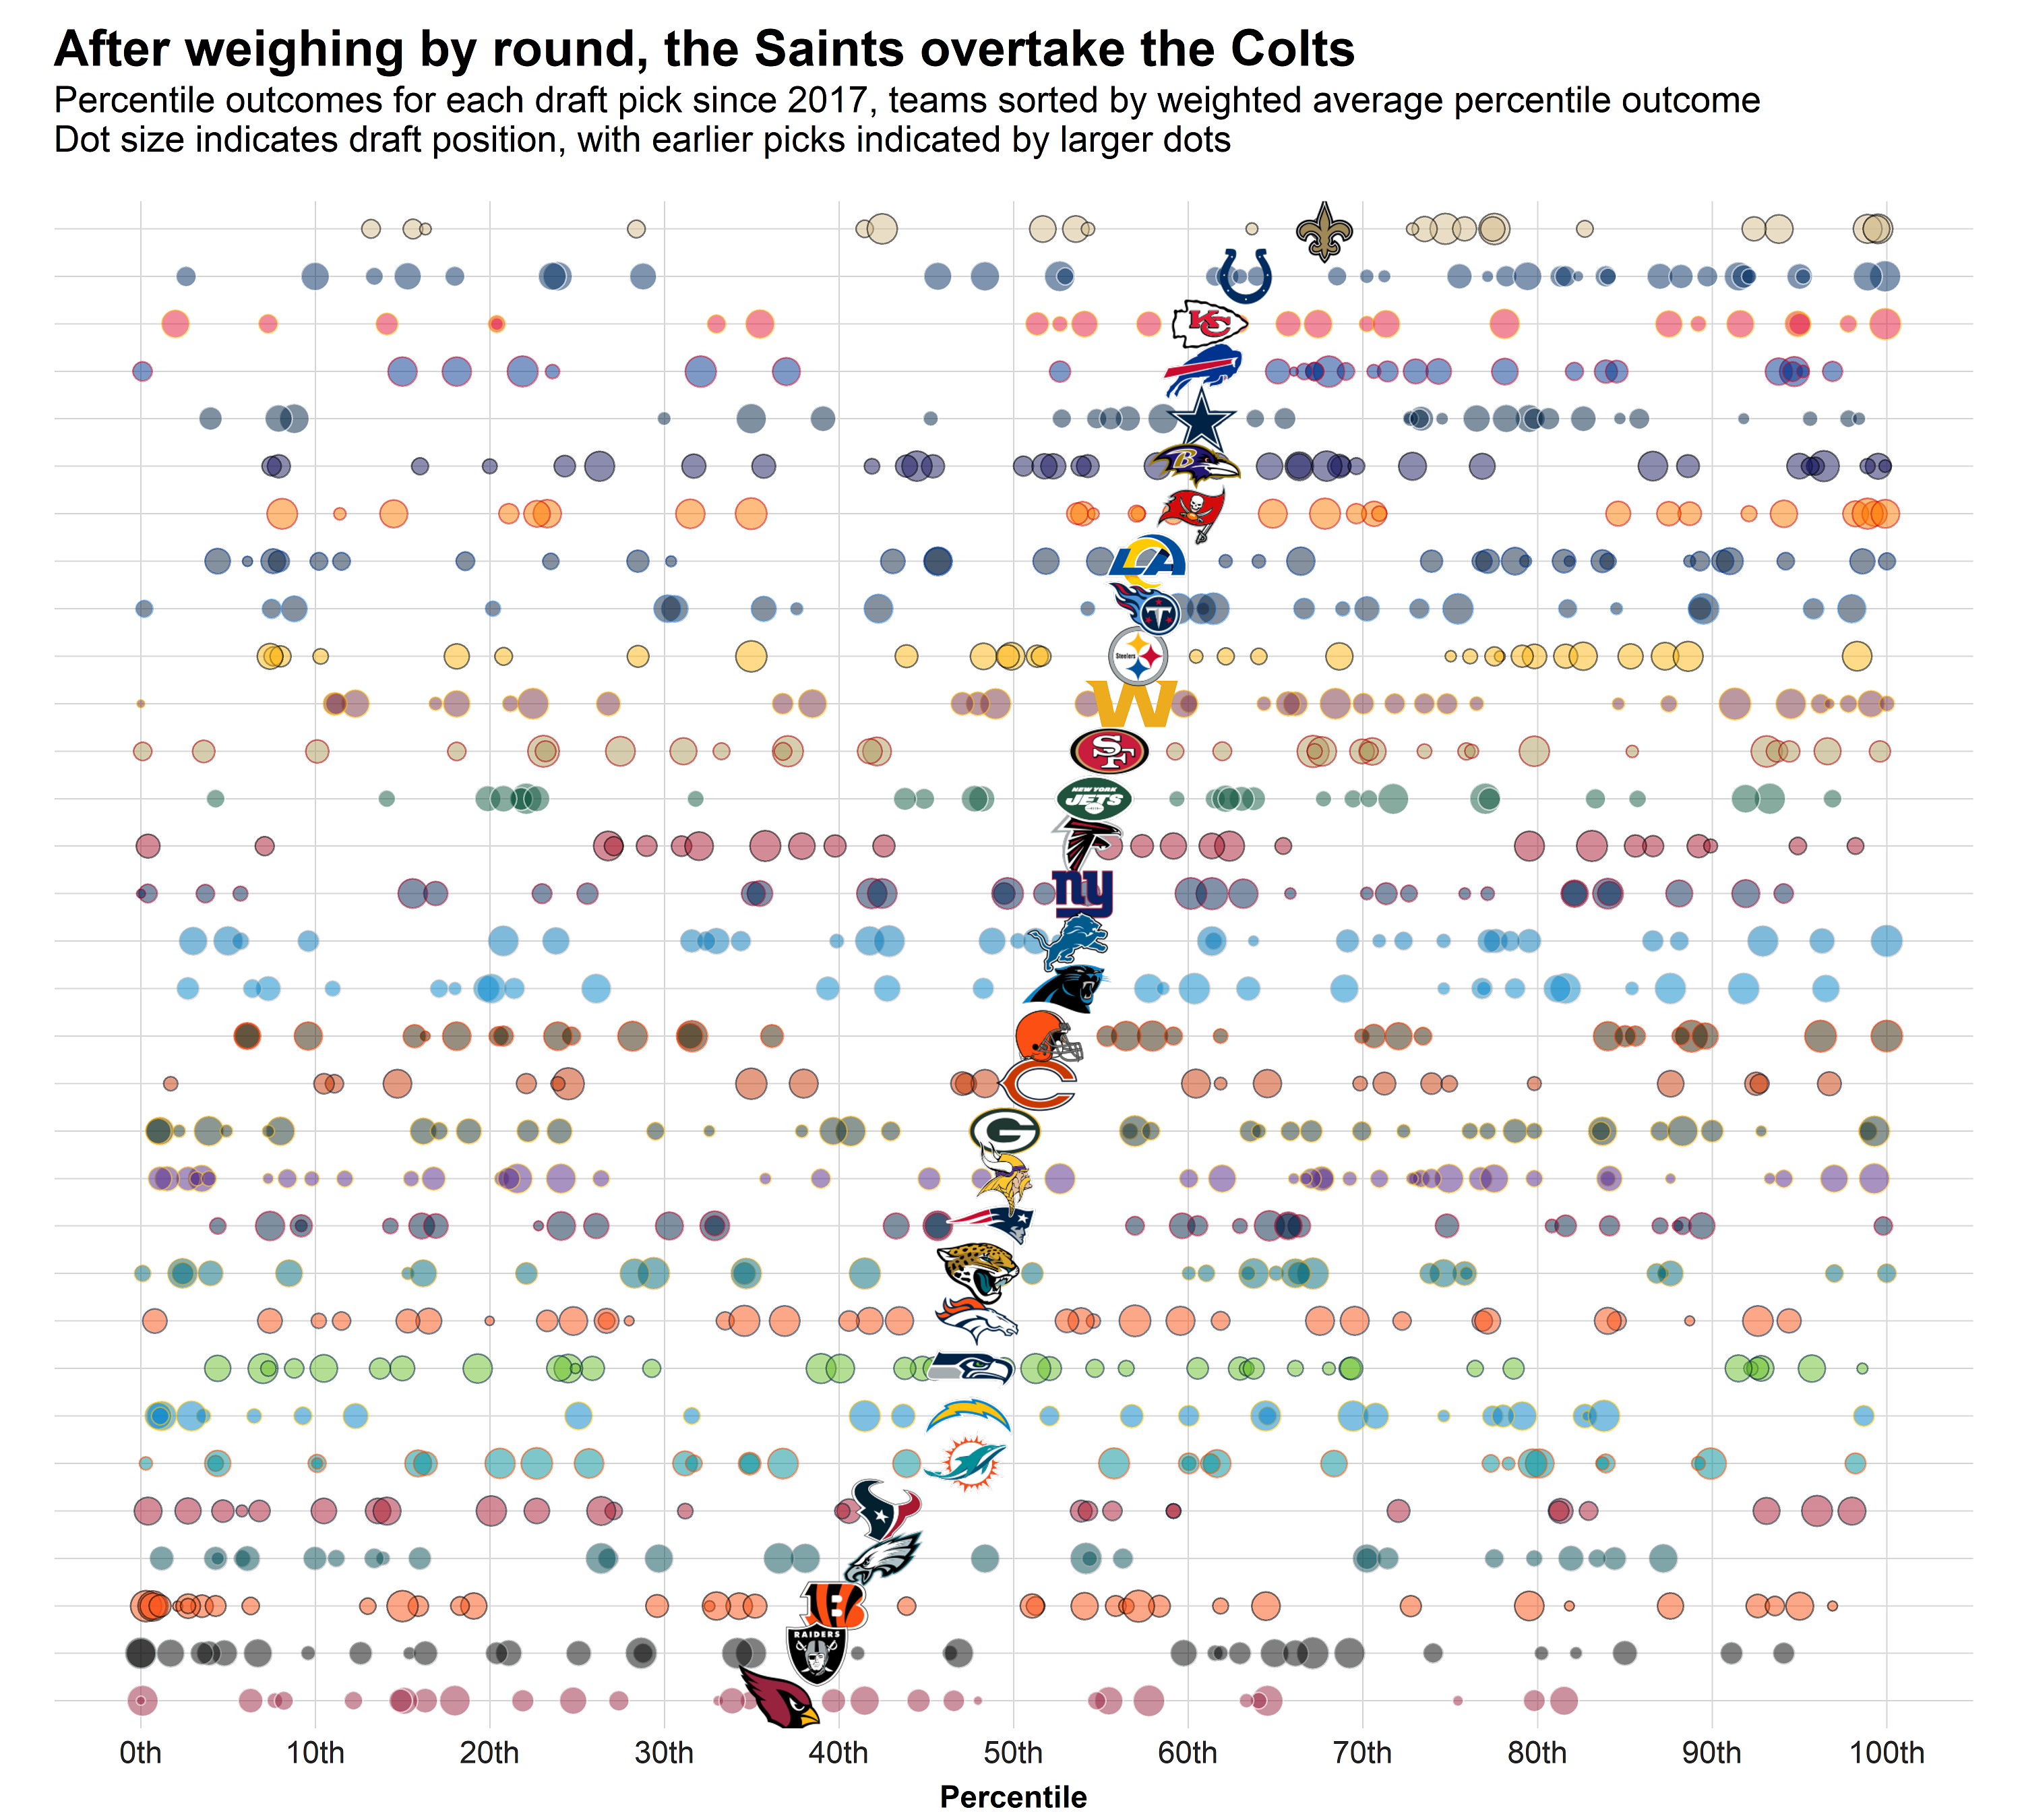
The New Orleans Saints turn out to be the top team in terms of draft consistency, mostly because their busts came in later rounds — almost entirely inconsequential for a franchise. This explains why the Saints won the NFC South four times straight after going 7-9 three years straight before 2017.
The picture gets clearer when rewarding positional value
As I have already mentioned, we described draft success as teams might think about it. When a guard at No. 6 becomes a three-time All-Pro player after three years, it’s as good a pick as one could imagine.
However, since offensive guards have relatively low value compared to other positions, Nelson lands in “only” the 93rd percentile when compared to the full distribution of all players selected in his range. Of course, this is still exceptional, but it’s a small difference and illustrates that the absolute ceiling for a top-10 guard seems to be the 93rd percentile. After all, it's hard to imagine a better guard than Quenton Nelson.
When we measure draft success by comparing each draft pick (non-quarterbacks) to the distribution of outcomes of all players drafted in the same range, we reward the selection of valuable positions. When doing this, we get a pretty good impression of why the Buccaneers won the Super Bowl.
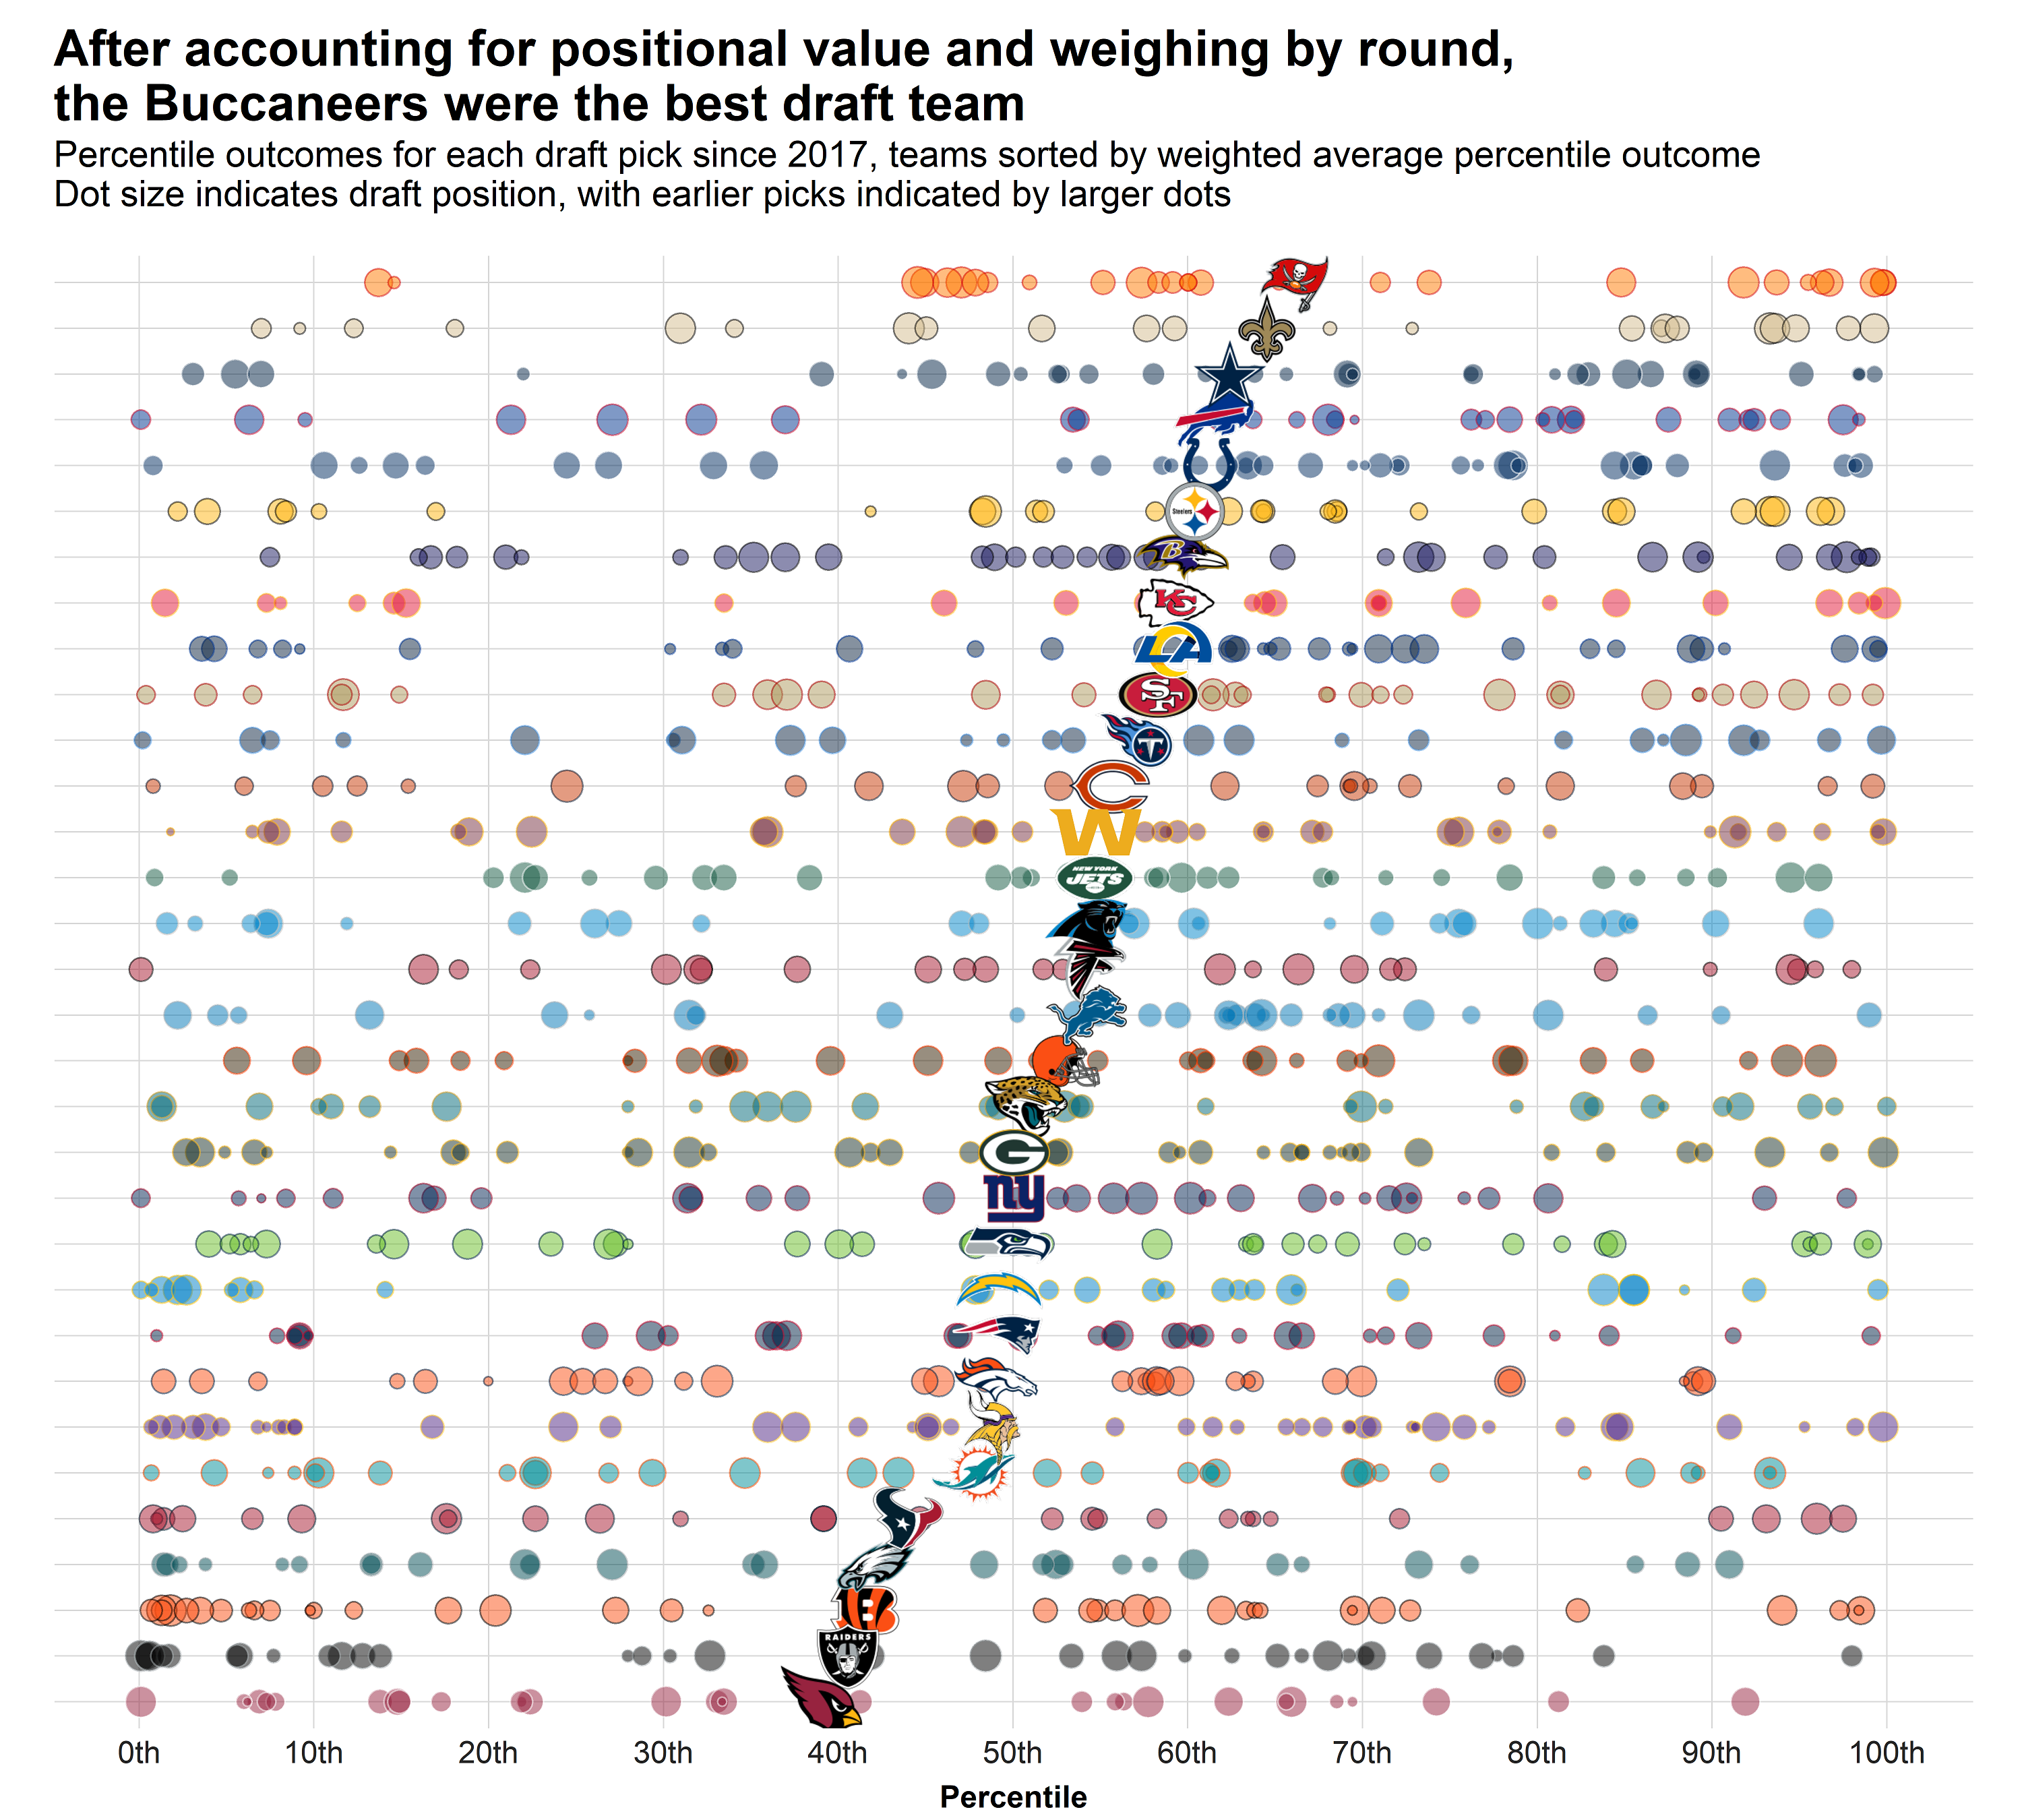
Of their 29 draft selections since 2017, eight land in the 90th percentile of outcomes: Chris Godwin, Jamel Dean, Antoine Winfield Jr., Carlton Davis, Jordan Whitehead, Scotty Miller, Mike Edwards and Tristan Wirfs. That’s more than any other team. And most notably, Miller is the only pick among these who came late in the draft.
Additionally, they had only one notable bust over the same time frame: M.J. Stewart in the second round in 2017. Drafting valuable positions and going on a lucky run in terms of draft success is exactly how Super Bowl teams are built around the quarterback.
Are some teams better at evaluating college players?
The analysis we performed is purely descriptive — it explains what happened. The next questions pose themselves naturally: Does this mean Jason Licht and his scouts are superior talent evaluators? What about Chris Ballard or Mickey Loomis?
The answer to these questions is probably no.
For example, if we recreated the last chart for 2014-16, Licht’s first three drafts as GM, the Buccaneers rank 29th of 32 teams. Meanwhile, Chris Ballard was evaluating draft prospects for the Chiefs from 2013 through 2016, and they ranked 23rd during these four drafts. Kevin Colbert’s Steelers rank sixth in the chart above but only 24th from 2013 through 2016.
On the other side of the spectrum, John Elway's Broncos rank first from 2011 through 2016 — which explains the Super Bowl title in 2015 — but Denver hasn't had much draft success in recent years. The same is true for Bill Belichick and the Patriots, who ranked second from 2011 through 2016 but have missed on a few prospects in recent years, explaining their roster's recent decay.
Apart from the ups and downs in draft success for GMs, the overall point is that the teams' rankings can be explained entirely by chance. In the first chart, the Colts enjoyed an average percentile of 64. But if drafting were based on nothing else but luck and we could observe four consecutive drafts 10,000 times, the best team would fall into the 64th percentile roughly 25% of the time.
In other words, some team has to have the most success in the draft, and if drafting were entirely based on luck, we have a 25% chance to observe a team as good as the Colts over four years. This is not an implausible event.
You might have noticed that I couldn’t give a counterexample for Mickey Loomis of the Saints. Indeed, the Saints have been in the upper half when it comes to draft consistency in almost every four-year stretch since 2006 apart from a rough stretch from 2014-16. Does that mean they are better at drafting than other teams?
When looking at our data set — 2006 through 2020 — the Saints rank first with an average percentile of 56. When using the same thought experiment as above, we find that across 15 drafts, the best team would have an average percentile of at least 56 roughly 52% of the time if the draft was entirely based on chance — a coin flip.
Still, it seems suspicious that the best team is also the team that had only one GM during all these years. This can’t be a coincidence. What are the chances of that?
The answer is that it’s probably much higher than you think, as this might very well be survivorship bias: It’s only logical that the most successful drafting GM should keep his job.
It’s also notable that a large part of the total WAR above expectation from the Saints' draft picks since 2006 comes from the offensive side of the ball, which might suggest that Sean Payton’s ability to develop players together with QB Drew Brees might also play a role here.
It’s generally notable that draft success doesn’t solely describe the performance of the scouting department. It is surely confounded by the coaching staff’s ability to develop young players and the synergy between the scouting department and coaching staff, as identifying scheme fits is just as important as identifying pure talent.
Of course, all this doesn’t mean that there aren’t any differences between teams and their scouting departments when evaluating draft prospects. It does mean that the statistical evidence for the existence of significant differences is fragile, to say the least.
For him to make us 90% confident that he is better at drafting than the rest of the league, Loomis would need to keep up his pace for another 10 years.
We will check back in 2031.