
- Unlock your edge with PFF+: Access Premium Stats, dominate fantasy with in-season tools and projections and make smarter bets with the new PFF Player Prop Tool. Get 25% off your PFF+ annual subscription with code PFFFANTASYPODCAST25.
Estimated Reading Time: 4 minutes

Last year, I introduced a new framework for understanding wide receiver play, quarterback decision-making and offensive potential. This framework relies on an XGBOOST model and PFF’s impressive collection of route-level data. Using machine learning and this breadth of PFF data, we can create models with the goal of predicting where a target should go on a given play.
The resulting metrics, Share of Predicted Targets and Share of Predicted Air Yards, are both more stable than their “actual” counterparts.
Week 5 Recap
- Chris Olave: 11 Targets – 36.67% Target Share
- Jaxon Smith-Njigba: 9 Targets – 26.47% Target Share
- DeVonta Smith: 10 Targets – 27% Target Share
- Hunter Henry: 4 Targets 14% Target Share
- Tre Tucker: 6 Targets – 16.67% Target Share
- Juwan Johnson: 4 Targets 13.33% Target Share
Week 6 Potential Breakouts
These are players who were open significantly more than they garnered targets in Week 5. In general, players who show up on this list see an uptick in Targets per Route Run and Target Share relative to both themselves and all players with similar target shares.
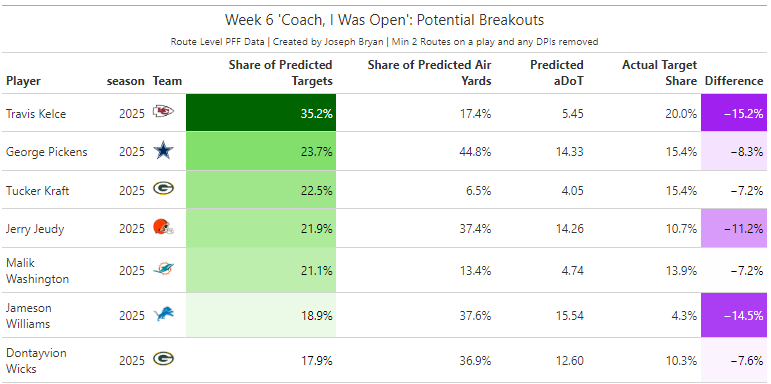
Even after earning a 20% target share and eight total targets, Travis Kelce was open often versus the Jaguars on Monday Night Football —garnering himself an outstanding 35.2% Share of Predicted Targets. This is the fifth-highest Share of Predicted Targets in the 2025 season!
EPA Analysis of Predicted Targets
It is common sense to assume that the more open a player is when targeted, the better the outcome, but I wanted to analyze this a bit further. I grouped each targeted route of the 2025 season into quartiles based on the predicted target probability from my model to get a better understanding of the EPA (Expected Points Added) outcomes for a high- or low-target-probability throw.
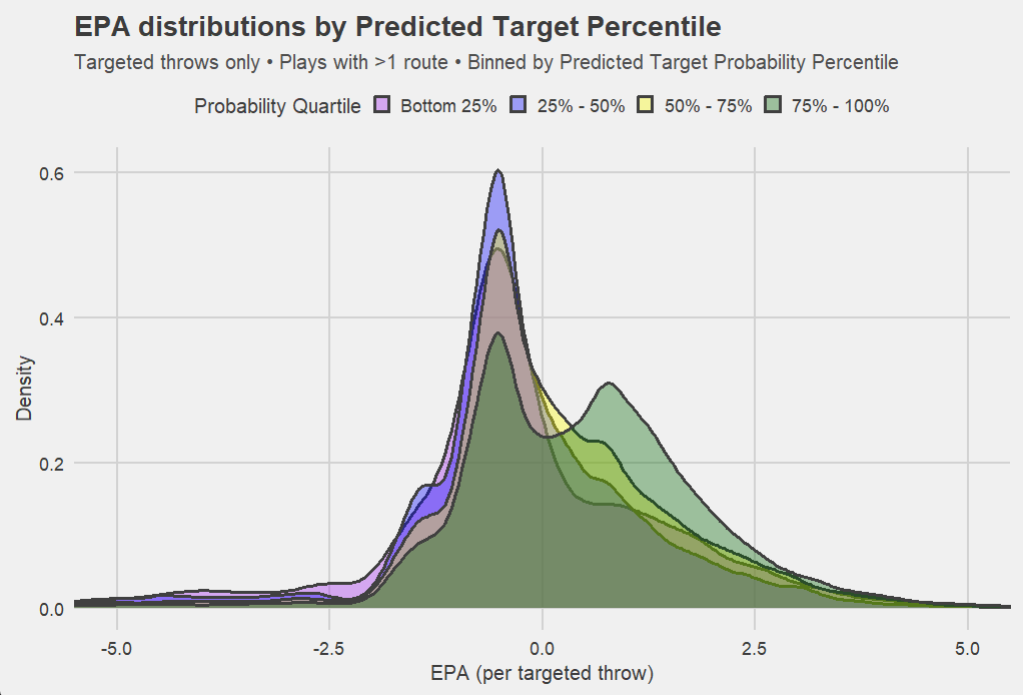
Above is a density plot for each quartile. A high probability of being targeted would indicate a player who is relatively open, while a low probability would mean the player is covered quite well.
As we can see, players in the “Top 25%” of target probability who garner a target have substantially better outcomes than players with lower target probabilities. We can also see the “Bottom 25%” group with a fairly large tail of negative EPA outcomes.
This graph answers a fairly simple question that I had not answered this season — is a higher probability of target objectively a good thing? I would say yes! Quarterbacks should be throwing the ball to high-target-probability players more often than not for better EPA outcomes.
Below is the same EPA distribution plot, but limited to completed passes.
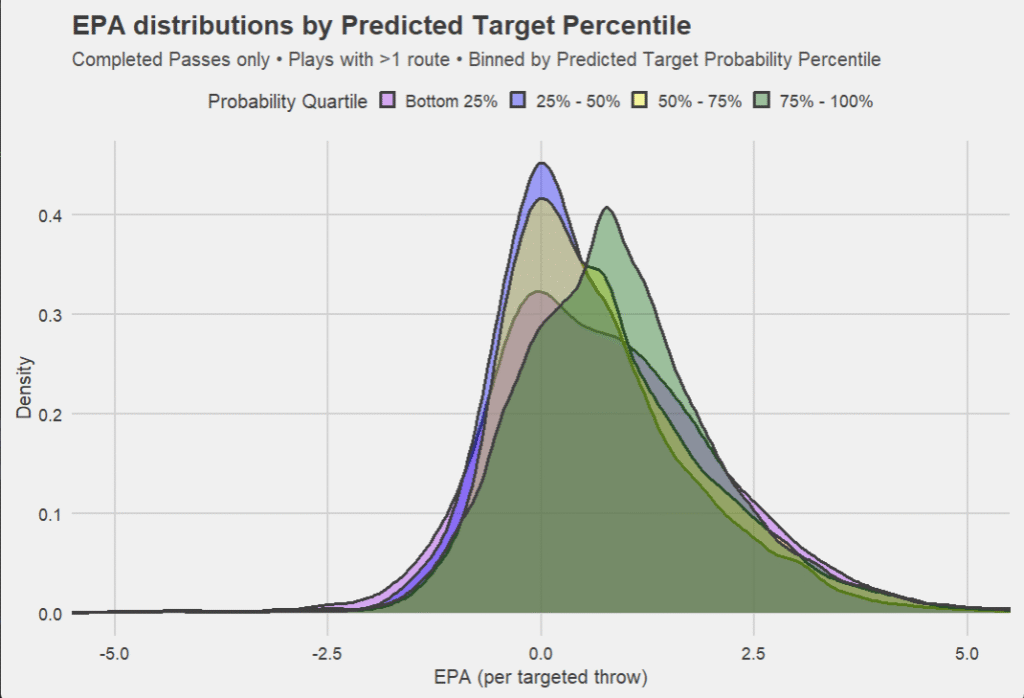
This graph is interesting, because at the very highest end of the distribution is where we see the “Bottom 25%” group emerge. This makes intuitive sense, as a player could be very well-covered but make an excellent play that defies the odds — resulting in a higher EPA. Let’s look at a few cases in Week 5!
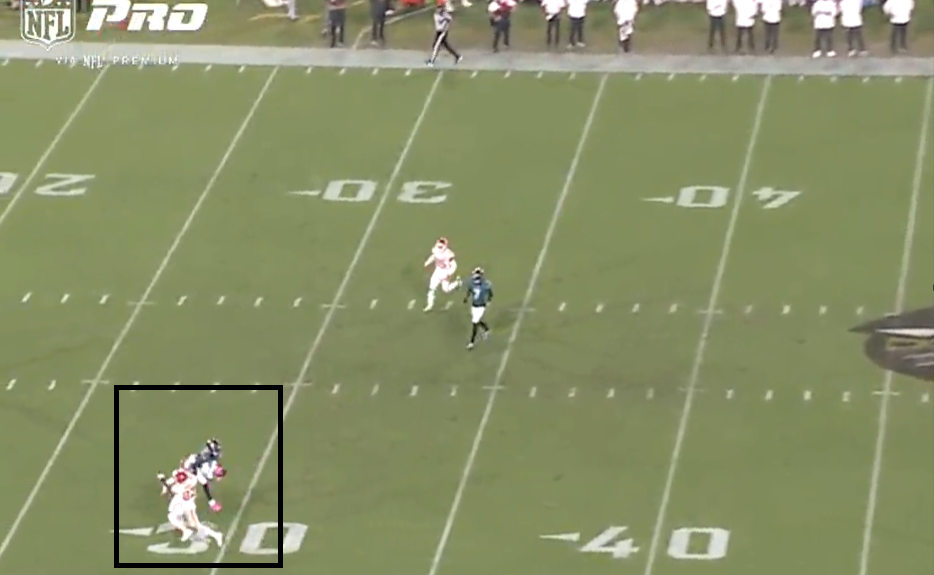
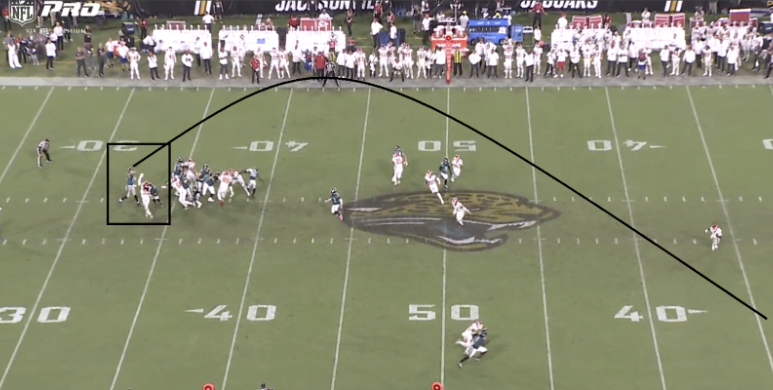
Travis Hunter potentially made the catch of the week against the Chiefs on Monday Night Football.
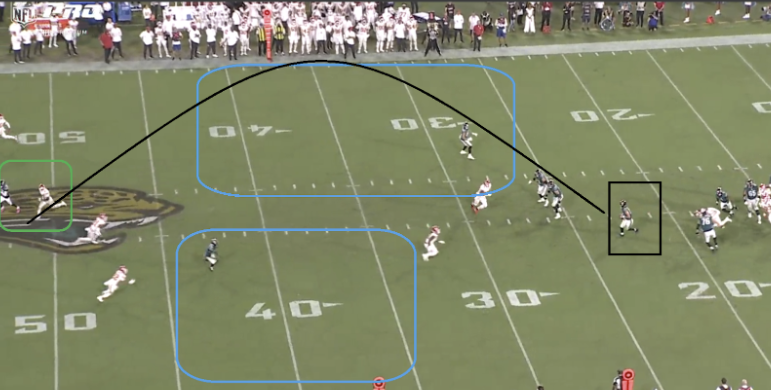
It's first-and-10 in the third quarter. The Jaguars are losing by 7 and working on their comeback.
Dyami Brown and Johnny Mundt are both wide open as Trevor Lawrence escapes pressure from the Chiefs. Both would have been great choices with 50-plus% target probabilities. Instead, Lawrence heaves the ball 44 yards into the air, and Travis Hunter makes an impressive play worth 2.81 expected points. This play was roughly equivalent to a field goal!
Not to be outdone in the same game, Brian Thomas Jr. had one of the only other game-altering, low-target-probability, plays of the week.
The Chiefs come out in a two-high safety look but quickly transition to Cover 1 as the ball is snapped. The moment Lawrence realizes this, he launches the ball 30-plus yards downfield to Thomas on the sideline. Jaylen Watson attempts to swat the ball but misses.
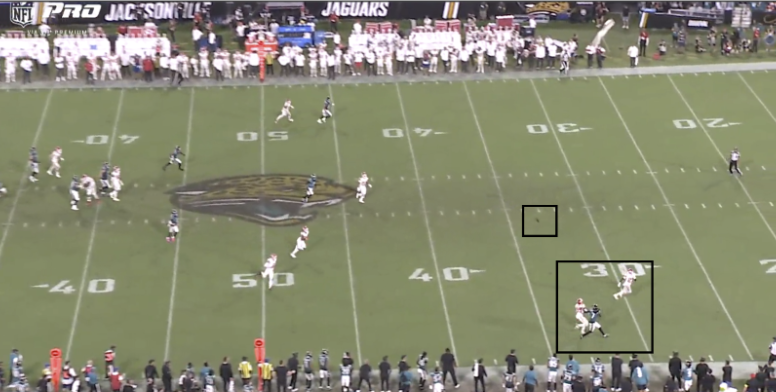
Thomas catches the ball and gets hit out of bounds immediately. This play changed the course of the game and added 2.76 expected points as the Jaguars were losing 28-24 with 1 minute left. The final touchdown run by Lawrence was amazing, but the Jaguars would likely never have made it to that point without this amazing effort from both Lawrence and Thomas Jr. earlier in the drive.
