- Box score and grade diverge: Caleb Williams totaled four touchdowns in Chicago’s 59-37 win but earned a 64.0 PFF passing grade.
- Accuracy provides more context: Williams completed 72.4% of his passes but recorded a 53.8% accurate throw rate and finished 6.8 percentage points below expectation in accuracy.
- Introducing the NEW PFF Pro subscription: PFF Pro includes everything in PFF+, plus an upgraded Premium Stats Pro experience, higher base access to Guru AI, revamped player and team pages, enhanced data and visualizations, an improved interface and programmatic data access for modeling. Click here to subscribe.

The Chicago Bears offense could hardly have produced a more convincing statistical performance to open the 2026 season.
Chicago piled up 552 yards, averaged 7.9 yards per play and scored eight touchdowns in a 59-37 win over the Carolina Panthers, setting a franchise record for points in a season opener. The Bears generated 0.419 EPA per play, posted a 55.7% success rate and turned all four of their red-zone possessions into touchdowns.
And at the center of it all was quarterback Caleb Williams, who finished with 334 total yards and four touchdowns. He completed 21 of 29 passes for 269 yards, two scores and no interceptions, good for a 124.1 passer rating, while adding 65 yards and two scores on the ground.
However, Williams earned just a 64.0 passing grade in the win, 16th among the 30 quarterbacks who threw at least 13 passes before Monday night.
On the surface, those numbers seem almost impossible to reconcile — four touchdowns, no interceptions and 59 points on the scoreboard, yet only a middling PFF grade. It raises a question that gets asked annually: How can a quarterback produce at that level without grading accordingly?
The answer lies in what PFF grades are designed to measure.
PFF grades were built to be box-score agnostic and to capture everything the box score misses. Every play is evaluated on what the player did with it, independent of what the stat line says happened afterward. And that works in both directions.
A quarterback can finish with an underwhelming stat line and still grade well if the reads were right, the throws were placed well and on time and whatever went wrong did so after the ball left his hand. Another quarterback can finish with a pristine stat line and grade more modestly if he was asked to make routine throws all afternoon and his receivers manufactured most of the production after the catch.
What the grade measures is the part of the play the quarterback actually controls — the read, the decision, the throw. Not the result that lands in the box score.
The grading scale, explained
As many readers will already know, the PFF grading system evaluates every player on every play on a scale from -2.0 to +2.0, with 0 representing expected execution. The final 0-100 grade comes from those play-by-play evaluations and accounts not only for how often a player performs above or below expectation, but also the magnitude of those positives and negatives.
At the core of our play-by-play grading system is a 0.0, the grade awarded when a player does exactly what’s expected on a given play. A -0.5 typically represents a relatively minor mistake, such as an inaccurate throw that doesn’t put the ball in danger. A -1.0 generally reflects a more significant error in accuracy, decision-making or process that puts the ball in danger of being turned over. A -1.5 is reserved for throws that cross into the inexcusable range, such as throwing directly to a defender or failing to identify a defender in coverage. A -2.0 represents the most damaging quarterback mistakes, including reckless and needless interceptions or decisions with the potential to produce game-swinging outcomes.
The same progression applies to positive plays. A +0.5 rewards an accurate, well-executed throw that adds value beyond the routine. A +1.0 requires another level of difficulty, whether through touch, timing, accuracy or beating tight coverage. A +1.5 is reserved for exceptional throws into extremely difficult windows. At the top of the scale sits +2.0, a grade reserved for the rarest quarterback plays — a mark PFF has awarded to fewer than 30 throws since 2006.
The final 0-100 grade comes from those play-by-play evaluations and accounts not only for how often a player performs above or below expectations, but also the magnitude of those positives and negatives.
Applying the system to Caleb Williams' Week 1 passing performance
Williams dropped back 40 times against Carolina in Week 1. Eleven of those dropbacks earned positive grades, with eight earning a play-level grade of +0.5 and three earning a +1.0. He didn't grade higher than that on any play, though that's less of a knock than it might sound: Before Monday Night Football, exactly one quarterback had earned a grade better than +1.0 on any play.
Caleb Williams: Play-level grades in week 1
| Player | Dropbacks | -2 | -1.5 | -1 | 0.5 | 0 | 0.5 | 1 | 1.5 | 2 |
|---|---|---|---|---|---|---|---|---|---|---|
| Caleb Williams | 40 | 0 | 1 | 0 | 5 | 23 | 8 | 3 | 0 | 0 |
Passing plays only
Another 23 dropbacks earned a 0.0 grade. These were the expected plays — the routine plays a starting quarterback should be expected to make.
That leaves six negatively graded plays. Five earned a -0.5, representing relatively minor mistakes — in this case, poorly placed passes that didn't put the ball in harm's way but were still clear negatives. The sixth earned a -1.5, representing the most significant negative play of Williams' game.
That play came in the fourth quarter with Chicago leading 45-31 and facing second-and-1 from the Panthers’ 1-yard line. Williams dropped back, faded onto his back foot and failed to account for a defensive lineman dropping out of the rush before throwing the ball directly to him for the interception.
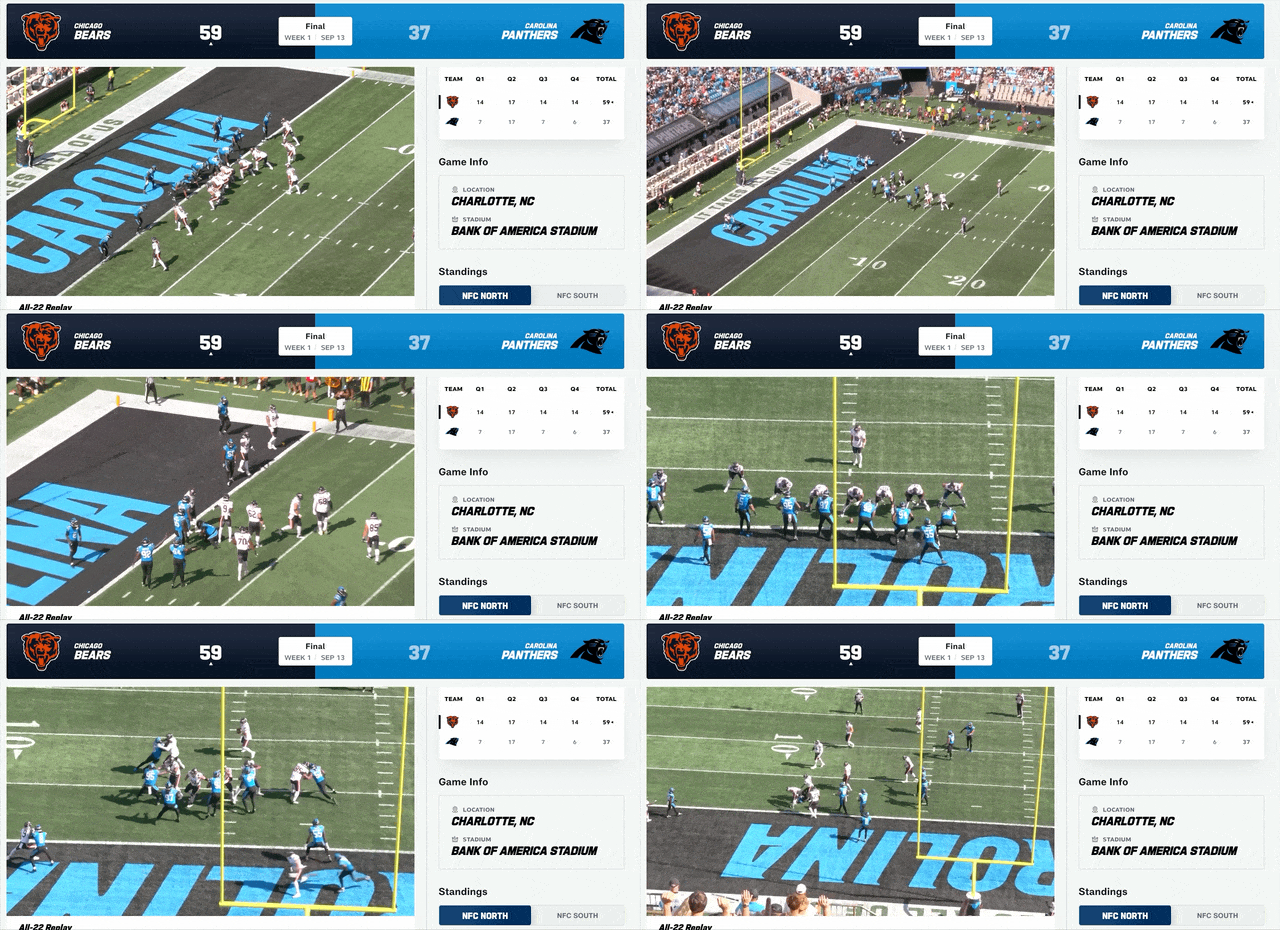
An offside penalty ultimately negated this potentially game-changing play, so the interception never made it into the box score. But that doesn’t erase the decision Williams made. Two plays later, after the penalty, the Bears scored a touchdown.
Consider what Williams' stat line would have looked like had the play stood. He would have been charged with an interception, the ensuing touchdown would have been wiped away and his passer rating would have dropped from 124.1 to 98.2.
Of course, we’re dealing in hypotheticals now, but that illustrates the larger point. This is precisely where the box score and a play-by-play grading system can diverge. Traditional statistics record the result, while PFF’s grading process evaluates the quarterback’s execution regardless of whether a penalty, teammate or opponent ultimately changes that result.
And in this case, the magnitude of the mistake matters. A -1.5 is a significant negative grade, and over a sample of just 40 dropbacks, a play that damaging will pull a quarterback’s overall grade down considerably.
How the numbers shake out
Zoom out, and Williams lands about where his overall grade suggests. His 27.5% positively graded play rate ranked 12th among 30 qualifying quarterbacks, above the 24.8% average. Across 40 dropbacks, that amounts to his 11 positively graded plays.
NFL Quarterbacks: Positively graded play rate in week 1
| Rank | Quarterback | Dropbacks | Pos. graded dropback % |
|---|---|---|---|
| 1 | Trevor Lawrence | 25 | 44.00% |
| 2 | Lamar Jackson | 33 | 36.36% |
| 3 | Jaxson Dart | 34 | 32.35% |
| 4 | Drew Lock | 25 | 32.00% |
| 5 | Dak Prescott | 41 | 31.71% |
| 6 | Jacoby Brissett | 42 | 30.95% |
| 7 | Jordan Love | 46 | 30.43% |
| 8 | Malik Willis | 40 | 30.00% |
| 9 | Josh Allen | 37 | 29.73% |
| 10 | Drake Maye | 44 | 29.55% |
| 11 | Bryce Young | 44 | 29.55% |
| 12 | Caleb Williams | 40 | 27.50% |
| 13 | Jayden Daniels | 41 | 26.83% |
| 14 | Aaron Rodgers | 46 | 26.09% |
| 15 | Carson Wentz | 27 | 25.93% |
Min. 13 dropbacks (Monday Night Football excluded)
The same calculation on negatively graded plays helps complete the picture. Williams' 15.0% negatively graded play rate ranked 17th and matched the league average, with six of his 40 dropbacks grading negatively.
NFL Quarterbacks: negatively graded play rate in week 1
| Rank | Quarterback | Dropbacks | Neg. graded dropback % |
|---|---|---|---|
| 1 | Geno Smith | 28 | 0.00% |
| 2 | Jalen Hurts | 35 | 8.57% |
| 3 | Dak Prescott | 41 | 9.76% |
| 4 | Brock Purdy | 37 | 10.81% |
| 5 | Bryce Young | 44 | 11.36% |
| 6 | Jaxson Dart | 34 | 11.76% |
| 7 | Jacoby Brissett | 42 | 11.90% |
| 8 | Trevor Lawrence | 25 | 12.00% |
| 9 | Drew Lock | 25 | 12.00% |
| 10 | Lamar Jackson | 33 | 12.12% |
| 11 | Jayden Daniels | 41 | 12.20% |
| 12 | C.J. Stroud | 48 | 12.50% |
| 13 | Kirk Cousins | 32 | 12.50% |
| 14 | Aaron Rodgers | 46 | 13.04% |
| 15 | Joe Burrow | 38 | 13.16% |
| 16 | Jared Goff | 41 | 14.63% |
| 17 | Caleb Williams | 40 | 15.00% |
| 17 | Cam Ward | 40 | 15.00% |
| 19 | Baker Mayfield | 39 | 15.38% |
| 20 | Drake Maye | 44 | 15.91% |
Min. 13 dropbacks (Monday Night Football excluded)
The same middle-of-the-pack profile shows up when looking at Williams’ accuracy, as there was a particularly notable disconnect between his completion percentage and the quality of his ball placement. Williams finished 14.1 percentage points above his expected completion percentage, the third-highest mark among quarterbacks in Week 1, but 6.8 percentage points below expectation in accuracy, which ranked 25th.
PFF’s accuracy charting helps explain why. Williams was accurate on 53.8% of his 26 aimed pass attempts, tied for 24th among 30 quarterbacks and below the Week 1 average of 59.8%. Just 7.7% of his throws were perfectly placed, compared to a 14.3% league average, while 26.9% were deemed catchable but inaccurate, the sixth-highest rate among Week 1 signal-callers.
That’s where the difference between completing a pass and executing it at a high level becomes important. Williams completed 72.4% of his attempts against Carolina, but completion percentage alone doesn’t tell us whether those throws were perfectly placed, forced a receiver to adjust or simply gave the receiver an opportunity to make the play.
Caleb Williams, Week 1 2026
Box score numbers vs. grading profile
Ranks are among the 30 quarterbacks with 13 or more attempts in Week 1, excluding Monday night.
What the box score counted
What the grade counted
Result: a 64.6 PFF overall grade and a 64.0 passing grade — 16th of 30. Williams also finished 3rd in completion percentage over expectation (+14.1) and 4th in EPA per play (0.55). Source: PFF, PFF Premium Stats.
What the grade is not saying
None of this is to say Williams played poorly, and his grade isn't saying that, either. He produced two big-time throws, good for a 6.5% big-time throw rate that ranked seventh among qualifying quarterbacks in Week 1. He also recorded just one turnover-worthy play, a 2.5% rate that ranked ninth, while his 0.55 EPA per play ranked fourth at the position.
Williams made high-level plays, largely kept the ball out of harm’s way and helped lead one of the league’s most productive offenses. He also missed on roughly a quarter of his throws and had one particularly costly mistake that never appeared in the interception column. A 64.0 passing grade reflects that entire body of work, not simply the result.
The box score tells you what happened. The grade is designed to tell you how it happened. Most weeks, those two stories will look fairly similar. When they don’t, as was the case with Williams in Week 1, the play-by-play evaluation helps explain why.
Click here for every quarterback's full Week 1 grade and advanced stats.

 © 2026 PFF - all rights reserved.