
- Unlock your edge with PFF+: Access Premium Stats, dominate fantasy with in-season tools and projections and make smarter bets with the new PFF Player Prop Tool. Get 25% off your PFF+ annual subscription with code PFFFANTASYPODCAST25.
Estimated Reading Time: 7 minutes

Last year, I introduced a new framework for understanding wide receiver play, quarterback decision-making and offensive potential. This framework relies on an XGBOOST model and PFF’s impressive collection of route-level data. Using machine learning and this breadth of PFF data, we can create models with the goal of predicting where a target should go on a given play.
The resulting metrics, Share of Predicted Targets and Share of Predicted Air Yards, are both more stable than their “actual” counterparts.
Let’s discuss the NFL rookie leaders and some potential breakout players.
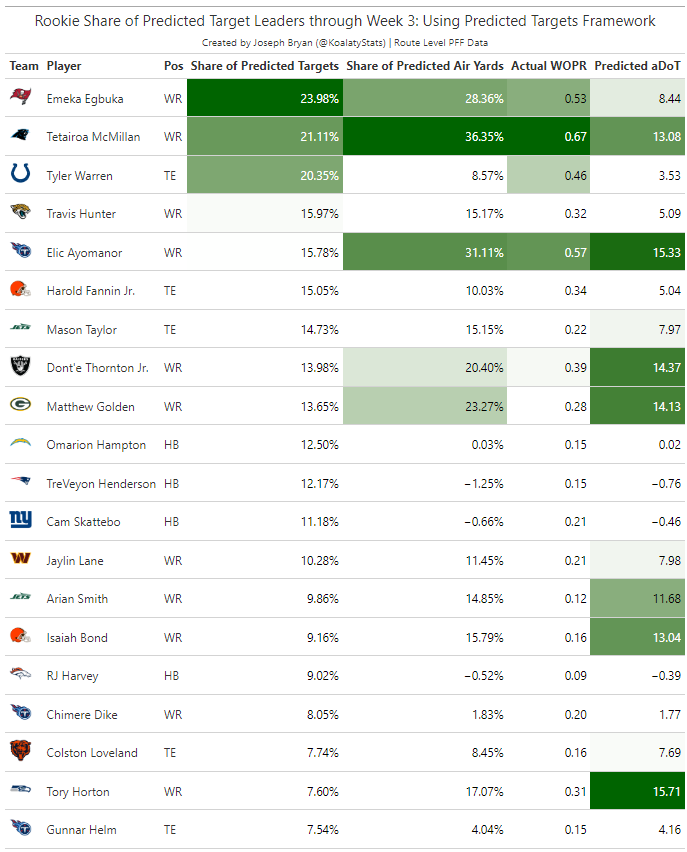
Emeka Egbuka currently leads all rookies with the highest Share of Predicted Targets and the third-highest Share of Predicted Air Yards. One way to think of this for every player is that Egbuka is being schemed targets and/or getting open the most relative to the rest of his team. Egbuka will likely see this number go up with Mike Evans sidelined, and definitely has the skillset to take over as Tampa’s WR1 in Evans’ absence. Egbuka has the second-best PFF receiving grade for all rookies with a 71.1 mark (WR27 overall, min. 15 targets).
Tetairoa McMillan has the most exciting rookie profile on this list in my opinion. He is earning a fantastic 21.11% Share of Predicted Targets and leads all rookies in Share of Predicted Air Yards, meaning that his targets are going to be far more valuable when they become receptions. Tetairoa also leads all rookies in Actual WOPR (a Target Share and Air Yards share composite), showing that his ability to get open downfield is already translating into real opportunity. McMillan fields the best overall PFF grade amongst rookies with a 73.9 (WR15 overall, min. 15 targets).
Travis Hunter might be the most disappointing player to see on this list with a 15.97% Share of Predicted Targets and a fairly low 15.17% Share of Predicted Air Yards. This is the worst combination of Share of Predicted Targets and Share of Predicted air yards for any top-10 pick at wide receiver in the available data going back to 2019, not to mention the seventh-worst for a first-round pick at wide receiver. Hunter is a unique case, as he splits his time on offense and defense and can still be an incredibly valuable NFL player if he isn’t playing wide receiver. Hunter holds a 55.3 receiving PFF grade (71st overall, min. 15 targets) and a 66.0 PFF coverage grade (42nd overall, min. 15 coverage snaps). With Hunter's snaps increasing on defense, it could be a long season for his fantasy outlook.
Colston Loveland is the most surprising name on this list. He is only earning 7.74% of his team’s Share of Predicted Targets. This is far below expectation for the 10th overall pick. Loveland has a 56.2 PFF receiving grade, which is the third-worst for a rookie tight end this season.
Week 3 “Coach, I Was Open” Table Recap
- Ladd McConkey: 7 targets for a 15.22% Target Share
- Emeka Egbuka: 8 targets for a 28.57% Target Share
- Kyle Pitts: 6 targets for a 14.63% Target Share
- CeeDee Lamb: Injured
- Tre Tucker: 9 targets for a 33.33% Target Share
- Deebo Samuel: 3 targets for a 16.67% Target Share
- Drake London: 8 targets for a 19.51% Target Share
- Dont'e Thornton: 4 targets for a 14.81% Target Share
- Calvin Austin III: 5 targets for a 22.73% Target Share
- Jahan Dotson: 3 targets for a 10% Target Share
- Kayshon Boutte: 3 targets for an 8.3% Target Share
- Tyler Johnson: 3 targets for an 8.57% Target Share
- Darius Slayton: 4 targets for a 14.33% Target Share
- Zay Jones: 3 targets for an 8.82% Target Share
Week 4 Potential Breakouts
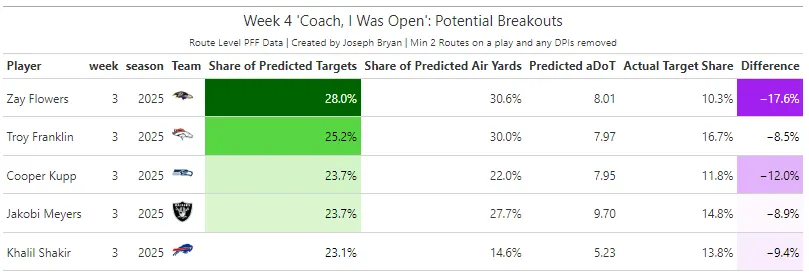
Two weeks ago, Kyle Pitts had the best Share of Predicted Targets in his career. He followed that up with a 20% Share of Predicted Targets in Week 3. His 14% Actual Target Share underperformed that again, but it wasn’t enough to earn him a spot on this week’s list. I would still keep an eye for him this week against the Commanders, who have struggled to defend tight ends this year.
The list this week is short and sweet. Zay Flowers was in a great matchup last week, and was seemingly open, but the Ravens weren’t able to make the connection work. Troy Franklin has been quietly breaking out, and Jakobi Meyers is a staple of this list each week.
Week 3 Review
Lamar Jackson took seven sacks in Week 3, but the Lions had the eighth-worst quick pressure rate in the NFL and the fourth-highest average time to pressure. These were not sacks caused by immense pressure.
On the play below, Jackson had his choice between two wide open receivers: One on a quick screen to the left, and Zay Flowers on a deep slant that was wide open.
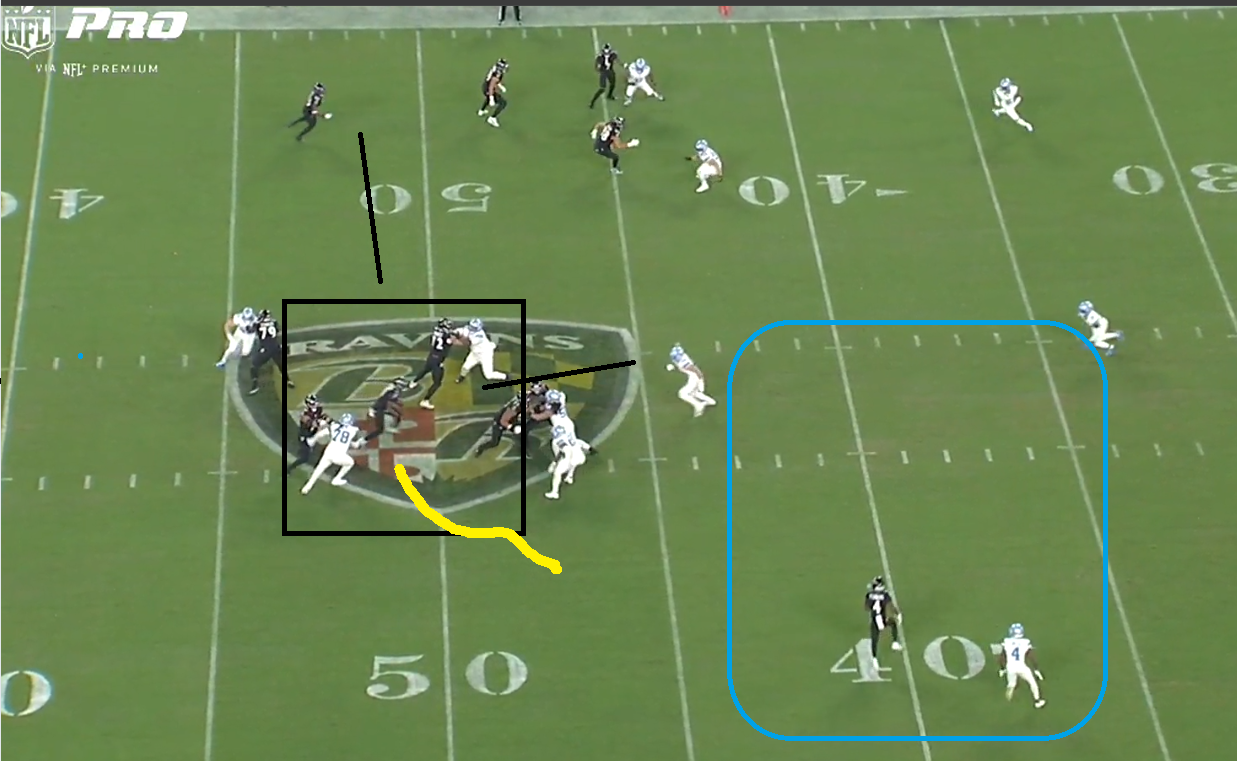
Instead of throwing the ball at all, Jackson ran toward the line of scrimmage and got tackled for no gain. This would have been a gain of 10 or more yards, and could have been a huge play if Flowers forced a missed tackle or two. Flowers had a 50% chance of being targeted on this play.
The Chargers were losing by 7 with 3:25 left in the fourth quarter. On 1st-and-10, Justin Herbert immediately threw it to his first read, Keenan Allen, for a gain of four yards.
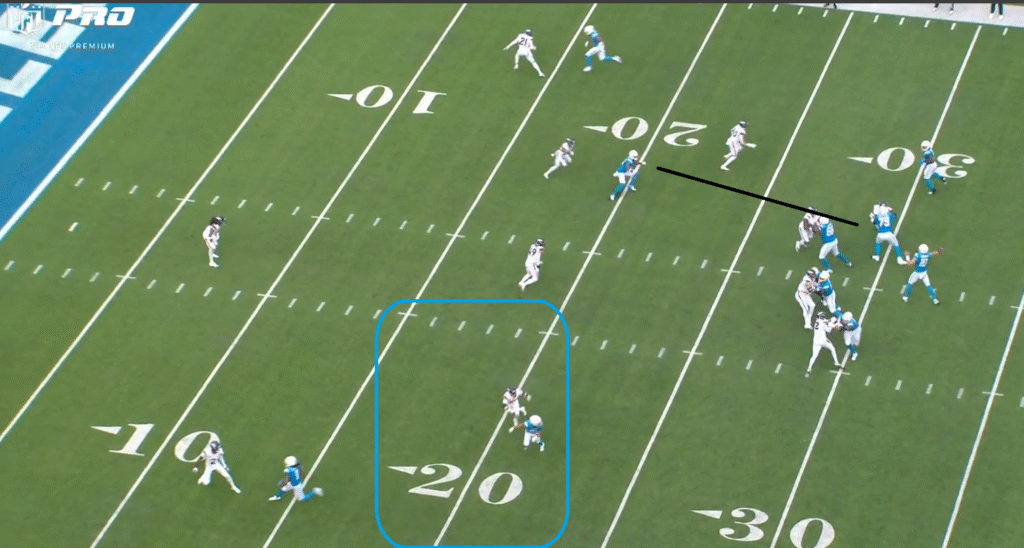
Ladd McConkey ran a quick out route and beat his man, earning a .5 PFF grade on the route itself. Herbert never looked his way on what could have been a gain of much more than four yards. McConkey had a blocker in Quentin Johnston, had a step of separation and would have likely boasted the speed gain more than four yards. McConkey had a 54% chance of being targeted on this play.
QUARTERBACK DECISIONS IN WEEK 3
The Predicted Targets Model allows us to evaluate a quarterback’s performance over a single game, a series of games or even an entire season. This model analyzes every route on every play, calculating the probability that a given player will be targeted based on factors such as openness, PFF grade, level of separation and more. By leveraging this route-level data, we can determine whether the quarterback made an optimal decision.
To simplify the analysis, I categorized every decision into three distinct categories:
1. Optimal Decision: The quarterback threw to the player with the highest target probability.
2. Suboptimal Decision: The quarterback threw to a player who did not have the highest target probability.
3. Bad Decision: The quarterback threw to the player with the lowest target probability.
It’s important to note that these categorizations are based on the model’s quantifications and may not always align perfectly with real-world outcomes. For example, Jalen Hurts might throw a 25-yard jump ball to A.J. Brown. While the model might label this as a suboptimal decision based on Brown’s openness, the context — such as Brown’s talent — might make it a good choice.
Example Play
Let’s break down a hypothetical play, where four players ran routes with the following target probabilities:
- A.J. Brown: 74.5% — Optimal Decision
- DeVonta Smith: 17.2% — Suboptimal Decision
- Saquon Barkley: 13.7% — Suboptimal Decision
- Dallas Goedert: 12.8% — Suboptimal & Bad Decision
If Jalen Hurts were to throw to each of these players, the corresponding decision category is shown above. I applied this process to every route on every play, aggregating the data into the table below for broader insights.
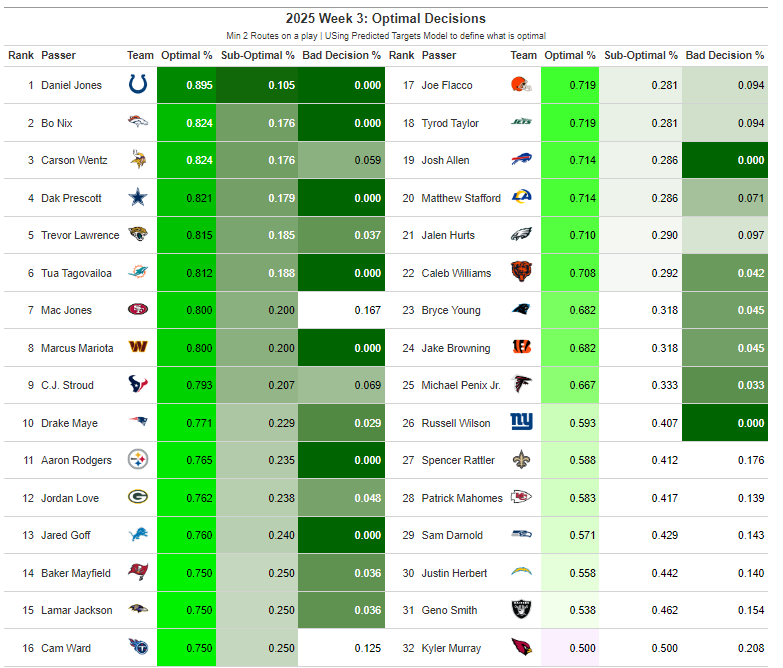
Daniel Jones made the most optimal decisions in Week 3 while making zero “Bad Decisions.” Quarterbacks with incredible arm talent like Justin Herbert might be able to make throws that Daniel Jones cannot, thus creating an open receiver or more optimal choice, whereas a standard quarterback might not be able to do so.
Kyler Murray made the game harder on himself, as he led the NFL in Week 3 with the highest rate of outright bad decisions. Had he made more optimal decisions, the Cardinals might have won.
