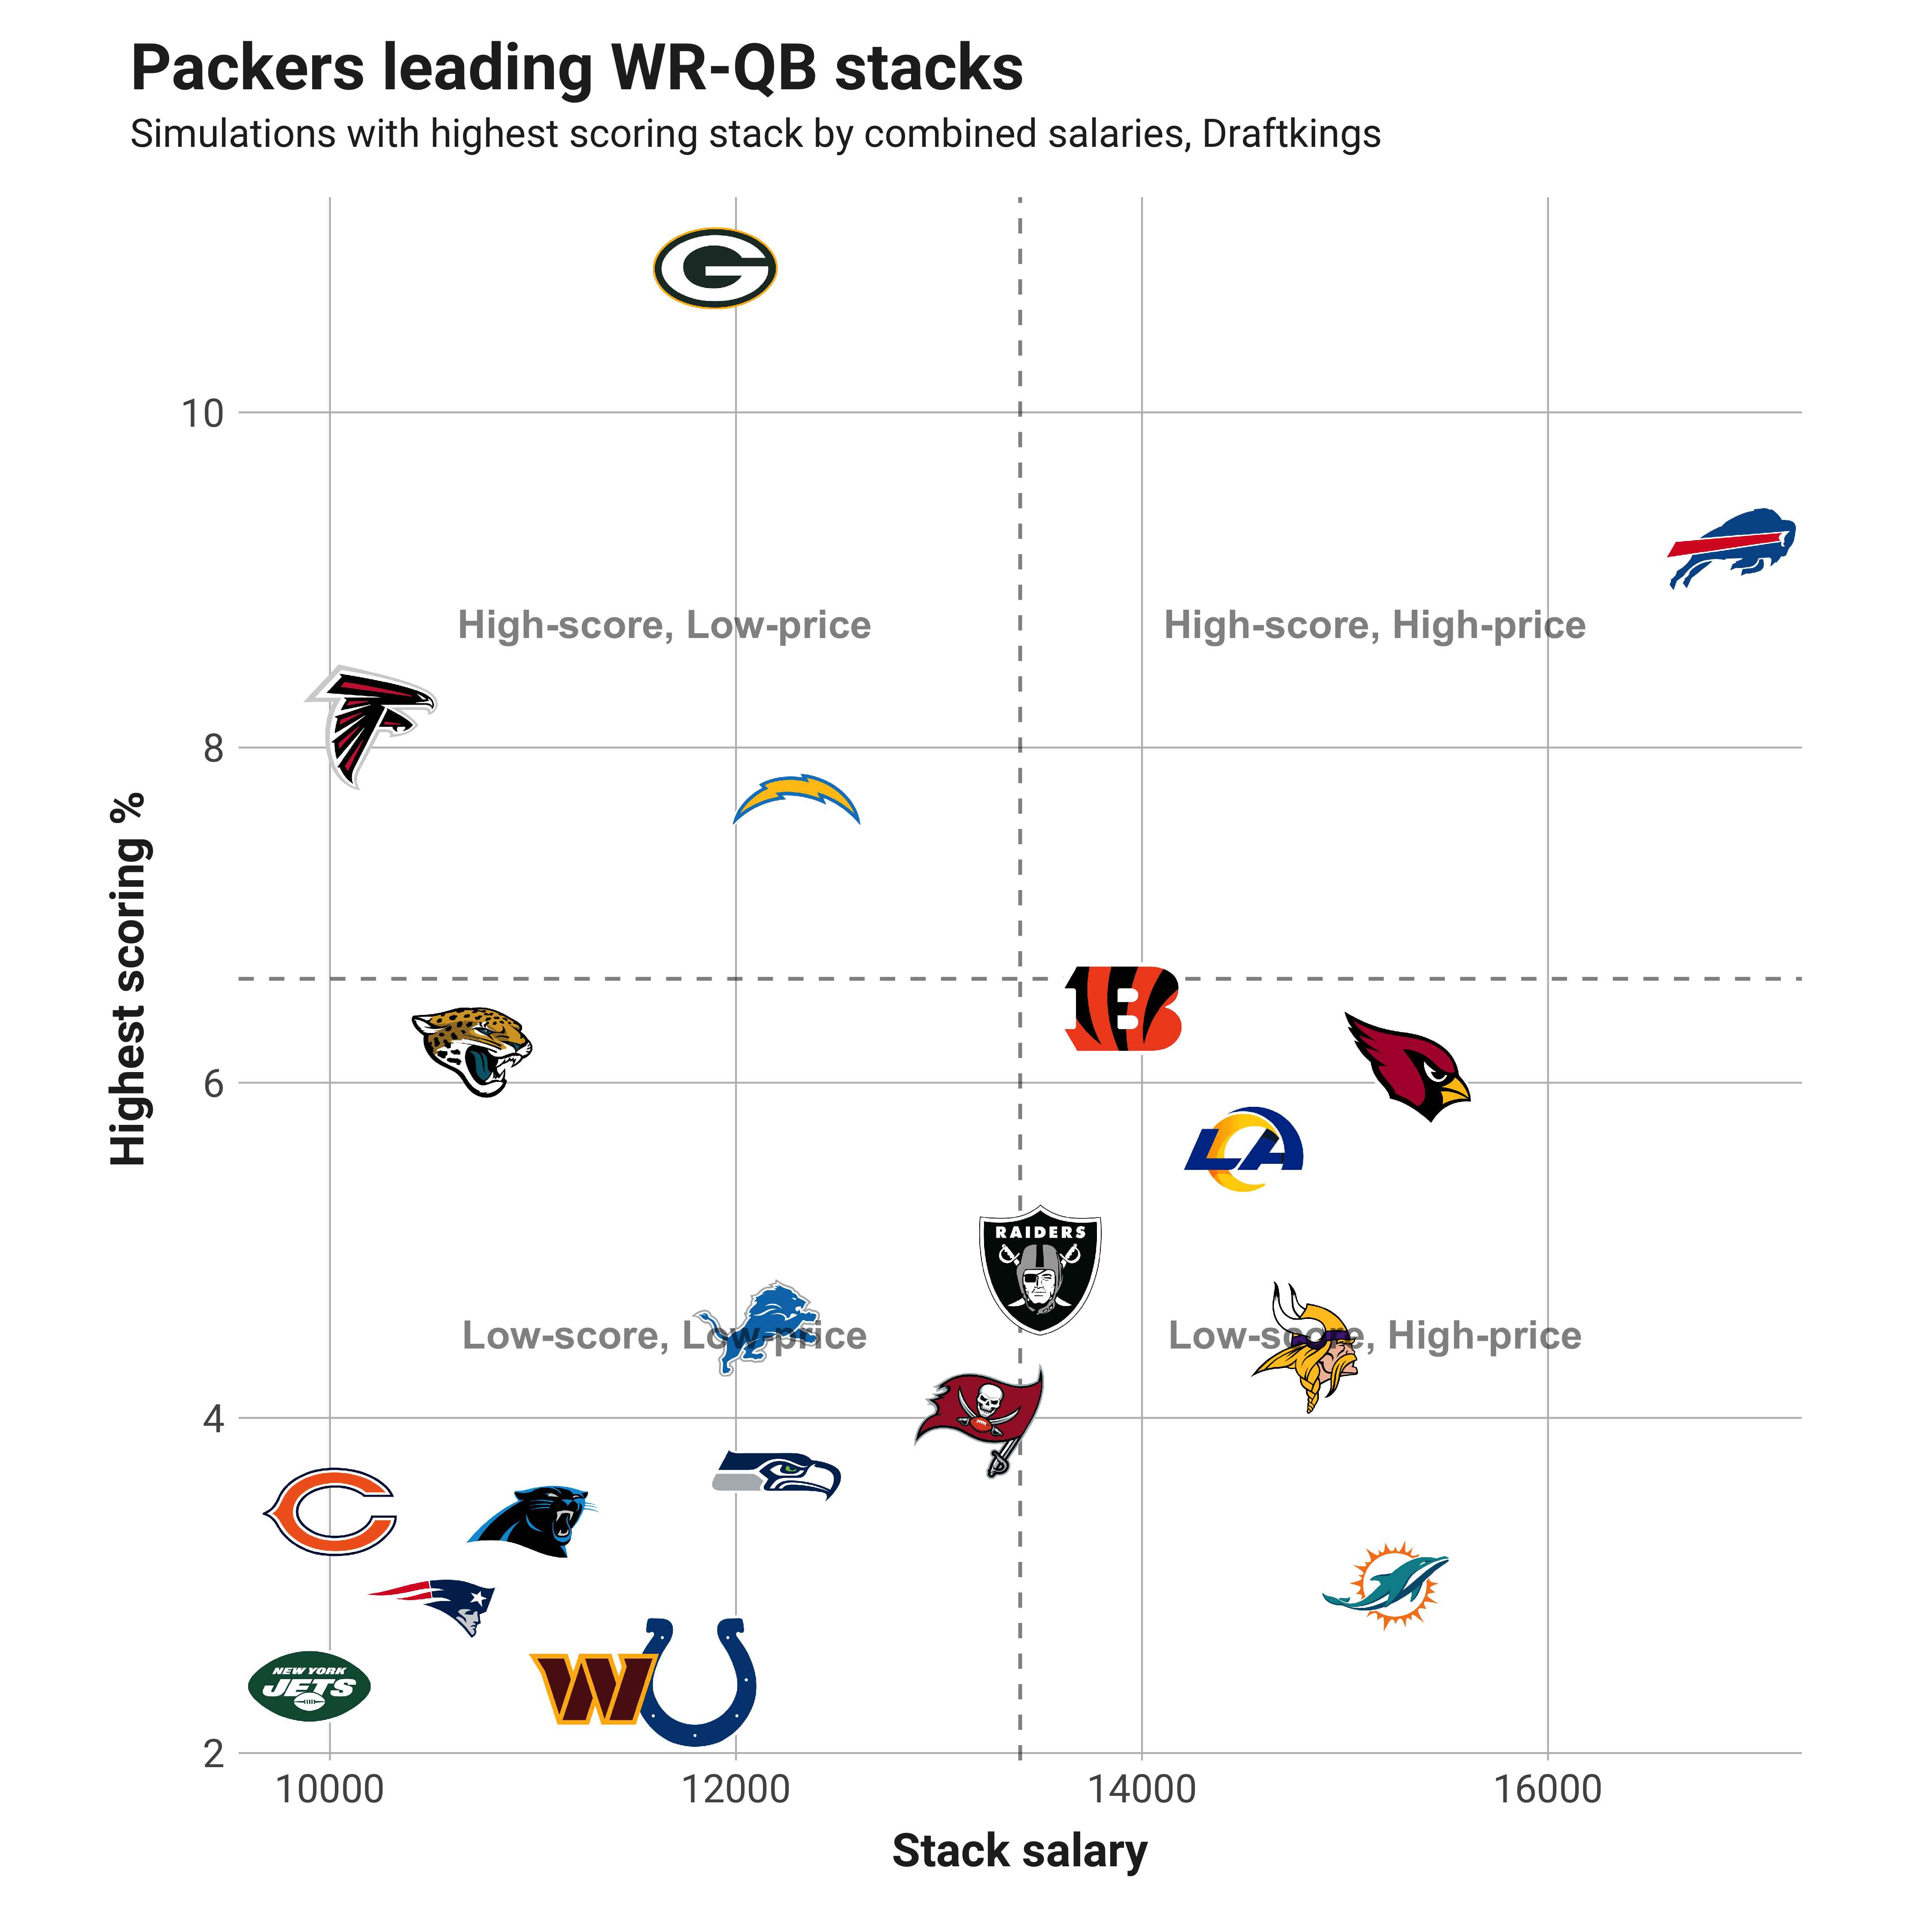
- Stack the Packers: The combination of the Green Bay Packers‘ Aaron Rodgers and Allen Lazard is projected to be the top stack this week with relatively affordable combined salaries.
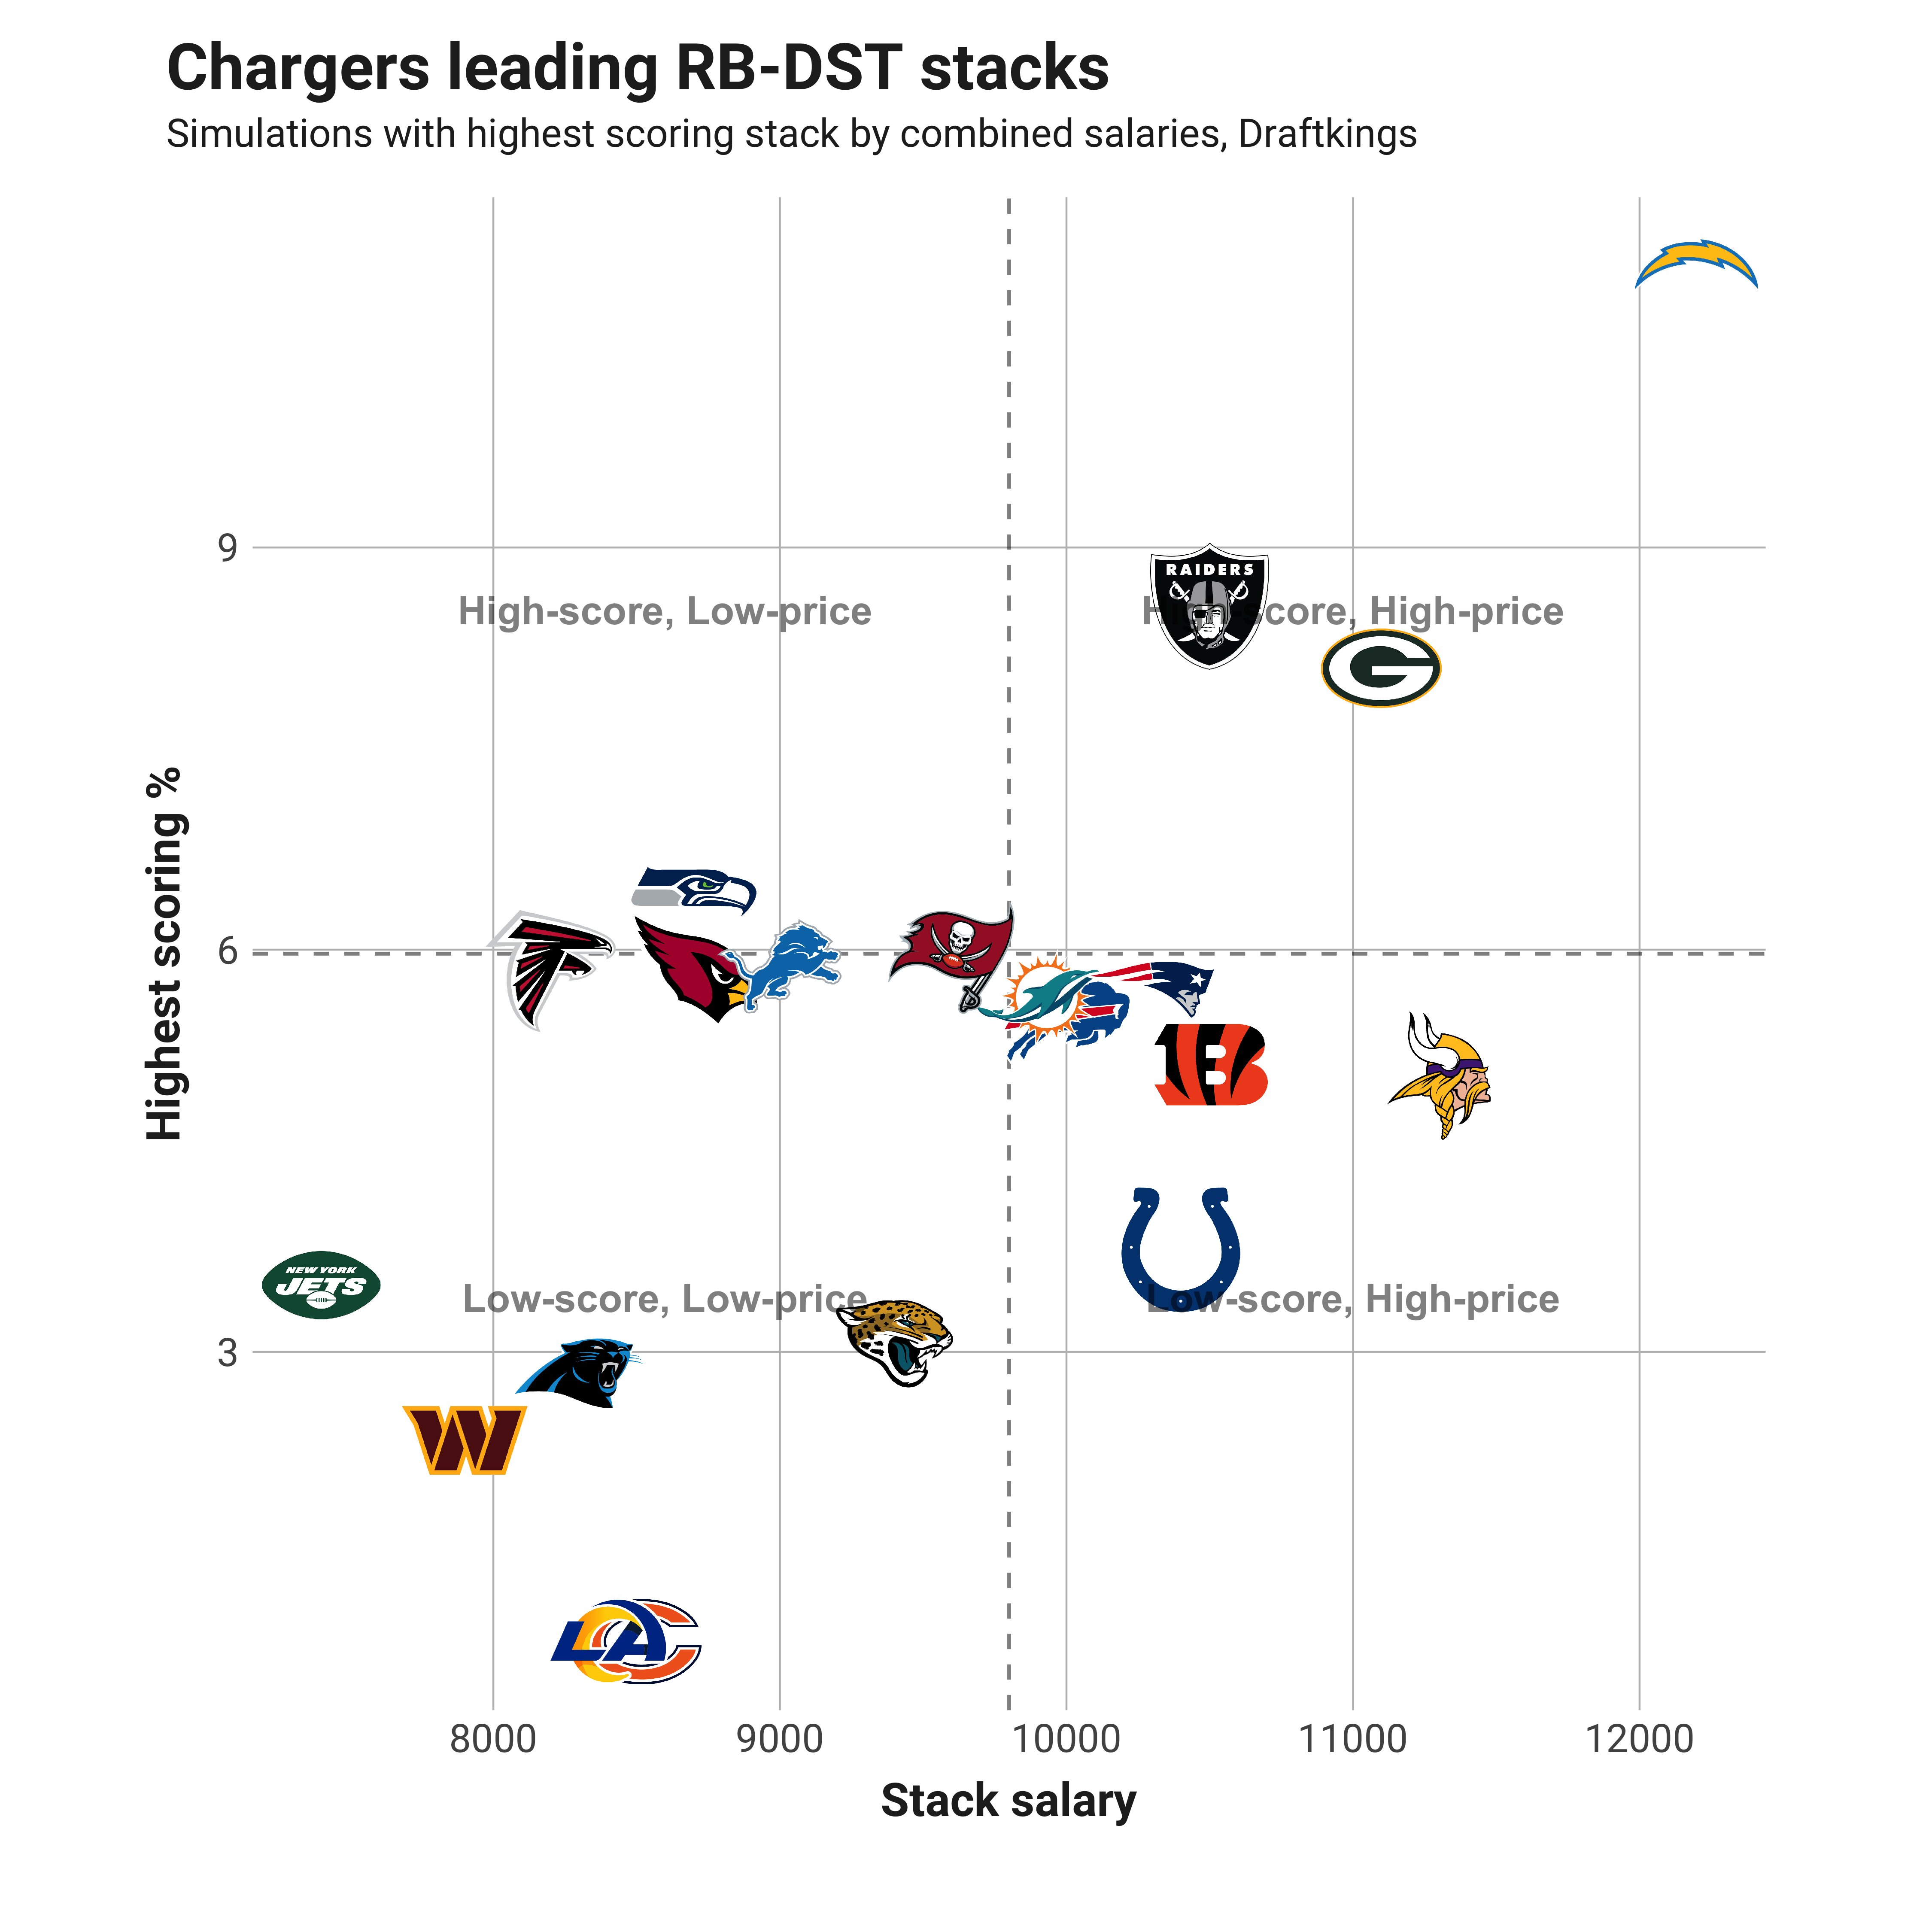
- High-upside RB-DST stack for Week 7: The Las Vegas Raiders have a high chance of being the highest-scoring RB-DST stack at a lower cost.
Estimated reading time: 8 minutes
This DFS main-slate stacks analysis is a variation of the methodology used in analyses on the single-game DraftKings showdown slates. It uses the combination of current projections, historical game results and similarity algorithms to simulate an upcoming game by looking back at the most similar historical matchups. In this analysis, I’m taking the same outline and applying it instead to the DFS main slate by projecting the likelihood each team’s QB-WR, RB-DST, QB-WR-TE, QB-RB-WR stacks will be the highest scoring of the slate. These are some of the most popular stack combinations employed in DFS strategy.
The numbers below harness the unexpected connections and reactions between players that have happened over the past several years and thereby point to under/overvalued stacks that won’t be identified through traditional projections and logical deduction.

QUARTERBACK/WIDE RECEIVER STACK
QB/WR players
| Team | Opponent | Highest % | Player | Pos | DK Fpts | DK Salary | FD Fpts | FD Salary |
| GB | DET | 10.9 | Aaron Rodgers | QB | 23.6 | 5,900 | 22.2 | 7,000 |
| GB | DET | 10.9 | Allen Lazard | WR | 13.6 | 6,000 | 11.1 | 6,500 |
| BUF | NYJ | 9.2 | Josh Allen | QB | 26.3 | 8,500 | 24.7 | 9,300 |
| BUF | NYJ | 9.2 | Stefon Diggs | WR | 17.8 | 8,400 | 14.0 | 8,900 |
| ATL | LAC | 8.1 | Marcus Mariota | QB | 21.0 | 5,300 | 19.6 | 7,100 |
| ATL | LAC | 8.1 | Drake London | WR | 15.9 | 4,900 | 12.5 | 5,600 |
| LAC | ATL | 7.7 | Justin Herbert | QB | 22.6 | 7,200 | 21.2 | 7,800 |
| LAC | ATL | 7.7 | Josh Palmer | WR | 12.5 | 5,100 | 9.9 | 6,200 |
| CIN | CAR | 6.4 | Joe Burrow | QB | 22.8 | 6,600 | 21.3 | 8,500 |
| CIN | CAR | 6.4 | Tee Higgins | WR | 19.7 | 7,300 | 15.7 | 8,000 |
| JAX | LV | 6.2 | Trevor Lawrence | QB | 17.9 | 5,200 | 16.6 | 6,800 |
| JAX | LV | 6.2 | Christian Kirk | WR | 13.7 | 5,500 | 10.9 | 6,300 |
| ARZ | SEA | 6.1 | Kyler Murray | QB | 22.8 | 7,400 | 21.5 | 8,200 |
| ARZ | SEA | 6.1 | DeAndre Hopkins | WR | 19.5 | 7,900 | 15.2 | 8,600 |
| LA | TB | 5.6 | Matthew Stafford | QB | 18.2 | 5,600 | 16.9 | 6,700 |
| LA | TB | 5.6 | Cooper Kupp | WR | 21.1 | 8,900 | 16.3 | 9,000 |
| LV | JAX | 4.9 | Derek Carr | QB | 19.0 | 5,400 | 17.6 | 6,800 |
| LV | JAX | 4.9 | Davante Adams | WR | 17.9 | 8,100 | 14.0 | 8,100 |
| DET | GB | 4.5 | Jared Goff | QB | 15.1 | 5,500 | 14.2 | 7,100 |
| DET | GB | 4.5 | Amon-Ra St. Brown | WR | 14.7 | 6,600 | 11.2 | 7,100 |
| MIN | WAS | 4.4 | Kirk Cousins | QB | 17.9 | 6,200 | 16.7 | 7,900 |
| MIN | WAS | 4.4 | Justin Jefferson | WR | 18.8 | 8,600 | 14.8 | 9,000 |
| TB | LA | 4.0 | Tom Brady | QB | 22.0 | 6,000 | 20.2 | 6,900 |
| TB | LA | 4.0 | Mike Evans | WR | 19.2 | 7,200 | 15.2 | 7,700 |
| SEA | ARZ | 3.7 | Geno Smith | QB | 19.9 | 5,800 | 18.5 | 7,500 |
| SEA | ARZ | 3.7 | D.K. Metcalf | WR | 15.7 | 6,400 | 12.6 | 7,400 |
| CHI | MIA | 3.4 | Justin Fields | QB | 17.6 | 5,300 | 16.4 | 7,400 |
| CHI | MIA | 3.4 | Darnell Mooney | WR | 11.2 | 4,700 | 8.9 | 6,100 |
| CAR | CIN | 3.4 | P.J. Walker | QB | 15.4 | 5,200 | 14.3 | 6,500 |
| CAR | CIN | 3.4 | D.J. Moore | WR | 18.1 | 5,800 | 14.0 | 7,000 |
| MIA | CHI | 3.0 | Tua Tagovailoa | QB | 21.8 | 6,700 | 20.3 | 8,000 |
| MIA | CHI | 3.0 | Tyreek Hill | WR | 23.2 | 8,500 | 18.1 | 8,700 |
| NE | IND | 2.9 | Mac Jones | QB | 17.1 | 5,100 | 16.1 | 6,400 |
| NE | IND | 2.9 | Jakobi Meyers | WR | 13.2 | 5,400 | 10.3 | 6,800 |
| IND | NE | 2.4 | Sam Ehlinger | QB | 15.9 | 5,000 | 15.0 | 6,300 |
| IND | NE | 2.4 | Michael Pittman Jr. | WR | 12.6 | 6,800 | 9.8 | 6,400 |
| NYJ | BUF | 2.4 | Zach Wilson | QB | 14.8 | 5,100 | 14.0 | 6,600 |
| NYJ | BUF | 2.4 | Garrett Wilson | WR | 12.9 | 4,800 | 10.2 | 5,800 |
| WAS | MIN | 2.4 | Taylor Heinicke | QB | 16.9 | 5,400 | 15.9 | 7,200 |
| WAS | MIN | 2.4 | Terry McLaurin | WR | 13.5 | 5,900 | 10.6 | 7,200 |
RUNNING BACK/DST
RB/DST players
| Team | Opponent | Highest % | Player | Pos | DK Fpts | DK Salary | FD Fpts | FD Salary |
| LAC | ATL | 11.1 | Austin Ekeler | RB | 18.5 | 8,800 | 15.6 | 9,400 |
| LAC | ATL | 11.1 | Chargers DST | DST | 6.5 | 3,400 | 6.5 | 3,900 |
| LV | JAX | 8.6 | Josh Jacobs | RB | 16.4 | 7,300 | 14.4 | 8,800 |
| LV | JAX | 8.6 | Raiders DST | DST | 6.7 | 3,200 | 6.7 | 3,500 |
| GB | DET | 8.1 | Aaron Jones | RB | 16.0 | 7,400 | 14.0 | 7,800 |
| GB | DET | 8.1 | Packers DST | DST | 7.1 | 3,700 | 7.1 | 4,100 |
| SEA | ARZ | 6.4 | Kenneth Walker III | RB | 16.4 | 6,200 | 14.4 | 8,300 |
| SEA | ARZ | 6.4 | Seahawks DST | DST | 6.2 | 2,500 | 6.2 | 4,100 |
| TB | LA | 5.9 | Leonard Fournette | RB | 12.7 | 6,600 | 11.1 | 7,100 |
| TB | LA | 5.9 | Buccaneers DST | DST | 6.8 | 3,000 | 6.8 | 4,700 |
| DET | GB | 5.9 | D'Andre Swift | RB | 14.3 | 6,400 | 12.1 | 7,500 |
| DET | GB | 5.9 | Lions DST | DST | 3.5 | 2,600 | 3.5 | 3,200 |
| ARZ | SEA | 5.9 | James Conner | RB | 11.1 | 5,800 | 9.8 | 6,600 |
| ARZ | SEA | 5.9 | Cardinals DST | DST | 7.3 | 2,900 | 7.3 | 4,000 |
| ATL | LAC | 5.8 | Tyler Allgeier | RB | 9.9 | 5,400 | 8.9 | 6,400 |
| ATL | LAC | 5.8 | Falcons DST | DST | 5.4 | 2,800 | 5.4 | 3,100 |
| NE | IND | 5.7 | Rhamondre Stevenson | RB | 14.0 | 6,200 | 12.4 | 8,000 |
| NE | IND | 5.7 | Patriots DST | DST | 7.7 | 4,100 | 7.7 | 4,900 |
| MIA | CHI | 5.6 | Raheem Mostert | RB | 14.4 | 6,100 | 12.6 | 6,500 |
| MIA | CHI | 5.6 | Dolphins DST | DST | 9.6 | 3,800 | 9.6 | 3,600 |
| BUF | NYJ | 5.5 | Devin Singletary | RB | 9.5 | 5,700 | 8.5 | 6,000 |
| BUF | NYJ | 5.5 | Bills DST | DST | 8.8 | 4,300 | 8.8 | 5,000 |
| CIN | CAR | 5.1 | Joe Mixon | RB | 17.6 | 6,500 | 15.2 | 8,100 |
| CIN | CAR | 5.1 | Bengals DST | DST | 10.6 | 4,000 | 10.6 | 4,400 |
| MIN | WAS | 5.1 | Dalvin Cook | RB | 18.4 | 7,800 | 15.8 | 8,500 |
| MIN | WAS | 5.1 | Vikings DST | DST | 7.6 | 3,500 | 7.6 | 4,500 |
| IND | NE | 3.8 | Jonathan Taylor | RB | 16.7 | 7,700 | 14.5 | 6,800 |
| IND | NE | 3.8 | Colts DST | DST | 6.7 | 2,700 | 6.7 | 4,200 |
| NYJ | BUF | 3.5 | James Robinson | RB | 8.0 | 5,400 | 7.1 | 6,000 |
| NYJ | BUF | 3.5 | Jets DST | DST | 5.2 | 2,000 | 5.2 | 3,400 |
| JAX | LV | 3.1 | Travis Etienne | RB | 15.3 | 6,300 | 13.3 | 7,600 |
| JAX | LV | 3.1 | Jaguars DST | DST | 5.7 | 3,100 | 5.7 | 3,800 |
| CAR | CIN | 2.8 | D'Onta Foreman | RB | 10.4 | 6,000 | 9.3 | 7,300 |
| CAR | CIN | 2.8 | Panthers DST | DST | 5.4 | 2,300 | 5.4 | 3,300 |
| WAS | MIN | 2.3 | Antonio Gibson | RB | 10.7 | 5,500 | 9.3 | 6,100 |
| WAS | MIN | 2.3 | Commanders DST | DST | 5.8 | 2,400 | 5.8 | 3,700 |
| CHI | MIA | 0.8 | David Montgomery | RB | 10.1 | 6,000 | 9.0 | 7,000 |
| LA | TB | 0.8 | Darrell Henderson | RB | 12.0 | 5,100 | 10.7 | 5,700 |
| CHI | MIA | 0.8 | Bears DST | DST | 5.6 | 2,500 | 5.6 | 3,000 |
| LA | TB | 0.8 | Rams DST | DST | 4.3 | 3,300 | 4.3 | 4,300 |
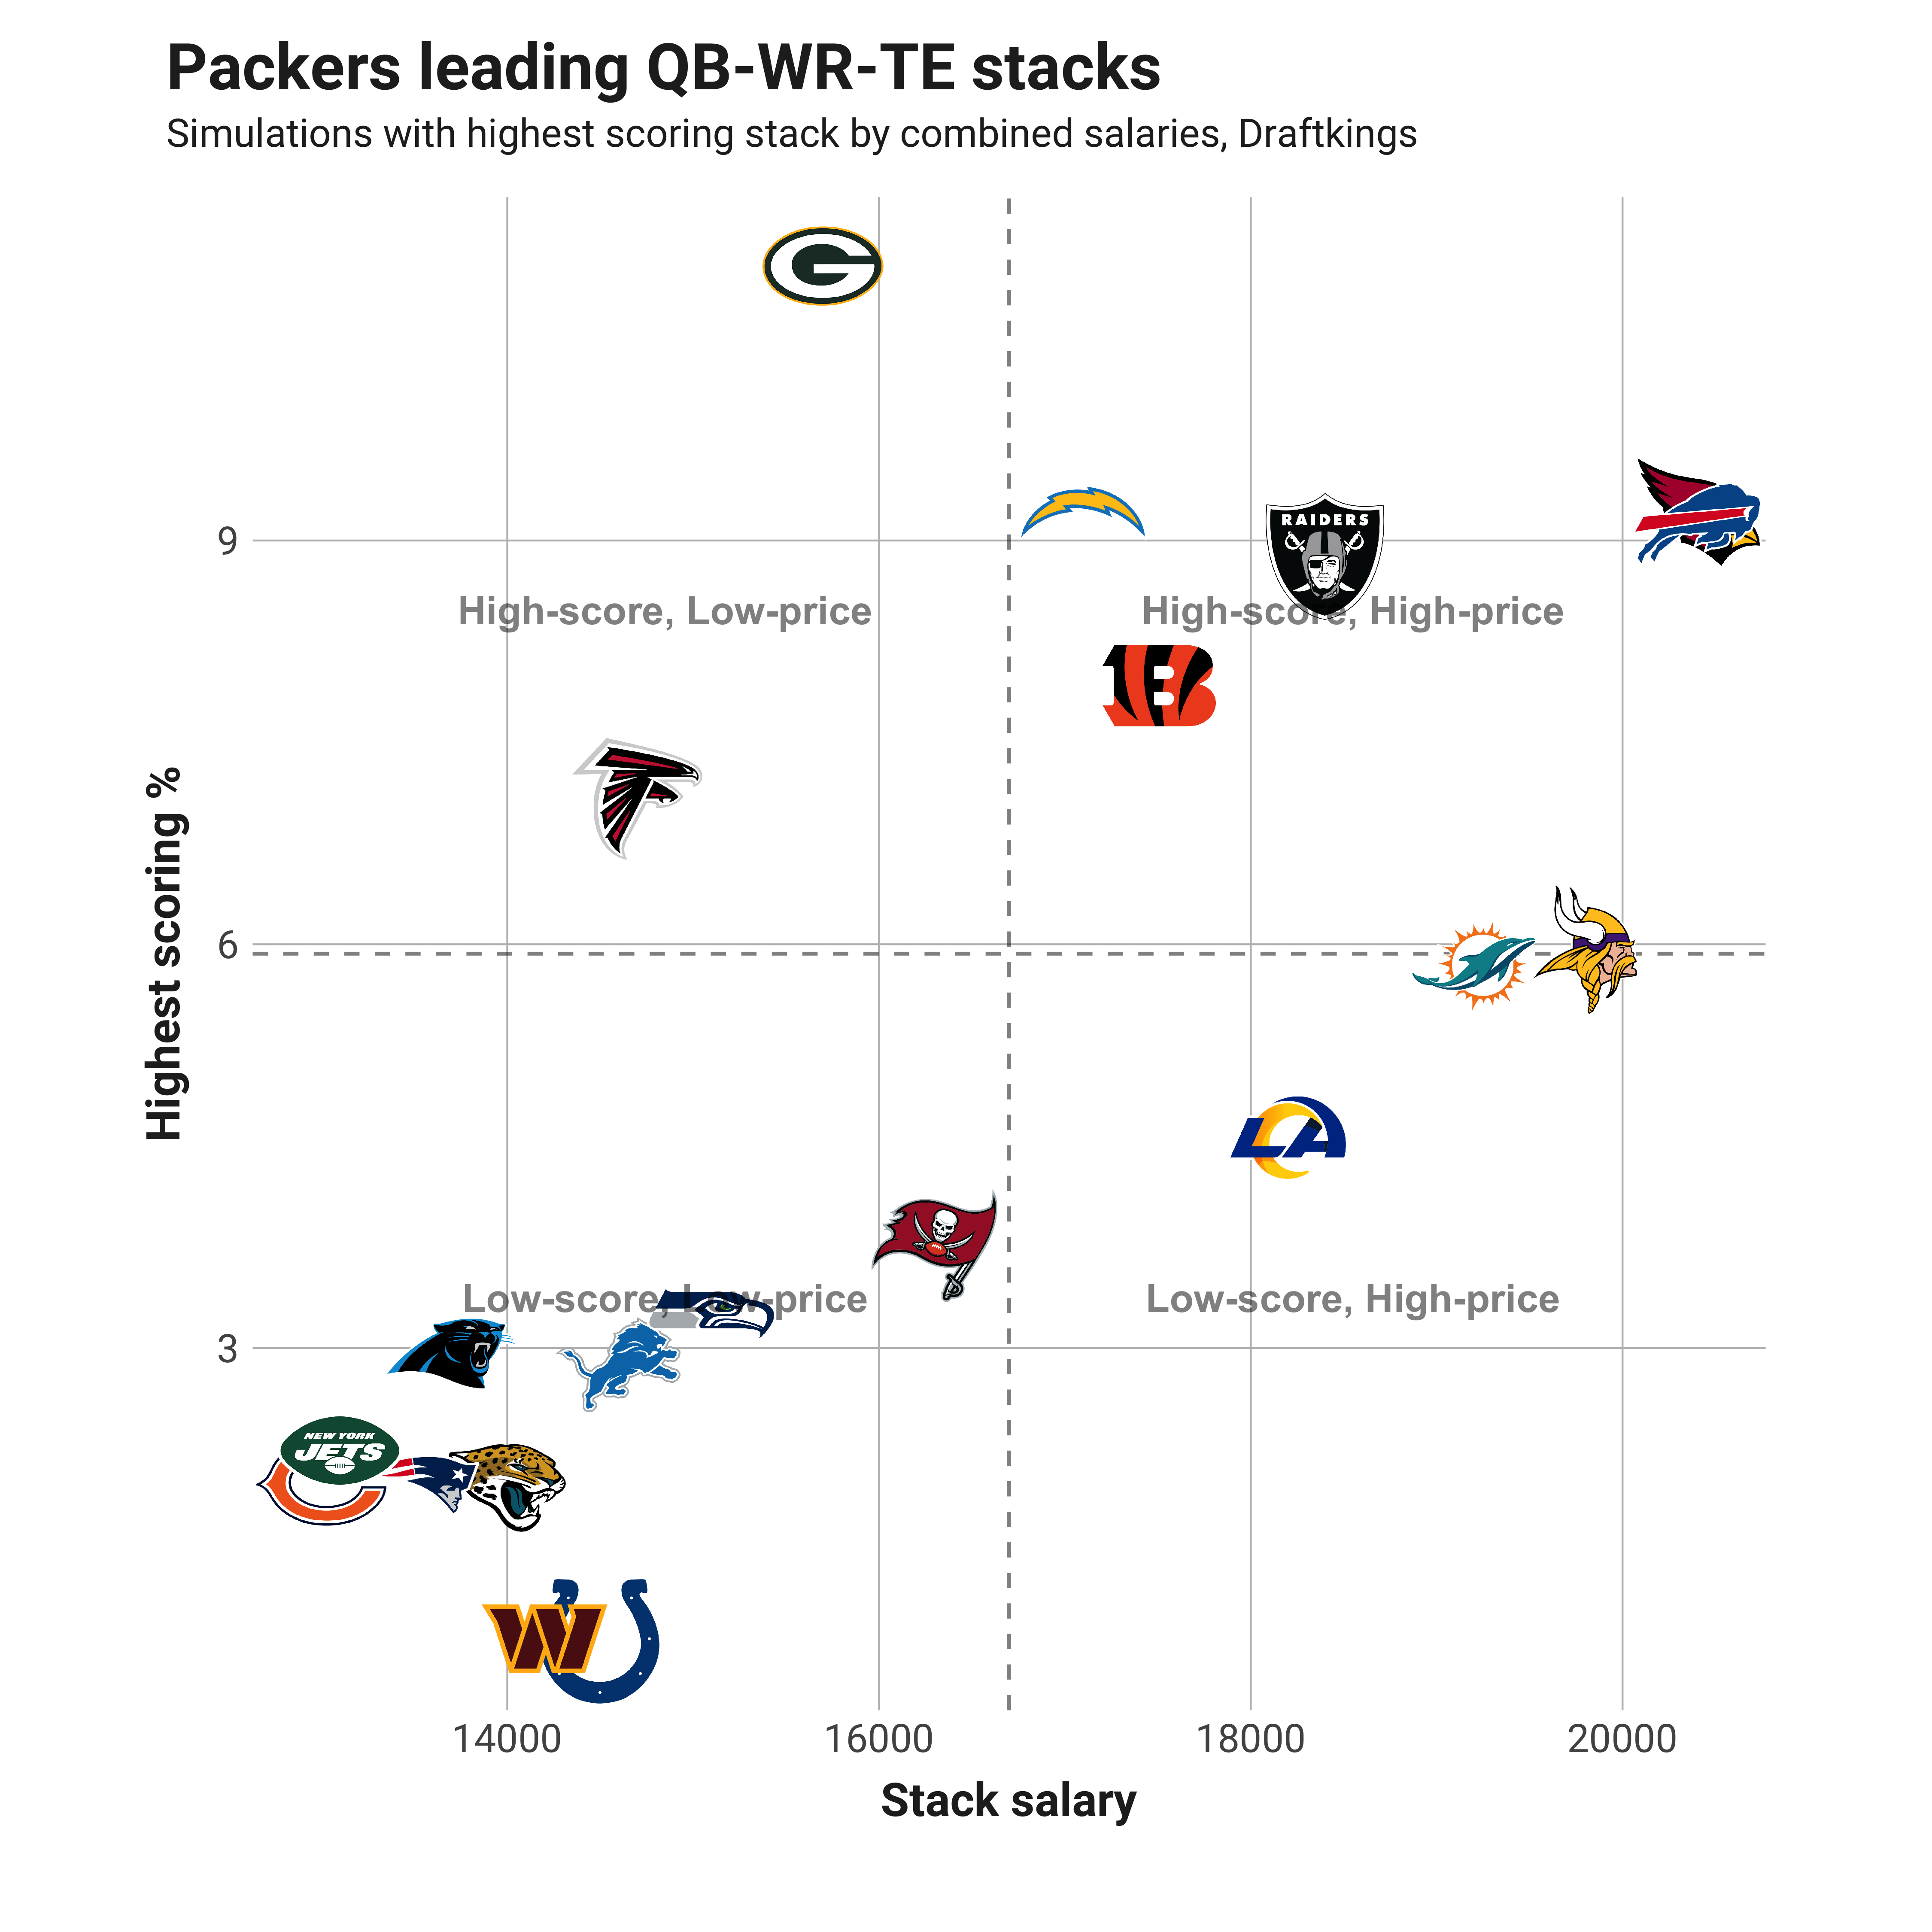
QUARTERBACK/WIDE RECEIVER/TIGHT END
QB/WR/TE players
| Team | Opponent | Highest % | Player | Pos | DK Fpts | DK Salary | FD Fpts | FD Salary |
| GB | DET | 11.0 | Aaron Rodgers | QB | 23.6 | 5,900 | 22.2 | 7,000 |
| GB | DET | 11.0 | Allen Lazard | WR | 13.6 | 6,000 | 11.1 | 6,500 |
| GB | DET | 11.0 | Robert Tonyan | TE | 11.3 | 3,800 | 9.0 | 5,000 |
| ARZ | SEA | 9.2 | Kyler Murray | QB | 22.8 | 7,400 | 21.5 | 8,200 |
| ARZ | SEA | 9.2 | DeAndre Hopkins | WR | 19.5 | 7,900 | 15.2 | 8,600 |
| ARZ | SEA | 9.2 | Zach Ertz | TE | 10.6 | 5,100 | 8.3 | 6,600 |
| LAC | ATL | 9.2 | Justin Herbert | QB | 22.6 | 7,200 | 21.2 | 7,800 |
| LAC | ATL | 9.2 | Josh Palmer | WR | 12.5 | 5,100 | 9.9 | 6,200 |
| LAC | ATL | 9.2 | Gerald Everett | TE | 12.4 | 4,800 | 9.8 | 5,800 |
| BUF | NYJ | 9.1 | Josh Allen | QB | 26.3 | 8,500 | 24.7 | 9,300 |
| BUF | NYJ | 9.1 | Stefon Diggs | WR | 17.8 | 8,400 | 14.0 | 8,900 |
| BUF | NYJ | 9.1 | Dawson Knox | TE | 10.2 | 3,500 | 8.2 | 5,100 |
| LV | JAX | 8.9 | Derek Carr | QB | 19.0 | 5,400 | 17.6 | 6,800 |
| LV | JAX | 8.9 | Davante Adams | WR | 17.9 | 8,100 | 14.0 | 8,100 |
| LV | JAX | 8.9 | Darren Waller | TE | 10.0 | 4,900 | 7.9 | 6,000 |
| CIN | CAR | 7.9 | Joe Burrow | QB | 22.8 | 6,600 | 21.3 | 8,500 |
| CIN | CAR | 7.9 | Tee Higgins | WR | 19.7 | 7,300 | 15.7 | 8,000 |
| CIN | CAR | 7.9 | Hayden Hurst | TE | 9.6 | 3,600 | 7.6 | 5,300 |
| ATL | LAC | 7.1 | Marcus Mariota | QB | 21.0 | 5,300 | 19.6 | 7,100 |
| ATL | LAC | 7.1 | Drake London | WR | 15.9 | 4,900 | 12.5 | 5,600 |
| ATL | LAC | 7.1 | Kyle Pitts | TE | 13.0 | 4,500 | 10.4 | 6,300 |
| MIN | WAS | 6.0 | Kirk Cousins | QB | 17.9 | 6,200 | 16.7 | 7,900 |
| MIN | WAS | 6.0 | Justin Jefferson | WR | 18.8 | 8,600 | 14.8 | 9,000 |
| MIN | WAS | 6.0 | T.J. Hockenson | TE | 9.5 | 5,000 | 7.6 | 6,200 |
| MIA | CHI | 5.8 | Tua Tagovailoa | QB | 21.8 | 6,700 | 20.3 | 8,000 |
| MIA | CHI | 5.8 | Tyreek Hill | WR | 23.2 | 8,500 | 18.1 | 8,700 |
| MIA | CHI | 5.8 | Mike Gesicki | TE | 8.0 | 4,000 | 6.5 | 5,500 |
| LA | TB | 4.6 | Matthew Stafford | QB | 18.2 | 5,600 | 16.9 | 6,700 |
| LA | TB | 4.6 | Cooper Kupp | WR | 21.1 | 8,900 | 16.3 | 9,000 |
| LA | TB | 4.6 | Tyler Higbee | TE | 11.3 | 3,700 | 8.7 | 6,100 |
| TB | LA | 3.8 | Tom Brady | QB | 22.0 | 6,000 | 20.2 | 6,900 |
| TB | LA | 3.8 | Mike Evans | WR | 19.2 | 7,200 | 15.2 | 7,700 |
| TB | LA | 3.8 | Cade Otton | TE | 7.5 | 3,100 | 6.0 | 4,800 |
| SEA | ARZ | 3.3 | Geno Smith | QB | 19.9 | 5,800 | 18.5 | 7,500 |
| SEA | ARZ | 3.3 | D.K. Metcalf | WR | 15.7 | 6,400 | 12.6 | 7,400 |
| SEA | ARZ | 3.3 | Noah Fant | TE | 7.9 | 2,900 | 6.2 | 4,800 |
| CAR | CIN | 3.0 | P.J. Walker | QB | 15.4 | 5,200 | 14.3 | 6,500 |
| CAR | CIN | 3.0 | D.J. Moore | WR | 18.1 | 5,800 | 14.0 | 7,000 |
| CAR | CIN | 3.0 | Tommy Tremble | TE | 5.3 | 2,700 | 4.2 | 4,500 |
| DET | GB | 2.9 | Jared Goff | QB | 15.1 | 5,500 | 14.2 | 7,100 |
| DET | GB | 2.9 | Amon-Ra St. Brown | WR | 14.7 | 6,600 | 11.2 | 7,100 |
| DET | GB | 2.9 | Brock Wright | TE | 8.8 | 2,500 | 6.9 | 4,400 |
| NYJ | BUF | 2.2 | Zach Wilson | QB | 14.8 | 5,100 | 14.0 | 6,600 |
| NYJ | BUF | 2.2 | Garrett Wilson | WR | 12.9 | 4,800 | 10.2 | 5,800 |
| NYJ | BUF | 2.2 | Tyler Conklin | TE | 6.8 | 3,200 | 5.2 | 5,200 |
| CHI | MIA | 2.0 | Justin Fields | QB | 17.6 | 5,300 | 16.4 | 7,400 |
| CHI | MIA | 2.0 | Darnell Mooney | WR | 11.2 | 4,700 | 8.9 | 6,100 |
| CHI | MIA | 2.0 | Cole Kmet | TE | 7.6 | 3,000 | 5.9 | 4,700 |
| NE | IND | 2.0 | Mac Jones | QB | 17.1 | 5,100 | 16.1 | 6,400 |
| NE | IND | 2.0 | Jakobi Meyers | WR | 13.2 | 5,400 | 10.3 | 6,800 |
| NE | IND | 2.0 | Hunter Henry | TE | 8.0 | 3,000 | 6.4 | 4,700 |
| JAX | LV | 2.0 | Trevor Lawrence | QB | 17.9 | 5,200 | 16.6 | 6,800 |
| JAX | LV | 2.0 | Christian Kirk | WR | 13.7 | 5,500 | 10.9 | 6,300 |
| JAX | LV | 2.0 | Evan Engram | TE | 9.0 | 3,300 | 7.0 | 5,200 |
| WAS | MIN | 0.8 | Taylor Heinicke | QB | 16.9 | 5,400 | 15.9 | 7,200 |
| WAS | MIN | 0.8 | Terry McLaurin | WR | 13.5 | 5,900 | 10.6 | 7,200 |
| WAS | MIN | 0.8 | Logan Thomas | TE | 6.3 | 2,900 | 5.0 | 5,000 |
| IND | NE | 0.8 | Sam Ehlinger | QB | 15.9 | 5,000 | 15.0 | 6,300 |
| IND | NE | 0.8 | Michael Pittman Jr. | WR | 12.6 | 6,800 | 9.8 | 6,400 |
| IND | NE | 0.8 | Kylen Granson | TE | 3.2 | 2,700 | 2.5 | 4,400 |
QUARTERBACK/RUNNING BACK/WIDE RECEIVER
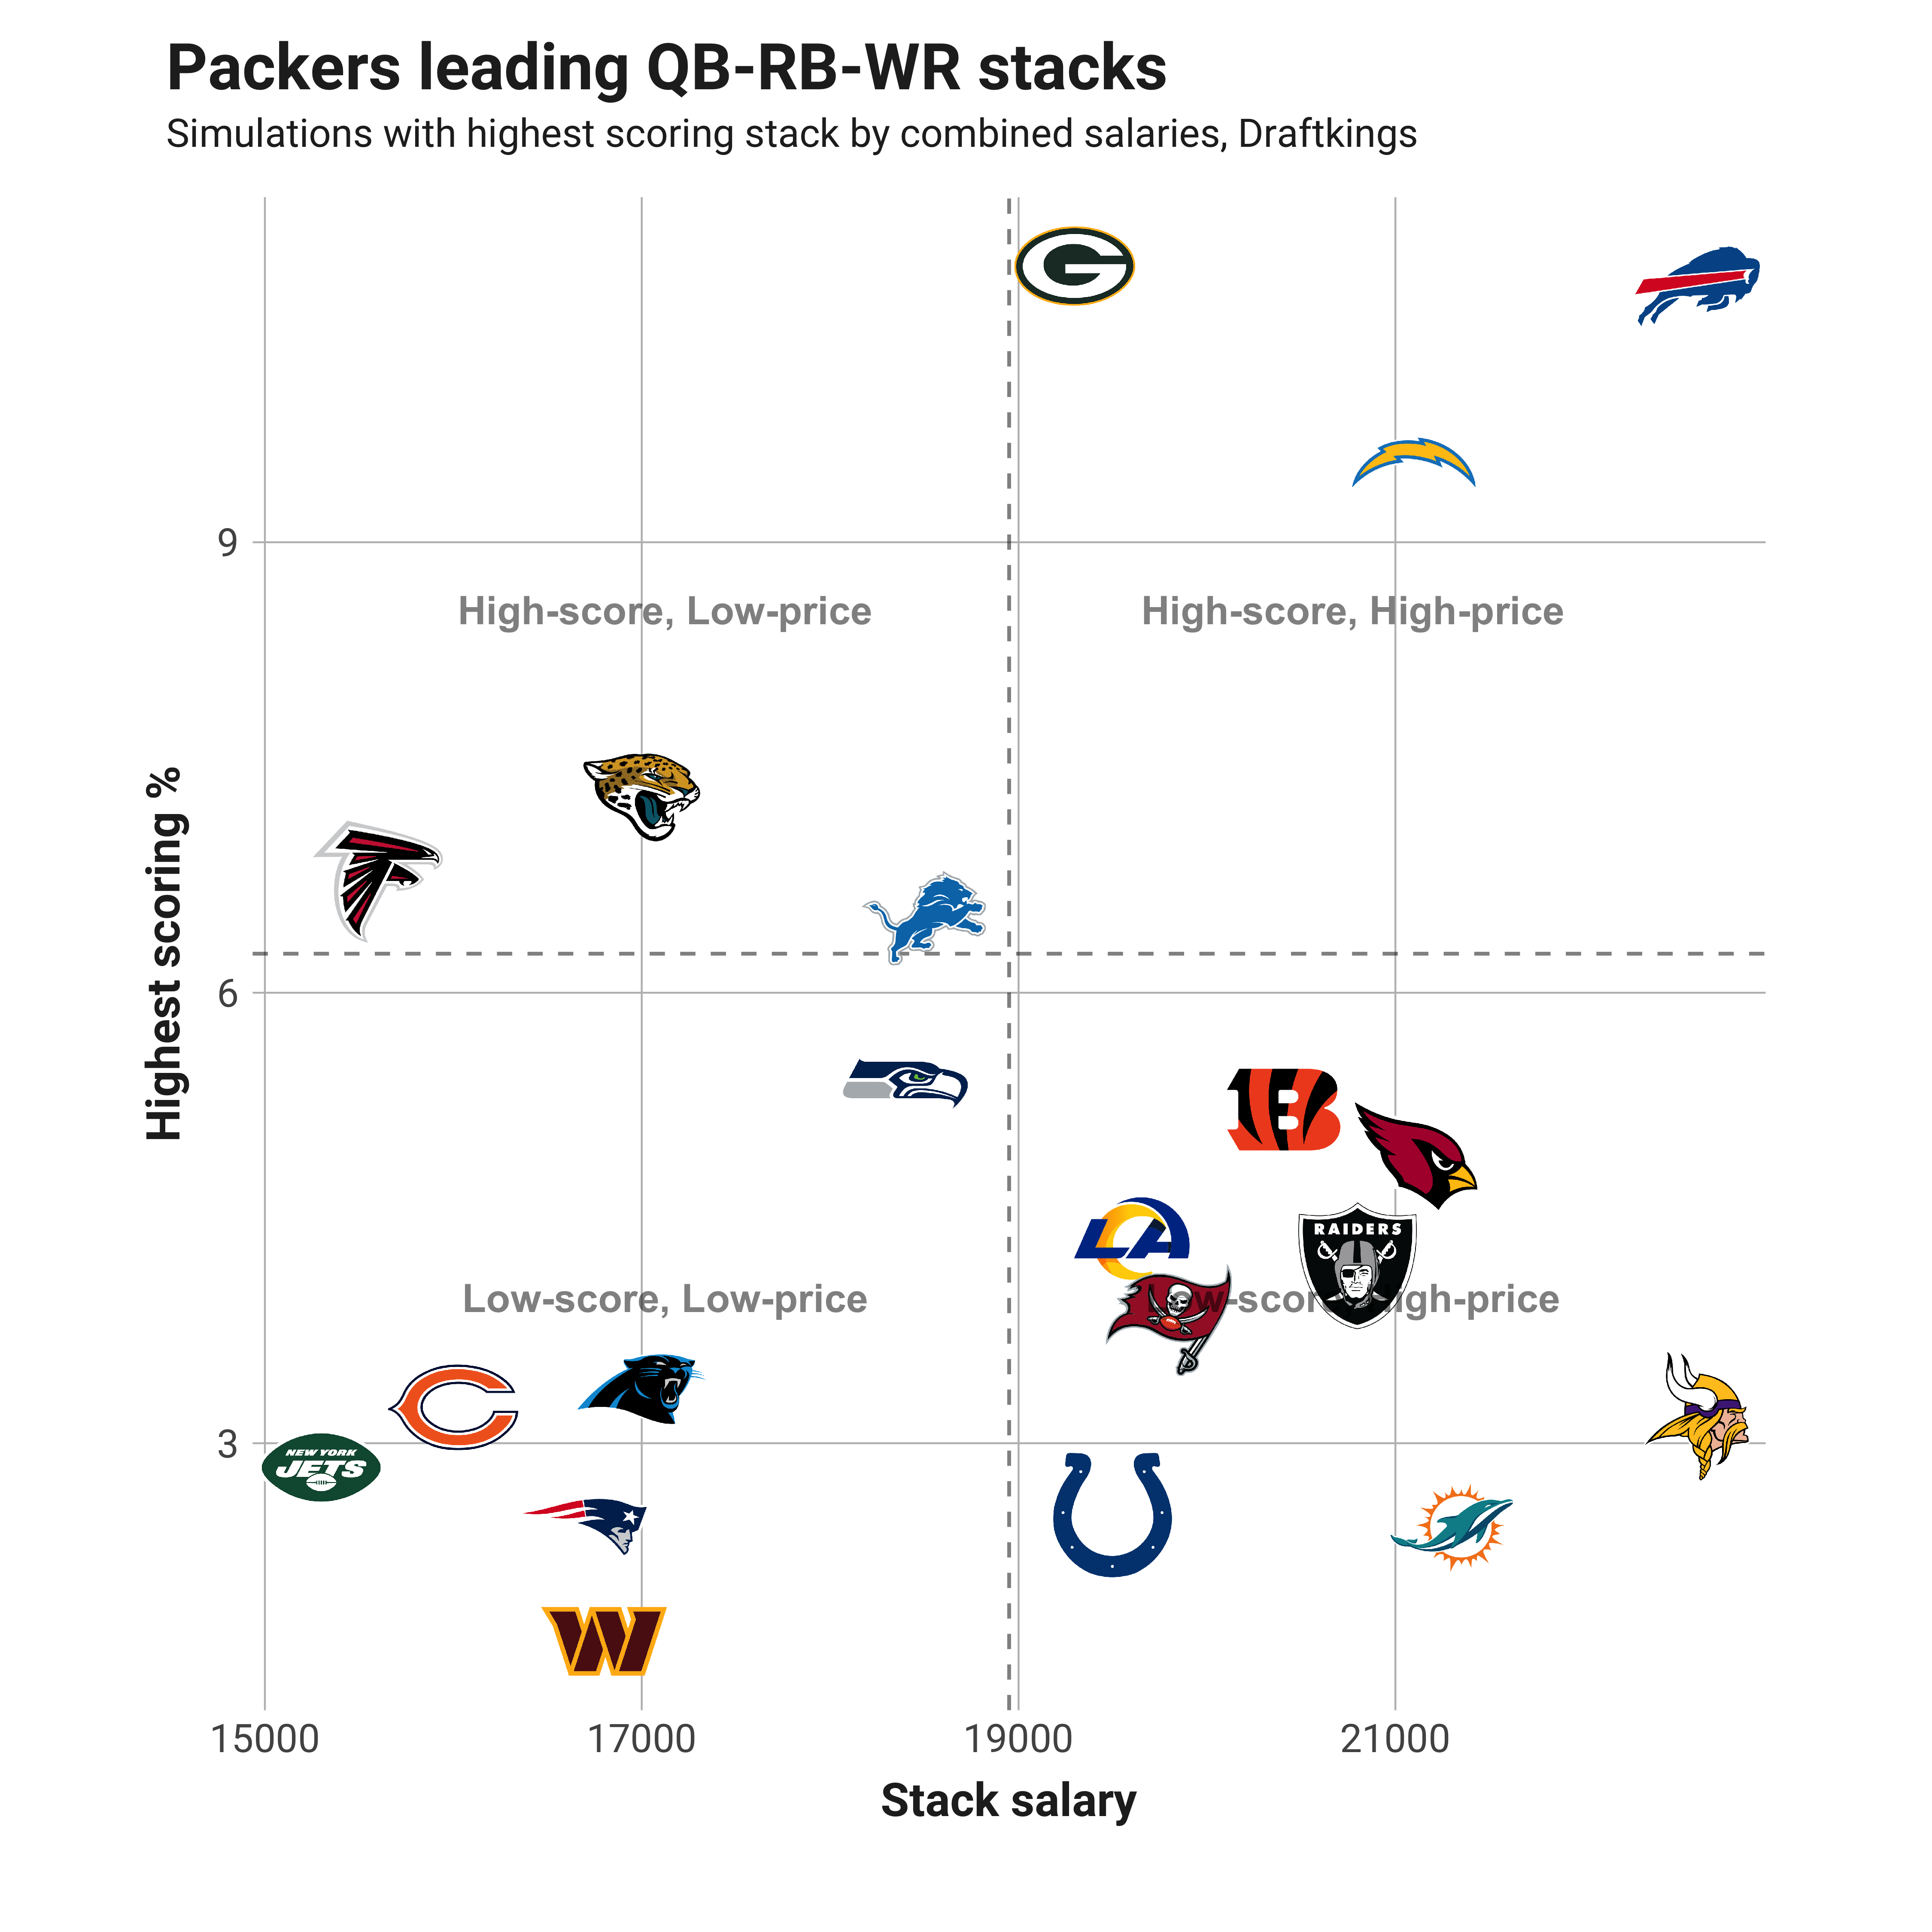
QB/RB/WR players
| Team | Opponent | Highest % | Player | Pos | DK Fpts | DK Salary | FD Fpts | FD Salary |
| GB | DET | 10.8 | Aaron Rodgers | QB | 23.6 | 5,900 | 22.2 | 7,000 |
| GB | DET | 10.8 | Aaron Jones | RB | 16.0 | 7,400 | 14.0 | 7,800 |
| GB | DET | 10.8 | Allen Lazard | WR | 13.6 | 6,000 | 11.1 | 6,500 |
| BUF | NYJ | 10.7 | Josh Allen | QB | 26.3 | 8,500 | 24.7 | 9,300 |
| BUF | NYJ | 10.7 | Devin Singletary | RB | 9.5 | 5,700 | 8.5 | 6,000 |
| BUF | NYJ | 10.7 | Stefon Diggs | WR | 17.8 | 8,400 | 14.0 | 8,900 |
| LAC | ATL | 9.5 | Justin Herbert | QB | 22.6 | 7,200 | 21.2 | 7,800 |
| LAC | ATL | 9.5 | Austin Ekeler | RB | 18.5 | 8,800 | 15.6 | 9,400 |
| LAC | ATL | 9.5 | Josh Palmer | WR | 12.5 | 5,100 | 9.9 | 6,200 |
| JAX | LV | 7.3 | Trevor Lawrence | QB | 17.9 | 5,200 | 16.6 | 6,800 |
| JAX | LV | 7.3 | Travis Etienne | RB | 15.3 | 6,300 | 13.3 | 7,600 |
| JAX | LV | 7.3 | Christian Kirk | WR | 13.7 | 5,500 | 10.9 | 6,300 |
| ATL | LAC | 6.7 | Marcus Mariota | QB | 21.0 | 5,300 | 19.6 | 7,100 |
| ATL | LAC | 6.7 | Tyler Allgeier | RB | 9.9 | 5,400 | 8.9 | 6,400 |
| ATL | LAC | 6.7 | Drake London | WR | 15.9 | 4,900 | 12.5 | 5,600 |
| DET | GB | 6.5 | Jared Goff | QB | 15.1 | 5,500 | 14.2 | 7,100 |
| DET | GB | 6.5 | D'Andre Swift | RB | 14.3 | 6,400 | 12.1 | 7,500 |
| DET | GB | 6.5 | Amon-Ra St. Brown | WR | 14.7 | 6,600 | 11.2 | 7,100 |
| SEA | ARZ | 5.4 | Geno Smith | QB | 19.9 | 5,800 | 18.5 | 7,500 |
| SEA | ARZ | 5.4 | Kenneth Walker III | RB | 16.4 | 6,200 | 14.4 | 8,300 |
| SEA | ARZ | 5.4 | D.K. Metcalf | WR | 15.7 | 6,400 | 12.6 | 7,400 |
| CIN | CAR | 5.2 | Joe Burrow | QB | 22.8 | 6,600 | 21.3 | 8,500 |
| CIN | CAR | 5.2 | Joe Mixon | RB | 17.6 | 6,500 | 15.2 | 8,100 |
| CIN | CAR | 5.2 | Tee Higgins | WR | 19.7 | 7,300 | 15.7 | 8,000 |
| ARZ | SEA | 4.9 | Kyler Murray | QB | 22.8 | 7,400 | 21.5 | 8,200 |
| ARZ | SEA | 4.9 | James Conner | RB | 11.1 | 5,800 | 9.8 | 6,600 |
| ARZ | SEA | 4.9 | DeAndre Hopkins | WR | 19.5 | 7,900 | 15.2 | 8,600 |
| LA | TB | 4.4 | Matthew Stafford | QB | 18.2 | 5,600 | 16.9 | 6,700 |
| LA | TB | 4.4 | Darrell Henderson | RB | 12.0 | 5,100 | 10.7 | 5,700 |
| LA | TB | 4.4 | Cooper Kupp | WR | 21.1 | 8,900 | 16.3 | 9,000 |
| LV | JAX | 4.2 | Derek Carr | QB | 19.0 | 5,400 | 17.6 | 6,800 |
| LV | JAX | 4.2 | Josh Jacobs | RB | 16.4 | 7,300 | 14.4 | 8,800 |
| LV | JAX | 4.2 | Davante Adams | WR | 17.9 | 8,100 | 14.0 | 8,100 |
| TB | LA | 3.8 | Tom Brady | QB | 22.0 | 6,000 | 20.2 | 6,900 |
| TB | LA | 3.8 | Leonard Fournette | RB | 12.7 | 6,600 | 11.1 | 7,100 |
| TB | LA | 3.8 | Mike Evans | WR | 19.2 | 7,200 | 15.2 | 7,700 |
| CAR | CIN | 3.4 | P.J. Walker | QB | 15.4 | 5,200 | 14.3 | 6,500 |
| CAR | CIN | 3.4 | D'Onta Foreman | RB | 10.4 | 6,000 | 9.3 | 7,300 |
| CAR | CIN | 3.4 | D.J. Moore | WR | 18.1 | 5,800 | 14.0 | 7,000 |
| CHI | MIA | 3.2 | Justin Fields | QB | 17.6 | 5,300 | 16.4 | 7,400 |
| CHI | MIA | 3.2 | David Montgomery | RB | 10.1 | 6,000 | 9.0 | 7,000 |
| CHI | MIA | 3.2 | Darnell Mooney | WR | 11.2 | 4,700 | 8.9 | 6,100 |
| MIN | WAS | 3.2 | Kirk Cousins | QB | 17.9 | 6,200 | 16.7 | 7,900 |
| MIN | WAS | 3.2 | Dalvin Cook | RB | 18.4 | 7,800 | 15.8 | 8,500 |
| MIN | WAS | 3.2 | Justin Jefferson | WR | 18.8 | 8,600 | 14.8 | 9,000 |
| NYJ | BUF | 2.8 | Zach Wilson | QB | 14.8 | 5,100 | 14.0 | 6,600 |
| NYJ | BUF | 2.8 | James Robinson | RB | 8.0 | 5,400 | 7.1 | 6,000 |
| NYJ | BUF | 2.8 | Garrett Wilson | WR | 12.9 | 4,800 | 10.2 | 5,800 |
| IND | NE | 2.5 | Sam Ehlinger | QB | 15.9 | 5,000 | 15.0 | 6,300 |
| IND | NE | 2.5 | Jonathan Taylor | RB | 16.7 | 7,700 | 14.5 | 6,800 |
| IND | NE | 2.5 | Michael Pittman Jr. | WR | 12.6 | 6,800 | 9.8 | 6,400 |
| MIA | CHI | 2.4 | Tua Tagovailoa | QB | 21.8 | 6,700 | 20.3 | 8,000 |
| MIA | CHI | 2.4 | Raheem Mostert | RB | 14.4 | 6,100 | 12.6 | 6,500 |
| MIA | CHI | 2.4 | Tyreek Hill | WR | 23.2 | 8,500 | 18.1 | 8,700 |
| NE | IND | 2.4 | Mac Jones | QB | 17.1 | 5,100 | 16.1 | 6,400 |
| NE | IND | 2.4 | Rhamondre Stevenson | RB | 14.0 | 6,200 | 12.4 | 8,000 |
| NE | IND | 2.4 | Jakobi Meyers | WR | 13.2 | 5,400 | 10.3 | 6,800 |
| WAS | MIN | 1.7 | Taylor Heinicke | QB | 16.9 | 5,400 | 15.9 | 7,200 |
| WAS | MIN | 1.7 | Antonio Gibson | RB | 10.7 | 5,500 | 9.3 | 6,100 |
| WAS | MIN | 1.7 | Terry McLaurin | WR | 13.5 | 5,900 | 10.6 | 7,200 |
METHODOLOGY
For each game on the DFS Sunday main slate, I looked through thousands of NFL matchups from 2014-2021 and found the closest analogies according to the following parameters: Betting spread, over/under, average fantasy points scoring for the top-ranked positional players of both rosters (QB1, RB1, WR1, TE1).
Once I find the 75 most similar matchups for each upcoming game, I then simulate the main slate 10,000 times by randomly choosing one of the 75 matchups for each game and then find the highest scoring QB-WR, RB-DST, QB-WR-TE and QB-RB-WR stacks on the entire simulated slate.
Every match of historical and current games is not perfect, but by matching 75 different matchups to each game and simulating 10,000 times, we can smooth out the bumps and get a strong picture of how a slate of similar games would have played out.
The last step is totaling up the number of times a particular team shows up as the top stacks for each of the three stacks projected and then dividing that number by the total simulations. That number is what I call the “Highest scoring %” on the Y-axis of the plots below labeled by team logo. Below the plots by team, I join the highest projected players that make up the stacks for that team and list their projected fantasy points and salaries for DraftKings and FanDuel.
HOW TO VIEW THE PLOTS
Each plot below has every team on the main slate positioned by the combined salary of the stack and the percentage of time that team’s stack was the highest scoring in the 10K simulations.
A way to look at them is that anything above the dashed horizontal line is a good scoring stack, and anything to the right of the dashed vertical line is a high-priced stack. You should pay most attention to the upper-right (high-scoring and high-priced) and upper-left (high-scoring and low-priced) quadrants. Ideally, you’ll find something in the upper-left that you’re confident in, but often paying up and moving into the upper-right can be beneficial.