Another year, another fantasy season is now in the books. Our fantasy director already put a bow on the season with his lessons learned in 2019, and now I’m going to take a look at how the top positional scorers of this season compared with the top-10 from the past.
The charts below visualize total PPR scoring and value over replacement for the main positional groups, highlighting the top-three scorers for each group this season and previous top scorers from 2006 to 2018. For simplicity, I’m defining VORP as points scored over the last “starter” for the position. The baselines I’m using for starters are the 12th-highest scorer for QB and TE, 24th for RB and WR. This encompasses Weeks 1-16, assuming players might rest in Week 17, and it’s normally not part of the fantasy football season anyway.
We all know Lamar Jackson was amazing, but was he really better than having Patrick Mahomes last season, or even Tom Brady in 2007? Christian McCaffrey was the clear RB1, but did he approach the value of LaDainian Tomlinson a decade ago, or even Jamaal Charles in 2013? We’ll answer these questions and more below.
Quarterback
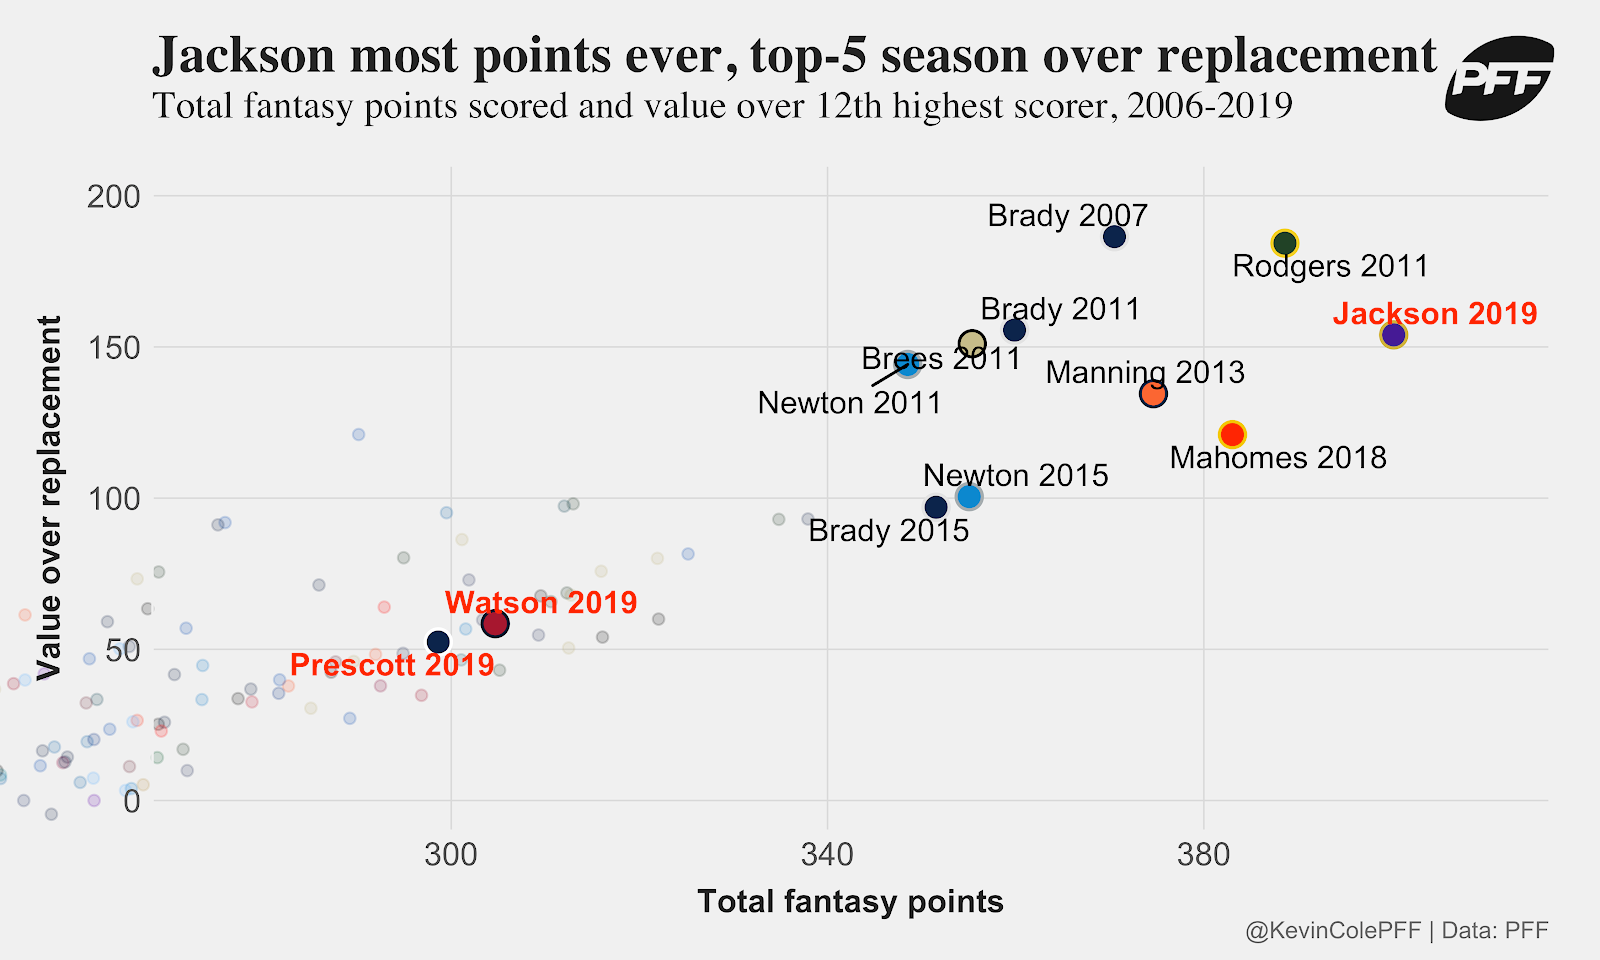
Jackson was indeed head-and-shoulders above his 2019 brethren also highlighted in red. But even Jackson’s incredible season doesn’t compare to prior years in terms of value due to a steadily increasing baseline for production. Brady in 2007 and Aaron Rodgers in 2011 both provided more value over Jackson versus the 12th highest scorer at the position, but Jackson dominated the rest this season’s top-3 (Deshaun Watson and Dak Prescott) unlike what we’ve seen before.
| Season | Player | Team | Position | Fantasy Points | Per Game | VORP |
| 2019 | Lamar Jackson | BLT | QB | 400.2 | 26.7 | 154.0 |
| 2011 | Aaron Rodgers | GB | QB | 388.6 | 25.9 | 184.3 |
| 2018 | Patrick Mahomes | KC | QB | 383.0 | 25.5 | 121.0 |
| 2013 | Peyton Manning | DEN | QB | 374.6 | 25.0 | 134.5 |
| 2007 | Tom Brady | NE | QB | 370.5 | 24.7 | 186.5 |
| 2011 | Tom Brady | NE | QB | 359.9 | 24.0 | 155.6 |
| 2011 | Drew Brees | NO | QB | 355.4 | 23.7 | 151.1 |
| 2015 | Cam Newton | CAR | QB | 355.1 | 23.7 | 100.5 |
| 2015 | Tom Brady | NE | QB | 351.5 | 23.4 | 97.0 |
| 2011 | Cam Newton | CAR | QB | 348.5 | 23.2 | 144.2 |
| 2019 | Deshaun Watson | HST | QB | 304.7 | 20.3 | 58.5 |
| 2019 | Dak Prescott | DAL | QB | 298.6 | 19.9 | 52.4 |
Running back
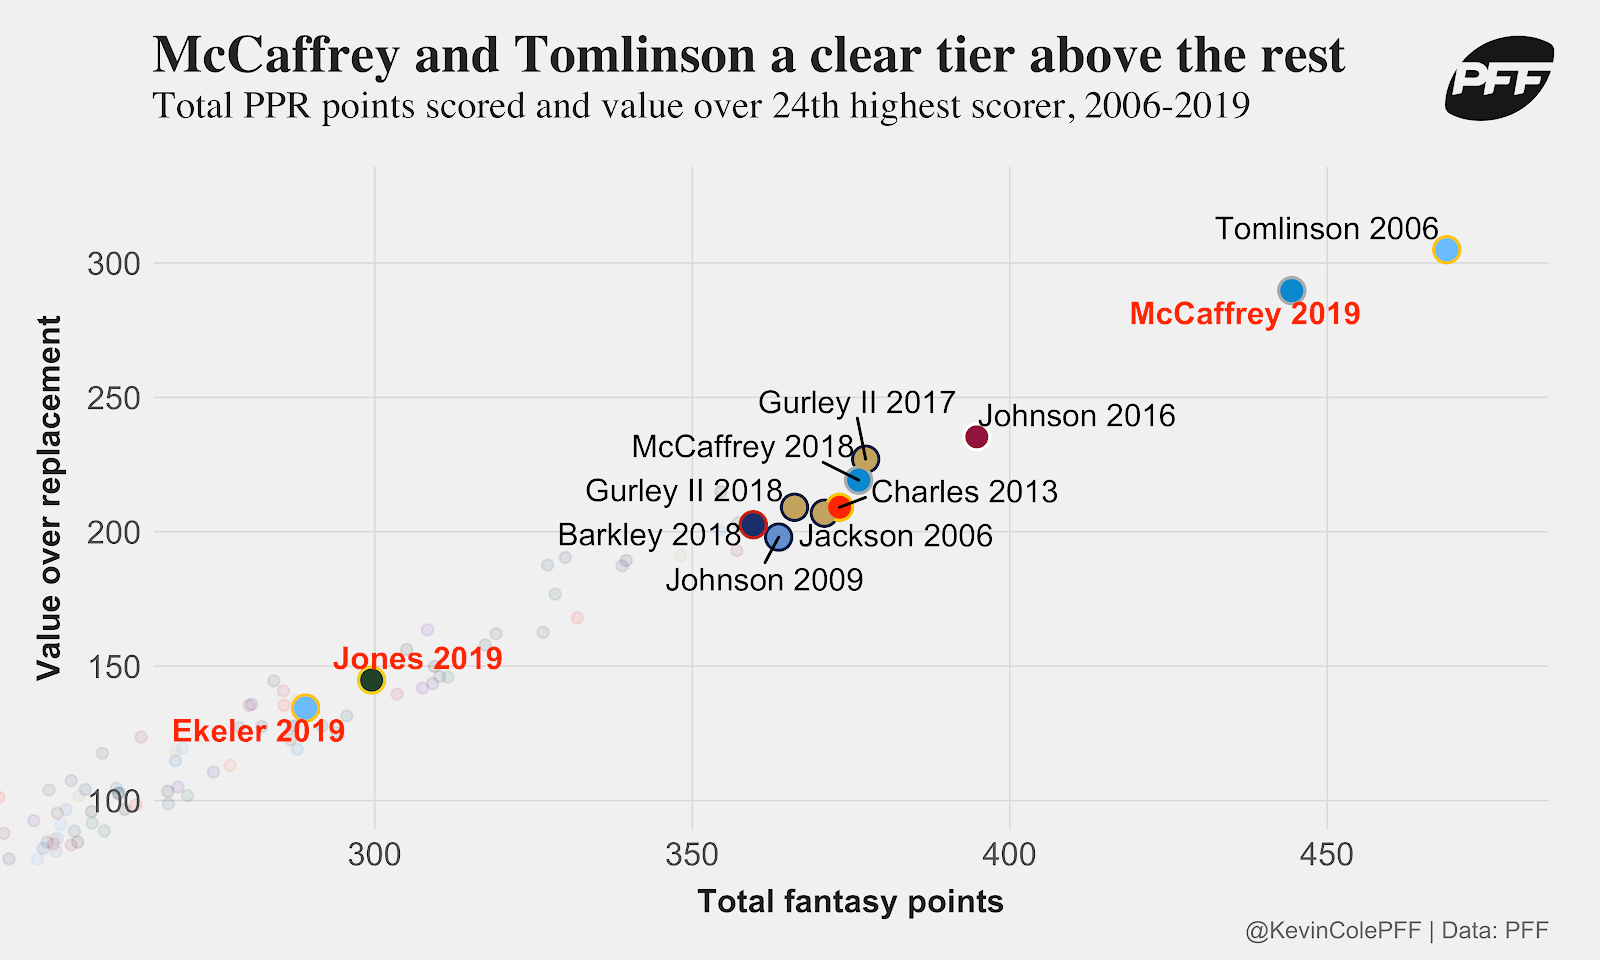
Anyone lucky enough to roster McCaffrey this season knows what sort of value he produced, and those who went with Saquon Barkley or Ezekiel Elliott instead may know even better. McCaffrey didn’t really approach Tomlinson in terms of value over the 24th-best seasonal running back, but he had a healthy margin over previous seasonal leaders and the rest of the competition in 2019. Aaron Jones and Austin Ekeler didn’t really compare to McCaffrey, with a huge gap between the leader at the top of the mountain and those below.
| Season | Player | Team | Position | Fantasy Points | Per Game | VORP |
| 2006 | LaDainian Tomlinson | SD | RB | 468.8 | 31.3 | 304.9 |
| 2019 | Christian McCaffrey | CAR | RB | 444.4 | 29.6 | 289.7 |
| 2016 | David Johnson | ARZ | RB | 394.8 | 26.3 | 235.3 |
| 2017 | Todd Gurley II | LA | RB | 377.3 | 25.2 | 227.0 |
| 2018 | Christian McCaffrey | CAR | RB | 376.2 | 25.1 | 219.2 |
| 2013 | Jamaal Charles | KC | RB | 373.2 | 24.9 | 209.1 |
| 2006 | Steven Jackson | SL | RB | 370.8 | 24.7 | 206.9 |
| 2018 | Todd Gurley II | LA | RB | 366.1 | 26.2 | 209.1 |
| 2009 | Chris Johnson | TEN | RB | 363.6 | 24.2 | 198.0 |
| 2018 | Saquon Barkley | NYG | RB | 359.6 | 24.0 | 202.6 |
| 2019 | Aaron Jones | GB | RB | 299.5 | 20.0 | 144.8 |
| 2019 | Austin Ekeler | LAC | RB | 289.1 | 19.3 | 134.4 |
Wide receiver
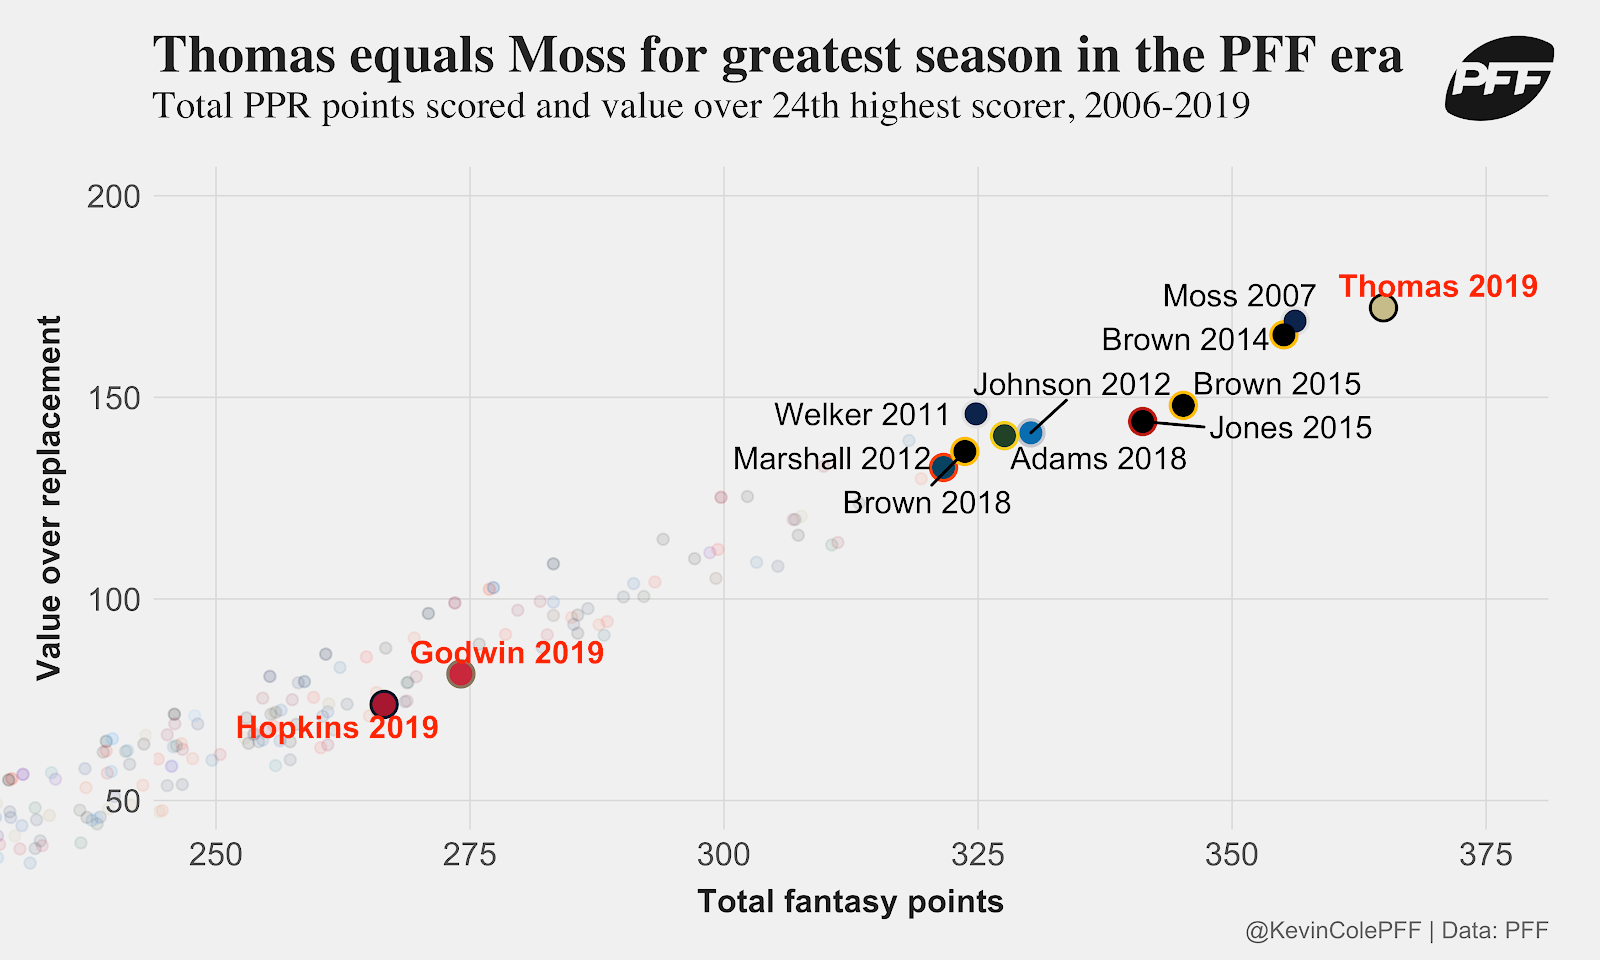
Last week I discussed if Michael Thomas has had the greatest “real” football season by a wide receiver ever, and he’s got an even more compelling fantasy case. Thomas tops the previous post-2006 leader Randy Moss in total PPR points and VORP.
Chris Godwin and DeAndre Hopkins couldn’t compare to Thomas, but both were solidly in the range of where you’d hope to find picks you may have gotten in the fourth and second rounds, respectively.
| Season | Player | Team | Position | Fantasy Points | Per Game | VORP |
| 2019 | Michael Thomas | NO | WR | 364.9 | 24.3 | 172.2 |
| 2007 | Randy Moss | NE | WR | 356.2 | 23.8 | 168.9 |
| 2014 | Antonio Brown | PIT | WR | 355.1 | 23.7 | 165.5 |
| 2015 | Antonio Brown | PIT | WR | 345.2 | 23.0 | 148.0 |
| 2015 | Julio Jones | ATL | WR | 341.2 | 22.8 | 144.0 |
| 2012 | Calvin Johnson | DET | WR | 330.2 | 22.0 | 141.2 |
| 2018 | Davante Adams | GB | WR | 327.6 | 21.8 | 140.5 |
| 2011 | Wes Welker | NE | WR | 324.8 | 21.7 | 145.9 |
| 2018 | Antonio Brown | PIT | WR | 323.7 | 21.6 | 136.6 |
| 2012 | Brandon Marshall | CHI | WR | 321.6 | 21.4 | 132.6 |
| 2019 | Chris Godwin | TB | WR | 274.1 | 19.6 | 81.4 |
| 2019 | DeAndre Hopkins | HST | WR | 266.5 | 17.8 | 73.8 |
Tight end
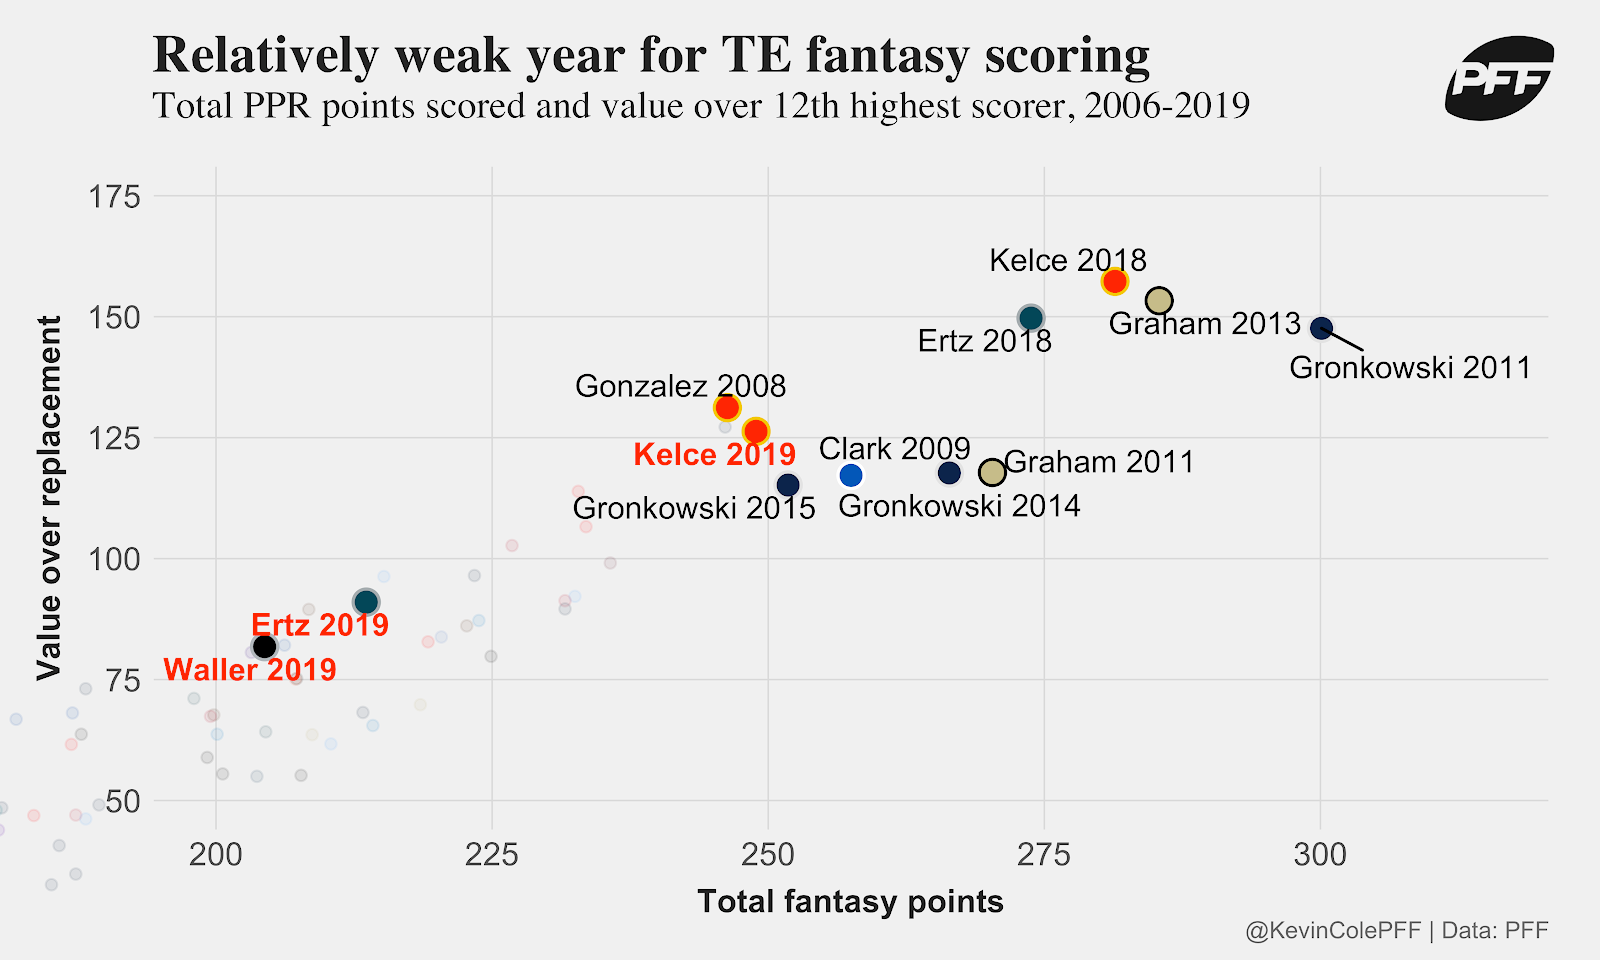
This wasn’t the most exciting year for tight end scoring, though preseason favorite Travis Kelce was able to finish out the year with a strong season as the top scorer. Kelce’s 2019 campaign doesn’t compare to his 2018, or previous top seasons like Rob Gronkowski’s 2011 and Jimmy Graham’s 2013. Perhaps we will see a renaissance at the position in coming years, though it looks far away at the moment with Kelce getting older and few promising younger tight ends to push scoring higher.
| Season | Player | Team | Position | Fantasy Points | Per Game | VORP |
| 2011 | Rob Gronkowski | NE | TE | 300.1 | 20.0 | 147.6 |
| 2013 | Jimmy Graham | NO | TE | 285.4 | 19.0 | 153.3 |
| 2018 | Travis Kelce | KC | TE | 281.4 | 18.8 | 157.3 |
| 2018 | Zach Ertz | PHI | TE | 273.8 | 18.3 | 149.7 |
| 2011 | Jimmy Graham | NO | TE | 270.3 | 18.0 | 117.8 |
| 2014 | Rob Gronkowski | NE | TE | 266.4 | 17.8 | 117.7 |
| 2009 | Dallas Clark | IND | TE | 257.5 | 17.2 | 117.2 |
| 2015 | Rob Gronkowski | NE | TE | 251.8 | 18.0 | 115.2 |
| 2019 | Travis Kelce | KC | TE | 248.9 | 16.6 | 126.3 |
| 2008 | Tony Gonzalez | KC | TE | 246.3 | 16.4 | 131.2 |
| 2019 | Zach Ertz | PHI | TE | 213.6 | 14.2 | 91.0 |
| 2019 | Darren Waller | OAK | TE | 204.4 | 13.6 | 81.8 |
