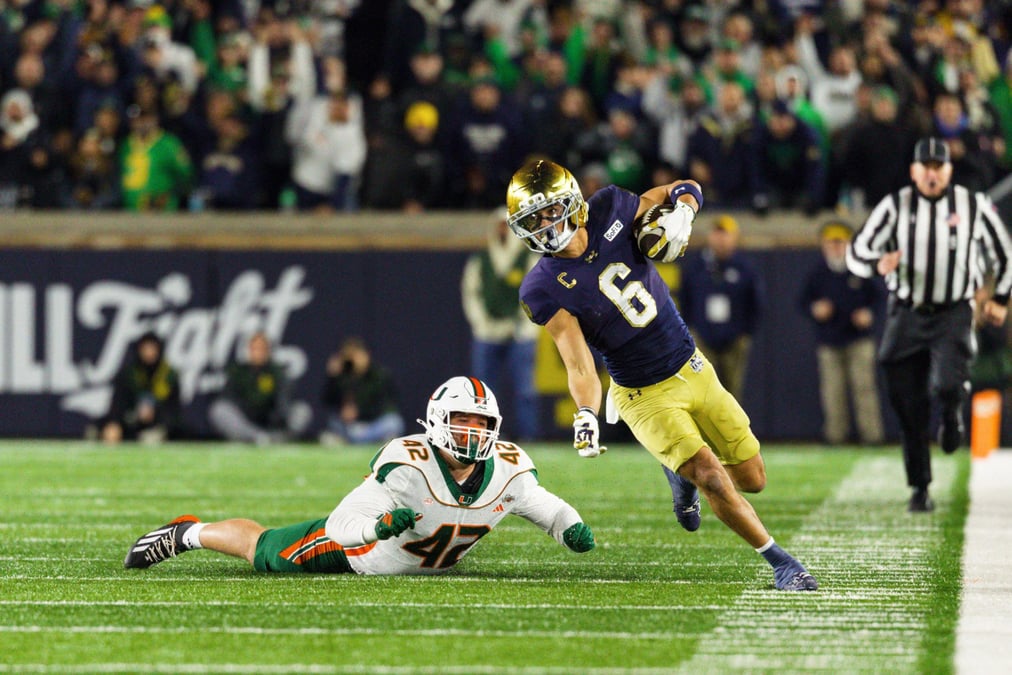
- No. 1 goes down: Miami falls to Notre Dame 31-24 in South Bend, dropping four spots to No. 5 as Georgia takes over the top spot following a dominant 42-7 win over Ole Miss.
- Tennessee makes a statement: The Volunteers jump eight spots to No. 7 after dismantling Kentucky 34-6, sending the Wildcats tumbling five spots to No. 13.
- Ohio State continues to slide: The Buckeyes suffered their second consecutive double-digit loss, falling 41-28 to Oregon and dropping 10 spots to No. 21.

Week 10 of the college football season delivered several shakeups near the top of the rankings, with six teams ranked inside last week's top 15 suffering losses.
Oregon and Arizona enter the Top 25, while Tennessee and South Carolina make the biggest climbs of the week. With the dust settled, here's how the PFF Top 25 looks heading into Week 11.
No. 1 Georgia (8-1) — Up 1
Week 10 Result: W, 42-7 at Ole Miss
Week 11 Opponent: vs. Missouri
What PFF data says: Georgia ranks ninth among FBS teams in offensive EPA per play (0.26) and fourth in defensive EPA per play allowed (-0.18). The Bulldogs average 3.06 points per drive while allowing just 1.09. Georgia also ranks sixth nationally in offensive success rate (53.2%) and is tied for sixth with 23 turnovers forced.
No. 2 Utah (9-0) — Up 1
Week 10 Result: W, 28-20 vs. BYU
Week 11 Opponent: at Arizona
What PFF data says: Utah ranks 23rd among FBS teams in offensive EPA per play (0.18) and 20th in defensive EPA per play allowed (-0.11). The Utes average 2.83 points per drive while allowing just 1.23. Utah also ranks 18th nationally in offensive success rate (51.0%) and 17th in defensive success rate allowed (38.7%).
No. 3 Notre Dame (8-1) — Up 1
Week 10 Result: W, 31-24 vs. Miami
Week 11 Opponent: vs. Boston College
What PFF data says: Notre Dame ranks sixth among FBS teams in offensive EPA per play (0.28) and 15th in defensive EPA per play allowed (-0.13). The Fighting Irish average 3.21 points per drive while allowing just 1.23. Notre Dame is tied for the fewest turnovers committed (4) and ranks fifth nationally in defensive explosive play rate allowed (9.7%).
No. 4 UCLA (9-0) — Up 1
Week 10 Result: W, 34-20 at Minnesota
Week 11 Opponent: vs. Illinois (Friday)
What PFF data says: UCLA ranks second among FBS teams in defensive EPA per play allowed (-0.27) and 47th in offensive EPA per play (0.11). The Bruins average 2.31 points per drive while allowing just 1.02, the fifth-best mark nationally. UCLA also ranks second in defensive success rate allowed (33.5%) and leads the FBS with 32 turnovers forced.
No. 5 Miami (8-1) — Down 4
Week 10 Result: L, 31-24 at Notre Dame
Week 11 Opponent: vs. Duke
What PFF data says: Miami leads the FBS in offensive EPA per play (0.35) and ranks 36th in defensive EPA per play allowed (-0.07). The Hurricanes average 3.46 points per drive while allowing 1.45. Miami also leads the country in offensive success rate (54.9%) and has committed just eight turnovers, tied for the seventh-fewest nationally.
No. 6 Indiana (8-1) — Up 1
Week 10 Result: Bye
Week 11 Opponent: vs. USC
What PFF data says: Indiana ranks 28th among FBS teams in offensive EPA per play (0.17) and 10th in defensive EPA per play allowed (-0.16). The Hoosiers average 2.54 points per drive while allowing just 0.96, the fourth-best mark nationally. Indiana also ranks third in defensive success rate allowed (35.4%) and seventh in offensive explosive play rate (19.5%).
No. 7 Tennessee (7-2) — Up 8
Week 10 Result: W, 34-6 vs. Kentucky
Week 11 Opponent: at Texas A&M
What PFF data says: Tennessee ranks 51st among FBS teams in offensive EPA per play (0.10) and 11th in defensive EPA per play allowed (-0.16). The Volunteers average 2.38 points per drive while allowing just 1.11, the 10th-best mark nationally. Tennessee has also forced 22 turnovers, tied for ninth among FBS teams.
No. 8 Alabama (7-2) — Up 1
Week 10 Result: W, 31-13 at LSU
Week 11 Opponent: at Vanderbilt
What PFF data says: Alabama ranks 25th among FBS teams in offensive EPA per play (0.18) and 28th in defensive EPA per play allowed (-0.09). The Crimson Tide average 2.72 points per drive while allowing 1.50. Alabama also ranks 14th in offensive success rate (51.4%) and fourth nationally in turnovers forced (27).
No. 9 Texas (7-2) — Up 1
Week 10 Result: W, 34-20 at Missouri
Week 11 Opponent: at LSU
What PFF data says: Texas ranks seventh among FBS teams in defensive EPA per play allowed (-0.16) but just 86th in offensive EPA per play (0.01). The Longhorns average 2.22 points per drive while allowing just 1.07, the eighth-best mark nationally. Texas also ranks second in defensive explosive play rate allowed (9.1%), but its offense ranks 74th in success rate (45.0%).
No. 10 BYU (7-2) — Down 4
Week 10 Result: L, 28-20 at Utah
Week 11 Opponent: vs. Baylor
What PFF data says: BYU ranks 26th among FBS teams in offensive EPA per play (0.18) and 38th in defensive EPA per play allowed (-0.06). The Cougars average 2.57 points per drive while allowing 1.55. BYU also ranks 30th nationally in offensive success rate (49.5%) and sixth in defensive explosive play rate allowed (10.1%).
No. 11 Wake Forest (8-1) — Up 3
Week 10 Result: W, 77-0 vs. Merrimack
Week 11 Opponent: at SMU
What PFF data says: Wake Forest ranks second among FBS teams in offensive EPA per play (0.34) and 29th in defensive EPA per play allowed (-0.09). The Demon Deacons average 3.46 points per drive, tied for the best mark nationally, while allowing just 1.25. Wake Forest also ranks fourth in offensive explosive play rate (20.3%) and has committed just seven turnovers, the third-fewest nationally.
No. 12 Texas Tech (8-1) — Up 4
Week 10 Result: W, 53-48 vs. West Virginia
Week 11 Opponent: at Oklahoma State
What PFF data says: Texas Tech ranks 46th among FBS teams in offensive EPA per play (0.12) and 49th in defensive EPA per play allowed (-0.02). The Red Raiders average 2.49 points per drive while allowing 1.62. Texas Tech also ranks 21st nationally in offensive explosive play rate (18.0%) and has forced 18 turnovers, tied for 27th.
No. 13 Kentucky (7-2) — Down 5
Week 10 Result: L, 34-6 at Tennessee
Week 11 Opponent: vs. Florida
What PFF data says: Kentucky ranks 54th among FBS teams in offensive EPA per play (0.09) and 80th in defensive EPA per play allowed (0.04). The Wildcats average 2.25 points per drive while allowing 2.06. Kentucky ranks 112th nationally in defensive success rate allowed (46.6%) but has committed just nine turnovers, tied for the 10th-fewest among FBS teams.
No. 14 USC (7-2) — Up 3
Week 10 Result: Bye
Week 11 Opponent: at Indiana
What PFF data says: USC ranks 19th among FBS teams in offensive EPA per play (0.19) but just 109th in defensive EPA per play allowed (0.10). The Trojans average 2.71 points per drive while allowing 2.14. USC ranks 10th nationally in offensive success rate (52.1%), but its defense ranks 112th in success rate allowed (46.6%) and has forced just nine turnovers.
No. 15 Iowa (7-2) — Up 4
Week 10 Result: W, 24-10 at Northwestern
Week 11 Opponent: vs. Purdue
What PFF data says: Iowa ranks sixth among FBS teams in defensive EPA per play allowed (-0.17) but just 73rd in offensive EPA per play (0.05). The Hawkeyes average 2.07 points per drive while allowing just 0.94, the third-best mark nationally. Iowa also ranks fifth in defensive success rate allowed (36.9%) and seventh in defensive explosive play rate allowed (10.5%).
No. 16 Houston (7-2) — Up 4
Week 10 Result: W, 31-24 vs. Cincinnati
Week 11 Opponent: at Colorado (Friday)
What PFF data says: Houston ranks fifth among FBS teams in offensive EPA per play (0.29) but just 101st in defensive EPA per play allowed (0.08). The Cougars average 3.13 points per drive while allowing 1.86. Houston also ranks third nationally in offensive success rate (54.3%), while its defense ranks 83rd in success rate allowed (44.9%).
No. 17 Ole Miss (6-3) — Down 5
Week 10 Result: L, 42-7 vs. Georgia
Week 11 Opponent: at Oklahoma
What PFF data says: Ole Miss ranks 44th among FBS teams in offensive EPA per play (0.13) and 93rd in defensive EPA per play allowed (0.06). The Rebels average 2.50 points per drive while allowing 2.02. Ole Miss ranks 24th nationally in offensive success rate (50.0%), but its defense ranks 106th in explosive play rate allowed (16.0%).
No. 18 South Carolina (6-3) — Up 7
Week 10 Result: W, 17-9 vs. Texas A&M
Week 11 Opponent: at Arkansas
What PFF data says: South Carolina ranks 31st among FBS teams in offensive EPA per play (0.16) and 81st in defensive EPA per play allowed (0.04). The Gamecocks average 3.01 points per drive, the ninth-best mark nationally, while allowing 1.70. South Carolina has struggled with turnovers, committing 21 while forcing just nine, and ranks 104th in defensive success rate allowed (46.2%).
No. 19 Boise State (8-1) — Up 3
Week 10 Result: W, 64-38 at Colorado State
Week 11 Opponent: vs. Oregon State
What PFF data says: Boise State ranks fourth among FBS teams in offensive EPA per play (0.32) but just 90th in defensive EPA per play allowed (0.06). The Broncos average 3.06 points per drive while allowing 2.03. Boise State ranks fifth nationally in offensive success rate (53.5%) and is tied for the fewest turnovers committed (4), but its defense has forced just eight.
No. 20 Oregon (6-3) — New
Week 10 Result: W, 41-28 at Ohio State
Week 11 Opponent: vs. Michigan
What PFF data says: Oregon ranks 56th among FBS teams in offensive EPA per play (0.09) and 35th in defensive EPA per play allowed (-0.07). The Ducks average 2.35 points per drive while allowing 1.56. Oregon ranks 25th nationally in defensive success rate allowed (39.9%), but its offense ranks just 94th in success rate (43.9%).
No. 21 Ohio State (6-3) — Down 10
Week 10 Result: L, 41-28 vs. Oregon
Week 11 Opponent: vs. Northwestern
What PFF data says: Ohio State ranks 21st among FBS teams in offensive EPA per play (0.19) and 17th in defensive EPA per play allowed (-0.12). The Buckeyes average 2.77 points per drive while allowing 1.34. Ohio State also ranks 13th nationally in both offensive success rate (51.5%) and defensive success rate allowed (38.2%).
No. 22 New Mexico (8-1) — Up 1
Week 10 Result: W, 31-3 at Nevada
Week 11 Opponent: vs. UNLV
What PFF data says: New Mexico leads the FBS in defensive EPA per play allowed (-0.32) and ranks 52nd in offensive EPA per play (0.10). The Lobos average 2.49 points per drive while allowing just 0.78, the best mark nationally. New Mexico also leads the FBS in defensive success rate allowed (31.9%) and ranks second nationally with 31 turnovers forced.
No. 23 LSU (6-3) — Down 10
Week 10 Result: L, 31-13 vs. Alabama
Week 11 Opponent: vs. Texas
What PFF data says: LSU ranks 27th among FBS teams in offensive EPA per play (0.18) and ninth in defensive EPA per play allowed (-0.16). The Tigers average 2.83 points per drive while allowing just 1.21. LSU also ranks 11th nationally in offensive success rate (51.7%) and sixth in defensive success rate allowed (37.0%).
No. 24 SMU (7-2) — No Change
Week 10 Result: W, 51-28 vs. Virginia Tech
Week 11 Opponent: vs. Wake Forest
What PFF data says: SMU ranks 12th among FBS teams in offensive EPA per play (0.25) and 58th in defensive EPA per play allowed (0.00). The Mustangs average 2.91 points per drive while allowing 1.77. SMU also ranks 15th nationally in offensive success rate (51.1%), but its defense has forced just 12 turnovers, tied for 100th.
No. 25 Arizona (7-2) — New
Week 10 Result: W, 29-28 vs. TCU
Week 11 Opponent: vs. Utah
What PFF data says: Arizona ranks 24th among FBS teams in offensive EPA per play (0.18) and 40th in defensive EPA per play allowed (-0.06). The Wildcats average 2.53 points per drive while allowing 1.49. Arizona also ranks 31st nationally in defensive success rate allowed (41.0%) and has committed just 10 turnovers, tied for the 19th-fewest among FBS teams.

 © 2026 PFF - all rights reserved.