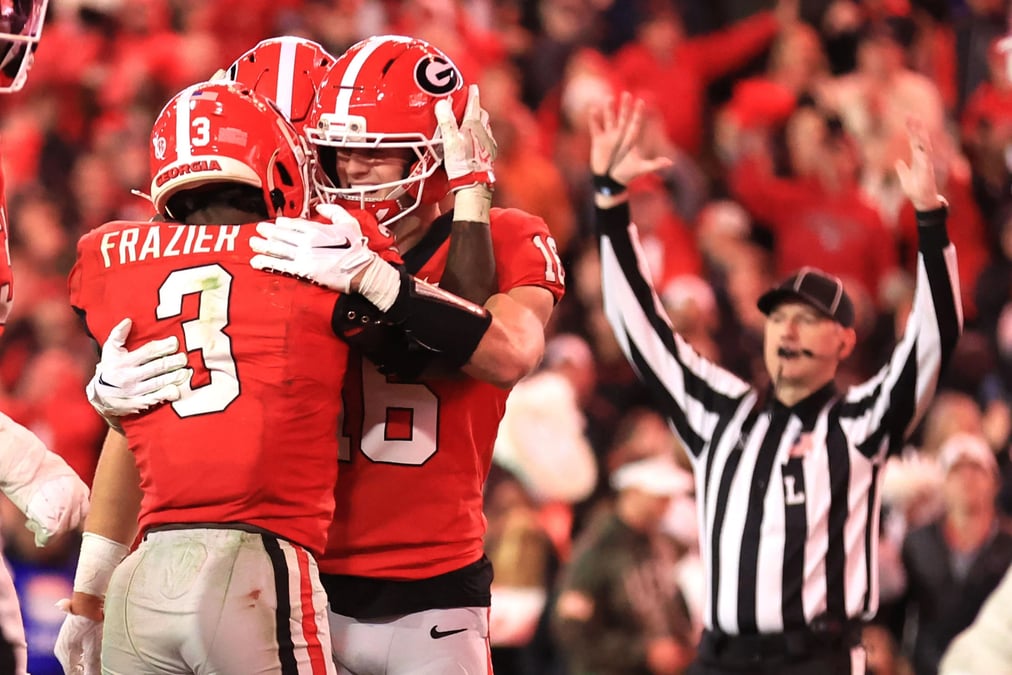
- Georgia leads PFF's playoff rankings: The Bulldogs hold the No. 1 spot at 9-1, ranking sixth nationally in offensive EPA per play and eighth in defensive EPA per play allowed.
- Utah and UCLA remain undefeated: Both teams enter Week 12 at 10-0, with Utah ranking third nationally in third-down conversion rate and UCLA leading the FBS with 35 turnovers forced.
- Notre Dame combines efficiency with ball security: The Fighting Irish rank fifth in offensive EPA per play and have committed just five turnovers, the fewest in the FBS.

No. 1 Georgia (9-1)
Notable wins: @ Alabama, @ Ole Miss, vs. Missouri
Notable losses: vs. Auburn
What the PFF data says: Georgia ranks sixth among FBS teams in offensive EPA per play (0.27) and eighth in defensive EPA per play allowed (-0.17). The Bulldogs average 3.13 points per drive while allowing just 1.13. They also rank fourth nationally in offensive success rate (52.9%) and are tied for eighth with 24 turnovers forced.
No. 2 Utah (10-0)
Notable wins: vs. BYU, vs. Houston, @ Arizona
Notable losses: None
What the PFF data says: Utah averages 2.83 points per drive while allowing 1.37. The Utes rank 14th among FBS teams in offensive EPA per play (0.20) and 28th in defensive EPA per play allowed (-0.09). Their offensive success rate (50.8%) also ranks 14th nationally, while their third-down conversion rate (52.8%) is tied for third.
No. 3 Notre Dame (9-1)
Notable wins: vs. Miami
Notable losses: @ BYU
What the PFF data says: With just five turnovers committed, the fewest in the FBS, Notre Dame ranks fifth nationally in offensive EPA per play (0.28) and third in offensive success rate (53.1%). The Fighting Irish average 3.18 points per drive while allowing just 1.15, ranking seventh in defensive EPA per play allowed (-0.17) and second in defensive explosive play rate allowed (9.3%).
No. 4 UCLA (10-0)
Notable wins: @ Oregon, vs. Wisconsin
Notable losses: None
What the PFF data says: UCLA leads the FBS with 35 turnovers forced and ranks second in defensive EPA per play allowed (-0.27) and defensive success rate allowed (33.4%). The Bruins surrender just 1.03 points per drive, fifth-fewest nationally. Offensively, they rank 51st in EPA per play (0.10) and average 2.24 points per drive.
No. 5 Miami (9-1)
Notable wins: @ Wake Forest
Notable losses: @ Notre Dame
What the PFF data says: Miami leads the FBS in offensive success rate (54.4%) and offensive series success rate (85.0%). The Hurricanes also rank second in offensive EPA per play (0.34) and average 3.45 points per drive, second-most nationally. Miami is tied for the third-fewest turnovers committed (eight), while its defense ranks 43rd in EPA per play allowed (-0.04).
No. 6 Indiana (9-1)
Notable wins: vs. Northwestern, vs. USC
Notable losses: vs. Ohio State
What the PFF data says: Indiana allows just 0.98 points per drive, fourth-fewest nationally, and ranks second in red-zone conversion rate allowed (25.0%). The Hoosiers rank fourth in defensive success rate allowed (36.8%) and 13th in defensive EPA per play allowed (-0.14), with 22 turnovers forced. Their offense ranks 21st in EPA per play (0.17).

No. 7 Tennessee (8-2)
Notable wins: vs. Alabama, vs. Kentucky
Notable losses: vs. Texas, @ South Carolina
What the PFF data says: Tennessee ranks fourth among FBS teams in defensive EPA per play allowed (-0.19) and allows just 1.05 points per drive, sixth-fewest nationally. The Volunteers also rank 11th in third-down conversion rate allowed (31.5%) and are tied for eighth with 24 turnovers forced. Offensively, Tennessee ranks 56th in EPA per play (0.08) and averages 2.29 points per drive.
No. 8 Alabama (8-2)
Notable wins: @ Kentucky, vs. South Carolina, @ Mississippi State, @ LSU
Notable losses: vs. Georgia, @ Tennessee
What the PFF data says: Alabama has forced 28 turnovers, the fourth-most nationally, and ranks second in offensive red-zone conversion rate (66.7%). The Crimson Tide rank 33rd among FBS teams in offensive EPA per play (0.14) and 17th in defensive EPA per play allowed (-0.12), averaging 2.59 points per drive while allowing 1.39.
No. 9 Texas (8-2)
Notable wins: vs. Ohio State, @ Tennessee, vs. Ole Miss, @ Missouri, @ LSU
Notable losses: vs. Oklahoma, vs. Florida
What the PFF data says: Texas ranks 12th among FBS teams in defensive EPA per play allowed (-0.14), surrendering just 1.13 points per drive, tied for eighth-fewest nationally. The Longhorns also rank fifth in red-zone conversion rate allowed (29.7%). Their offense ranks 91st in EPA per play (approximately 0.00), averages 2.18 points per drive and has committed 21 turnovers.
No. 10 BYU (8-2)
Notable wins: vs. Notre Dame, vs. Arizona
What the PFF data says: BYU ranks ninth nationally in third-down conversion rate (50.4%) and sixth in defensive explosive play rate allowed (10.0%). The Cougars rank 29th among FBS teams in offensive EPA per play (0.16) and 34th in defensive EPA per play allowed (-0.07), averaging 2.57 points per drive while allowing 1.45.
No. 11 Wake Forest (9-1)
Notable wins: @ Louisville
Notable losses: vs. Miami
What the PFF data says: Wake Forest leads the FBS in offensive EPA per play (0.35) and points per drive (3.49). The Demon Deacons also rank third in offensive explosive play rate (20.1%) and are tied for the third-fewest turnovers committed (eight). Defensively, Wake Forest ranks 19th in EPA per play allowed (-0.12) and surrenders just 1.18 points per drive, 13th-fewest nationally.
No. 12 Boise State (9-1)
Notable wins: vs. Memphis
Notable losses: @ Oregon
What the PFF data says: Boise State ranks third among FBS teams in offensive EPA per play (0.32) but 115th in defensive EPA per play allowed (0.11). The Broncos average 3.09 points per drive while allowing 2.19. They've committed just six turnovers, the second-fewest nationally, but have forced only nine, tied for 131st among FBS teams.

 © 2026 PFF - all rights reserved.