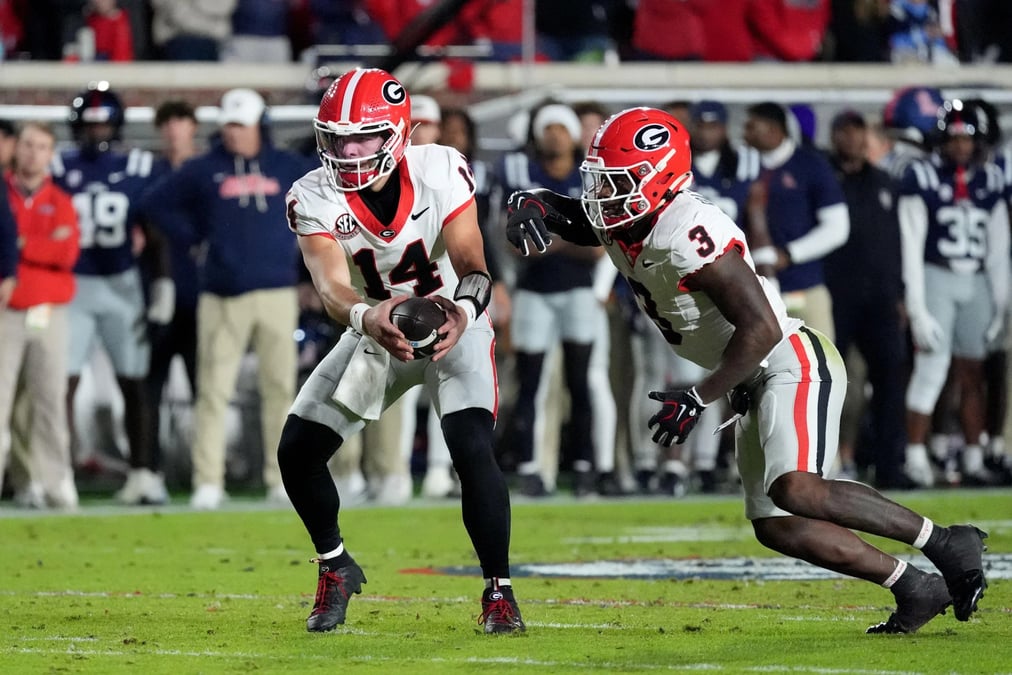
- Georgia leads the rankings: The Bulldogs are No. 1 at 8-1, ranking fourth nationally in defensive EPA allowed per play (-0.18) and sixth in offensive success rate (53.2%).
- Utah remains undefeated: The No. 2 Utes are 9-0, averaging 2.83 points per drive while allowing 1.23, with wins over BYU and Houston.
- Notre Dame combines offensive efficiency with ball security: The No. 3 Fighting Irish rank sixth nationally in offensive EPA per play (0.28) and are tied for the fewest turnovers committed (four).

No. 1 Georgia (8-1)
Notable wins: @ Alabama, @ Ole Miss
Notable losses: vs. Auburn
What PFF data says: Georgia ranks ninth among FBS teams in EPA per play on offense (0.26) and fourth in EPA per play allowed on defense (-0.18). The team averages 3.06 points per drive while allowing just 1.09. Georgia also ranks sixth nationally in offensive success rate (53.2%) and is tied for sixth with 23 turnovers forced.
No. 2 Utah (9-0)
Notable wins: vs. BYU, vs. Houston
Notable losses: None
What PFF data says: Utah ranks 23rd among FBS teams in EPA per play on offense (0.18) and 20th in EPA allowed per play on defense (-0.11). The Utes average 2.83 points per drive while allowing just 1.23. Utah also ranks 18th nationally in offensive success rate (51.0%) and 17th in defensive success rate allowed (38.7%).
No. 3 Notre Dame (8-1)
Notable wins: vs. Miami
Notable losses: @ BYU
What PFF data says: Notre Dame ranks sixth among FBS teams in EPA per play on offense (0.28) and 15th in EPA allowed per play on defense (-0.13). They average 3.21 points per drive while allowing just 1.23. Notre Dame is tied for the fewest turnovers committed (4) and ranks fifth nationally in defensive explosive play rate allowed (9.7%).
No. 4 UCLA (9-0)
Notable wins: @ Oregon, vs. Wisconsin
Notable losses: None
What PFF data says: UCLA ranks second among FBS teams in EPA allowed per play on defense (-0.27) and 47th in EPA per play on offense (0.11). The team averages 2.31 points per drive while allowing just 1.02, the fifth-best mark nationally. UCLA also ranks second in defensive success rate allowed (33.5%) and leads the FBS with 32 turnovers forced.
No. 5 Miami (8-1)
Notable wins: @ Wake Forest
Notable losses: @ Notre Dame
What PFF data says: Miami leads the FBS in EPA per play on offense (0.35) and ranks 36th in EPA allowed per play on defense (-0.07). Miami also leads the country in offensive success rate (54.9%) and has committed just eight turnovers, tied for the seventh-fewest nationally.
No. 6 Indiana (8-1)
Notable wins: vs. Northwestern
Notable losses: vs. Ohio State
What PFF data says: Indiana ranks 28th among FBS teams in EPA per play on offense (0.17) and 10th in EPA allowed per play on defense (-0.16). The Hoosiers average 2.54 points per drive while allowing just 0.96, the fourth-best mark in the nation. Indiana also ranks third in defensive success rate allowed (35.4%) and seventh in offensive explosive play rate (19.5%).
No. 7 Tennessee (7-2)
Notable wins: vs. Alabama, vs. Kentucky
Notable losses: vs. Texas, @ South Carolina
What PFF data says: Tennessee ranks 51st among FBS teams in EPA per play on offense (0.10) and 11th in EPA allowed per play on defense (-0.16). The Volunteers average 2.38 points per drive while allowing just 1.11, the 10th-best mark in the country. Tennessee has also forced 22 turnovers, tied for ninth among FBS teams.
No. 8 Alabama (7-2)
Notable wins: @ Kentucky, vs. South Carolina, @ Mississippi State, @ LSU
Notable losses: vs. Georgia, @ Tennessee
What PFF data says: Alabama ranks 25th among FBS teams in EPA per play on offense (0.18) and 28th in EPA allowed per play on defense (-0.09). The Crimson Tide average 2.72 points per drive while allowing 1.50. Alabama also ranks 14th in offensive success rate (51.4%) and fourth nationally in turnovers forced (27).
No. 9 Texas (7-2)
Notable wins: vs. Ohio State, @ Tennessee, vs. Ole Miss, vs. Missouri
Notable losses: vs. Oklahoma, vs. Florida
What PFF data says: Texas ranks seventh among FBS teams in EPA allowed per play on defense (-0.16) but just 86th in EPA per play on offense (0.01). The Longhorns average 2.22 points per drive while allowing just 1.07, the eighth-best mark nationally. Texas also ranks second in defensive explosive play rate allowed (9.1%), but its offense ranks 74th in success rate (45.0%).
No. 10 BYU (7-2)
Notable wins: vs. Notre Dame, vs. Arizona
What PFF data says: BYU ranks 26th among FBS teams in EPA per play on offense (0.18) and 38th in EPA allowed per play on defense (-0.06). The Cougars average 2.57 points per drive while allowing 1.55. BYU also ranks 30th nationally in offensive success rate (49.5%) and sixth in defensive explosive play rate allowed (10.1%).
No. 11 Wake Forest (8-1)
Notable wins: vs. Louisville
Notable losses: vs. Miami
What PFF data says: Wake Forest ranks second among FBS teams in EPA per play on offense (0.34) and 29th in EPA allowed per play on defense (-0.09). The Demon Deacons average 3.46 points per drive, tied for the nation's best mark, while allowing just 1.25. Wake Forest also ranks fourth in offensive explosive play rate (20.3%) and has committed just seven turnovers, the third-fewest nationally.
No. 12 Boise State (8-1)
Notable wins: vs. Memphis
Notable losses: @ Oregon
What PFF data says: Boise State ranks fourth among FBS teams in EPA per play on offense (0.32) but just 90th in EPA allowed per play on defense (0.06). The Broncos average 3.06 points per drive while allowing 2.03. Boise State ranks fifth nationally in offensive success rate (53.5%) and is tied for the fewest turnovers committed (4), but its defense has forced just eight.

 © 2026 PFF - all rights reserved.