• Adjusted Coverage Rate takes into account successful coverage rate for a player or defense and expands it to account for before PFF graded every coverage player on a play.
• By this metric, the New England Patriots have fielded the most successful secondary over the past five seasons.
• Among the top cornerbacks in Adjusted Coverage Rate since 2006 are Darrelle Revis, Richard Sherman and Marshon Lattimore.
• Among the top safeties in Adjusted Coverage Rate since 2006 are Jevon Holland, Anthony Harris and Trevon Moehrig.
PFF's coverage grades date back to 2006, but since 2019, coverage grades are awarded to every defender in coverage on every play instead of only those targeted or involved in a play. Using this new data, we are able to calculate each player’s successful coverage rate — the percentage of the time a coverage defender earns a grade of “zero” or higher on a play.
I previously created a metric that used player combine data to predict eventual NFL coverage rate. Since we only have this complete data from the 2019, 2020 and 2021 NFL seasons, this only included players who were drafted since 2019. However, what if we expanded this to include all players since 2006? Using a newly created adjusted coverage rate, we can see which players and teams performed the best in coverage, combined with other stats such as pass breakup rate and average expected points added (EPA) allowed.
The Difference Between Raw and True Coverage Rates
A defender’s raw coverage rate is the percentage of time they earned a “zero” coverage grade or better on applicable plays (where the defender was targeted and/or made a play on the ball). These numbers differ greatly and are significantly lower than a defender’s true coverage rate from 2019-2021, where coverage grades are given out to every player on every play.
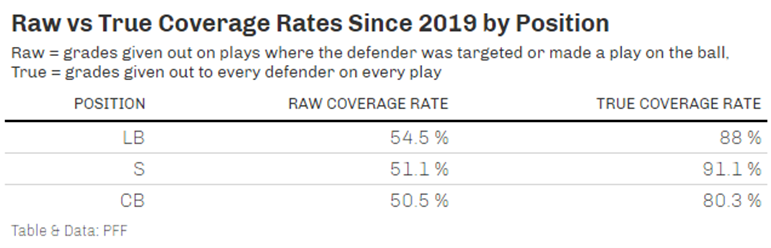
Looking at safeties, their raw coverage rate falls in the middle of cornerbacks and linebackers, but they have the highest true coverage rate. This is greatly aided by the fact that safeties receive the most “zero” coverage grades because plays don't always reach them to force their involvement.
Cornerbacks have both the lowest raw coverage rate and true coverage rate, as they receive the most negative grades out of any position. Since there is a large difference between raw and true coverage rates for reasons previously highlighted, it requires us to make an adjusted coverage rate for the seasons before 2019.
Different Rates for Defenders in Coverage
Many additional factors help create an adjusted coverage rate for defenders, such as pass breakups, targets, missed tackles, interceptions and average coverage grades. These rates vary greatly by position, as shown in the table below.
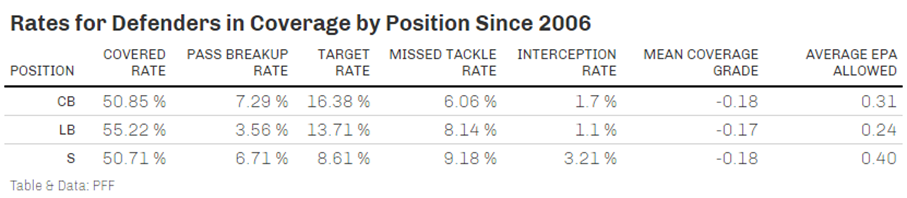
Since linebackers do not play as much press coverage, their pass-breakup rates are much lower, but their average EPA allowed to offenses is also the lowest, meaning they give offenses the most trouble in coverage. Safeties have the highest rate of getting interceptions but also miss the most tackles and allow the most EPA to offenses, at 0.4 per play. As expected, cornerbacks are targeted the most, but they do break up passes the most often.
