- Top IDP options return from injured reserve: Joey Bosa and Xavier McKinney are back in the lineup and can be trusted as potential starters in most IDP leagues.
- Dynasty stock rising: James Houston and Christian Barmore continue to emerge along the defensive line while Jalen Pitre makes his case for IDP playoff MVP.
- Defensive Player of the Year candidate, but maybe not for IDP: Micah Parsons has been one of the best players all year long, but there have been some ups and downs for IDP managers that drafted him highly, which should always have been taken into account given his unique position.
Estimated reading time: 33 minutes

WEEK 17 TAKEAWAYS
Make sure to check out last week’s waiver targets. Some of the key players stood out as potential adds after Week 17 for leagues of all sizes:
Waiver Wire
- LB – Harvey Langi, LV – Due to Darien Butler‘s injury, Langi stepped into the Raiders' secondary linebacker role but should only be considered in deeper IDP leagues as a part-time player.
- LB – Azeez Al-Shaair, SF – Dre Greenlaw suffered a back injury that kept him out for the rest of the game. Al-Shaair is his immediate replacement and would be a viable option in most leagues.
- LB – Tanner Muse, SEA – Jordyn Brooks suffered a torn ACL, ending his season. This will allow Muse to move into the secondary linebacker spot while Cody Barton plays an every-down role in Week 18.
- LB – Jack Gibbens, TEN – Gibbens played an every-down role this week as the Titans' top linebacker. He’ll be worth a shot in most leagues where there’s a need for linebacker help.
- EDGE – Joey Bosa, LAC – Bosa returned after an extended stint on injured reserve. He is an elite edge option and should be rostered where available.
- EDGE – Brandon Graham, PHI – With Josh Sweat more than likely out next week, Graham, who has been very efficient on limited snaps, will play a bigger role in Week 18.
- S – Tony Adams, NYJ – Adams filled in for the injured Lamarcus Joyner this week. Adams could be a viable deep league option in the final week.
- S – Xavier McKinney, NYG – McKinney returned after several weeks on injured reserve. He would definitely be a starting safety option in most IDP leagues.
JUMP TO A TEAM:
ARZ | ATL | BLT | CAR | CHI | CLE | DEN | DAL | DET | GB | HOU | IND | JAX | KC | LVR | LAC | LAR | MIA | MIN | NE | NO | NYG | NYJ | PHI | PIT | SF | SEA | TB | TEN | WSH
ARIZONA CARDINALS
Team Ranks
| Defensive snaps (Weekly rank) | Zone coverage rate (NFL rank) | Man coverage rate (NFL rank) | +EPA allowed % (NFL rank) |
| 62 (21st) | 75.8% (6th) | 17.7% (28th) | 48.3% (31st) |
- Dime personnel rate: 20.7% (5th)
- Blitz rate: 40.2% (2nd)
EDGE
| Player | Total defensive snap share | 1st/2nd down snap share | 3rd/4th down snap share | Pressure rate | Win rate | Pass-rush grade |
| Markus Golden | 79.0% | 75.5% | 92.3% | 13.6% | 22.7% | 69.6 |
| Myjai Sanders | 41.9% | 44.9% | 30.8% | 22.2% | 22.2% | 66.0 |
| Cameron Thomas | 37.1% | 28.6% | 69.2% | 0.0% | 0.0% | 51.7 |
| Dennis Gardeck | 29.0% | 28.6% | 30.8% | 0.0% | 0.0% | 55.7 |
| Jesse Luketa | 17.7% | 22.4% | 0.0% | 0.0% | 33.3% | 64.5 |
DEFENSIVE INTERIOR
| Player | Total defensive snap share | 1st/2nd down snap share | 3rd/4th down snap share | Pressure rate | Win rate | Pass-rush grade |
| J.J. Watt | 90.3% | 87.8% | 100% | 7.7% | 7.7% | 58.7 |
| Leki Fotu | 64.5% | 67.3% | 53.8% | 0.0% | 0.0% | 52.7 |
| Michael Dogbe | 64.5% | 75.5% | 23.1% | 22.2% | 27.8% | 69.1 |
| Manny Jones | 35.5% | 38.8% | 23.1% | 0.0% | 0.0% | 52.6 |
| Jonathan Ledbetter | 32.7% | 35.1% | 25.0% | 0.0% | 0.0% | 54.6 |
LINEBACKER
| Player | Total defensive snap share | 1st/2nd down snap share | 3rd/4th down snap share | Blitz rate | Tackle efficiency |
| Zaven Collins | 95.2% | 98.0% | 84.6% | 6.8% | 12.1% |
| Isaiah Simmons | 95.2% | 98.0% | 84.6% | 3.4% | 6.9% |
| Ezekiel Turner | 54.8% | 59.2% | 38.5% | 8.8% | 18.2% |
| Ben Niemann | 30.6% | 32.7% | 23.1% | 5.3% | 11.1% |
| Tanner Vallejo | 17.7% | 18.4% | 15.4% | 0.0% | 0.0% |
| Kamu Grugier-Hill | 11.3% | 0.0% | 53.8% | 14.3% | 0.0% |
SAFETY
| Player | Total defensive snap share | Box snap % | Deep safety % | Slot corner % | Defensive line % |
| Jalen Thompson | 98.4% | 31.1% | 50.8% | 14.8% | 1.6% |
| Chris Banjo | 14.5% | 0.0% | 77.8% | 22.2% | 0.0% |
| Josh Thomas | 1.6% | 0.0% | 100% | 0.0% | 0.0% |
CORNERBACK
| Player | Total defensive snap share | Wide corner % | Slot corner % | Box snap % | Forced incompletion % | Targets faced |
| Christian Matthew | 100% | 95.2% | 0.0% | 4.8% | 16.7% | 6 |
| Jace Whittaker | 95.2% | 83.1% | 5.1% | 11.9% | 16.7% | 6 |
ATLANTA FALCONS
Team Ranks
| Defensive snaps (Weekly rank) | Zone coverage rate (NFL rank) | Man coverage rate (NFL rank) | +EPA allowed % (NFL rank) |
| 74 (3rd) | 71.7% (10th) | 21.9% (23rd) | 48.6% (32nd) |
- Dime personnel rate: 0.0% (T-31st)
- Blitz rate: 22.1% (22nd)
EDGE
| Player | Total defensive snap share | 1st/2nd down snap share | 3rd/4th down snap share | Pressure rate | Win rate | Pass-rush grade |
| Lorenzo Carter | 79.7% | 75.4% | 100% | 13.3% | 13.3% | 54.4 |
| Adetokunbo Ogundeji | 48.6% | 52.5% | 30.8% | 5.9% | 5.9% | 55.2 |
| Arnold Ebiketie | 41.9% | 42.6% | 38.5% | 0.0% | 5.3% | 54.3 |
| Deangelo Malone | 29.7% | 29.5% | 30.8% | 0.0% | 0.0% | 50.7 |
DEFENSIVE INTERIOR
| Player | Total defensive snap share | 1st/2nd down snap share | 3rd/4th down snap share | Pressure rate | Win rate | Pass-rush grade |
| Grady Jarrett | 67.6% | 62.3% | 92.3% | 9.7% | 9.7% | 67.1 |
| Abdullah Anderson | 47.3% | 52.5% | 23.1% | 5.9% | 5.9% | 57.3 |
| Jalen Dalton | 41.9% | 37.7% | 61.5% | 4.5% | 9.1% | 58.3 |
| Timmy Horne | 39.2% | 45.9% | 7.7% | 0.0% | 6.3% | 58.0 |
| Jaleel Johnson | 23.0% | 27.9% | 0.0% | 0.0% | 11.1% | 64.0 |
LINEBACKER
| Player | Total defensive snap share | 1st/2nd down snap share | 3rd/4th down snap share | Blitz rate | Tackle efficiency |
| Rashaan Evans | 100% | 100% | 100% | 6.8% | 5.8% |
| Troy Andersen | 86.5% | 83.6% | 100% | 10.9% | 8.3% |
| Mykal Walker | 16.2% | 16.4% | 15.4% | 25.0% | 9.1% |
SAFETY
| Player | Total defensive snap share | Box snap % | Deep safety % | Slot corner % | Defensive line % |
| Richie Grant | 100% | 24.3% | 55.4% | 13.5% | 2.7% |
| Jaylinn Hawkins | 71.6% | 39.6% | 50.9% | 3.8% | 1.9% |
CORNERBACK
| Player | Total defensive snap share | Wide corner % | Slot corner % | Box snap % | Forced incompletion % | Targets faced |
| A.J. Terrell | 100% | 87.8% | 5.4% | 6.8% | 0.0% | 3 |
| Cornell Armstrong | 79.7% | 83.1% | 6.8% | 10.2% | 11.1% | 9 |
| Isaiah Oliver | 75.7% | 1.8% | 58.9% | 17.9% | 60.0% | 5 |
| Dee Alford | 31.1% | 0.0% | 100% | 0.0% | 25.0% | 4 |
| Darren Hall | 20.3% | 100% | 0.0% | 0.0% | 0.0% | 2 |
BALTIMORE RAVENS
Team Ranks
| Defensive snaps (Weekly rank) | Zone coverage rate (NFL rank) | Man coverage rate (NFL rank) | +EPA allowed % (NFL rank) |
| 70 (T-7th) | 70.1% (13th) | 22.2% (T-19th) | 45.1% (24th) |
- Dime personnel rate: 17.8% (7th)
- Blitz rate: 27.2% (14th)
EDGE
| Player | Total defensive snap share | 1st/2nd down snap share | 3rd/4th down snap share | Pressure rate | Win rate | Pass-rush grade |
| Tyus Bowser | 57.1% | 53.7% | 68.8% | 20.0% | 20.0% | 74.7 |
| Jason Pierre-Paul | 55.7% | 55.6% | 56.3% | 11.8% | 17.6% | 48.2 |
| Justin Houston | 48.6% | 42.6% | 68.8% | 18.8% | 18.8% | 51.1 |
| Odafe Oweh | 44.3% | 40.7% | 56.3% | 18.2% | 18.2% | 58.3 |
DEFENSIVE INTERIOR
| Player | Total defensive snap share | 1st/2nd down snap share | 3rd/4th down snap share | Pressure rate | Win rate | Pass-rush grade |
| Justin Madubuike | 64.3% | 57.4% | 87.5% | 8.3% | 4.2% | 59.5 |
| Broderick Washington Jr. | 57.1% | 63.0% | 37.5% | 0.0% | 0.0% | 59.5 |
| Brent Urban | 42.9% | 46.3% | 31.3% | 14.3% | 14.3% | 65.0 |
| Travis Jones | 37.1% | 42.6% | 18.8% | 0.0% | 0.0% | 56.0 |
| Rayshad Nichols | 37.5% | 51.7% | 0.0% | 0.0% | 0.0% | 58.8 |
LINEBACKER
| Player | Total defensive snap share | 1st/2nd down snap share | 3rd/4th down snap share | Blitz rate | Tackle efficiency |
| Roquan Smith | 100% | 100% | 100% | 2.9% | 12.9% |
| Patrick Queen | 94.3% | 92.6% | 100% | 7.6% | 10.6% |
| Malik Harrison | 1.4% | 0.0% | 6.3% | 0.0% | 0.0% |
SAFETY
| Player | Total defensive snap share | Box snap % | Deep safety % | Slot corner % | Defensive line % |
| Marcus Williams | 100% | 18.6% | 64.3% | 10.0% | 5.7% |
| Chuck Clark | 100% | 32.9% | 37.1% | 22.9% | 4.3% |
| Kyle Hamilton | 77.1% | 14.8% | 1.9% | 66.7% | 13.0% |
CORNERBACK
| Player | Total defensive snap share | Wide corner % | Slot corner % | Box snap % | Forced incompletion % | Targets faced |
| Marlon Humphrey | 98.6% | 63.8% | 4.3% | 27.5% | 0.0% | 0 |
| Brandon Stephens | 90.0% | 95.2% | 1.6% | 3.2% | 10.0% | 10 |
| Kevon Seymour | 8.6% | 83.3% | 0.0% | 16.7% | 0.0% | 1 |
CAROLINA PANTHERS
Team Ranks
| Defensive snaps (Weekly rank) | Zone coverage rate (NFL rank) | Man coverage rate (NFL rank) | +EPA allowed % (NFL rank) |
| 79 (2nd) | 71.6% (11th) | 20.5% (26th) | 43.6% (14th) |
- Dime personnel rate: 0.3% (T-29th)
- Blitz rate: 34.5% (7th)
EDGE
| Player | Total defensive snap share | 1st/2nd down snap share | 3rd/4th down snap share | Pressure rate | Win rate | Pass-rush grade |
| Brian Burns | 83.5% | 80.0% | 94.1% | 7.9% | 7.9% | 62.2 |
| Yetur Gross-Matos | 78.5% | 73.3% | 94.1% | 2.9% | 5.7% | 52.7 |
| Marquis Haynes | 32.9% | 30.0% | 47.1% | 6.3% | 0.0% | 55.7 |
| Henry Anderson | 22.8% | 26.7% | 11.8% | 0.0% | 0.0% | 50.9 |
DEFENSIVE INTERIOR
| Player | Total defensive snap share | 1st/2nd down snap share | 3rd/4th down snap share | Pressure rate | Win rate | Pass-rush grade |
| Derrick Brown | 73.4% | 71.7% | 76.5% | 11.8% | 14.7% | 59.1 |
| Matt Ioannidis | 68.4% | 71.7% | 52.9% | 10.7% | 10.7% | 55.3 |
| Bravvion Roy | 26.6% | 30.0% | 17.6% | 7.7% | 7.7% | 52.9 |
| Marquan McCall | 16.5% | 20.0% | 5.9% | 0.0% | 0.0% | 53.6 |
LINEBACKER
| Player | Total defensive snap share | 1st/2nd down snap share | 3rd/4th down snap share | Blitz rate | Tackle efficiency |
| Frankie Luvu | 100% | 100% | 100% | 17.7% | 16.4% |
| Shaq Thompson | 98.7% | 100% | 94.1% | 3.8% | 16.7% |
| Cory Littleton | 27.8% | 35.0% | 5.9% | 13.6% | 4.8% |
| Damien Wilson | 2.5% | 0.0% | 11.8% | 50.0% | 0.0% |
SAFETY
| Player | Total defensive snap share | Box snap % | Deep safety % | Slot corner % | Defensive line % |
| Xavier Woods | 100% | 57.0% | 27.8% | 13.9% | 1.3% |
| Jeremy Chinn | 100% | 22.8% | 12.7% | 55.7% | 6.3% |
| Myles Hartsfield | 54.4% | 7.0% | 60.5% | 30.2% | 0.0% |
| Sam Franklin | 16.5% | 0.0% | 46.2% | 46.2% | 7.7% |
CORNERBACK
| Player | Total defensive snap share | Wide corner % | Slot corner % | Box snap % | Forced incompletion % | Targets faced |
| C.J. Henderson | 97.5% | 84.4% | 3.9% | 11.7% | 9.1% | 11 |
| Keith Taylor | 86.1% | 95.6% | 4.4% | 0.0% | 0.0% | 5 |
CHICAGO BEARS
Team Ranks
| Defensive snaps (Weekly rank) | Zone coverage rate (NFL rank) | Man coverage rate (NFL rank) | +EPA allowed % (NFL rank) |
| 71 (T-5th) | 65.3% (T-23rd) | 28.4% (9th) | 46.1% (28th) |
- Dime personnel rate: 2.2% (24th)
- Blitz rate: 21.0% (24th)
EDGE
| Player | Total defensive snap share | 1st/2nd down snap share | 3rd/4th down snap share | Pressure rate | Win rate | Pass-rush grade |
| Trevis Gipson | 71.8% | 69.6% | 80.0% | 10.0% | 5.0% | 58.1 |
| Dominique Robinson | 66.2% | 57.1% | 100% | 5.3% | 10.5% | 59.1 |
| Al-Quadin Muhammad | 52.1% | 46.4% | 73.3% | 0.0% | 0.0% | 56.3 |
DEFENSIVE INTERIOR
| Player | Total defensive snap share | 1st/2nd down snap share | 3rd/4th down snap share | Pressure rate | Win rate | Pass-rush grade |
| Justin Jones | 66.2% | 62.5% | 80.0% | 8.0% | 8.0% | 53.9 |
| Angelo Blackson | 49.3% | 53.6% | 33.3% | 0.0% | 0.0% | 53.2 |
| Mike Pennel | 46.5% | 55.4% | 13.3% | 0.0% | 7.7% | 62.1 |
| Armon Watts | 42.3% | 48.2% | 20.0% | 18.2% | 9.1% | 62.0 |
| Andrew Brown | 9.9% | 12.5% | 0.0% | 0.0% | 0.0% | 56.8 |
LINEBACKER
| Player | Total defensive snap share | 1st/2nd down snap share | 3rd/4th down snap share | Blitz rate | Tackle efficiency |
| Nicholas Morrow | 100% | 100% | 100% | 7.0% | 8.6% |
| Joe Thomas | 98.6% | 100% | 93.3% | 4.3% | 15.9% |
| Matthew Adams | 42.3% | 48.2% | 20.0% | 6.7% | 23.3% |
| DeMarquis Gates | 1.4% | 1.8% | 0.0% | 0.0% | 100% |
SAFETY
| Player | Total defensive snap share | Box snap % | Deep safety % | Slot corner % | Defensive line % |
| Jaquan Brisker | 100% | 42.3% | 29.6% | 9.9% | 16.9% |
| DeAndre Houston-Carson | 71.8% | 27.5% | 60.8% | 9.8% | 0.0% |
| Elijah Hicks | 29.6% | 19.0% | 76.2% | 4.8% | 0.0% |
CORNERBACK
| Player | Total defensive snap share | Wide corner % | Slot corner % | Box snap % | Forced incompletion % | Targets faced |
| Kyler Gordon | 98.6% | 82.9% | 1.4% | 5.7% | 0.0% | 7 |
| Josh Blackwell | 57.7% | 2.4% | 80.5% | 17.1% | 0.0% | 2 |
| Harrison Hand | 56.3% | 90.0% | 0.0% | 5.0% | 100% | 1 |
| Jaylon Jones | 39.4% | 92.9% | 0.0% | 3.6% | 0.0% | 3 |
CLEVELAND BROWNS
Team Ranks
| Defensive snaps (Weekly rank) | Zone coverage rate (NFL rank) | Man coverage rate (NFL rank) | +EPA allowed % (NFL rank) |
| 69 (T-10th) | 72.0% (9th) | 20.6% (25th) | 43.2% (13th) |
- Dime personnel rate: 13.7% (14th)
- Blitz rate: 23.3% (19th)
EDGE
| Player | Total defensive snap share | 1st/2nd down snap share | 3rd/4th down snap share | Pressure rate | Win rate | Pass-rush grade |
| Myles Garrett | 75.4% | 64.6% | 100% | 12.0% | 16.0% | 72.8 |
| Jadeveon Clowney | 73.9% | 62.5% | 100% | 11.1% | 7.4% | 57.2 |
| Chase Winovich | 37.7% | 50.0% | 9.5% | 9.1% | 9.1% | 58.9 |
| Alex Wright | 34.8% | 29.2% | 47.6% | 0.0% | 7.7% | 53.7 |
- POINT OF INTEREST: Fantasy managers frustrated by Myles Garrett’s down week in Week 16 got the bounce-back that was expected this week with 1.5 sacks, helping do his part to secure fantasy championships.
DEFENSIVE INTERIOR
| Player | Total defensive snap share | 1st/2nd down snap share | 3rd/4th down snap share | Pressure rate | Win rate | Pass-rush grade |
| Taven Bryan | 55.1% | 66.7% | 28.6% | 14.3% | 14.3% | 74.8 |
| Perrion Winfrey | 55.1% | 41.7% | 85.7% | 4.2% | 8.3% | 54.1 |
| Jordan Elliott | 44.9% | 50.0% | 33.3% | 0.0% | 12.5% | 63.5 |
| Roderick Perry II | 24.6% | 33.3% | 4.8% | 20.0% | 20.0% | 65.9 |
LINEBACKER
| Player | Total defensive snap share | 1st/2nd down snap share | 3rd/4th down snap share | Blitz rate | Tackle efficiency |
| Tony Fields II | 78.3% | 91.7% | 47.6% | 1.9% | 16.7% |
| Deion Jones | 65.2% | 50.0% | 100% | 2.2% | 11.4% |
| Jermaine Carter | 42.0% | 58.3% | 4.8% | 10.3% | 20.7% |
| Reggie Ragland | 34.8% | 50.0% | 0.0% | 0.0% | 8.3% |
- POINT OF INTEREST: The Browns linebacker corps has been about as untrustworthy as any unit in the league this season. It should surprise no IDP managers that have been paying attention to them this season that the snaps have fluctuated once again. There isn’t a startable player in this group for most IDP leagues.
SAFETY
| Player | Total defensive snap share | Box snap % | Deep safety % | Slot corner % | Defensive line % |
| Grant Delpit | 100% | 27.5% | 44.9% | 23.2% | 4.3% |
| John Johnson III | 98.6% | 17.6% | 64.7% | 17.6% | 0.0% |
| D'Anthony Bell | 31.9% | 0.0% | 50.0% | 50.0% | 0.0% |
CORNERBACK
| Player | Total defensive snap share | Wide corner % | Slot corner % | Box snap % | Forced incompletion % | Targets faced |
| Greg Newsome II | 92.8% | 60.9% | 31.3% | 7.8% | 0.0% | 2 |
| Denzel Ward | 66.7% | 89.1% | 0.0% | 10.9% | 0.0% | 1 |
| Martin Emerson | 63.8% | 90.9% | 2.3% | 6.8% | 66.7% | 3 |
| A.J. Green | 24.6% | 23.5% | 76.5% | 0.0% | 0.0% | 4 |
DALLAS COWBOYS
Team Ranks
| Defensive snaps (Weekly rank) | Zone coverage rate (NFL rank) | Man coverage rate (NFL rank) | +EPA allowed % (NFL rank) |
| 65 (16th) | 68.4% (17th) | 27.4% (10th) | 42.2% (9th) |
- Dime personnel rate: 22.0% (4th)
- Blitz rate: 28.1% (12th)
EDGE
| Player | Total defensive snap share | 1st/2nd down snap share | 3rd/4th down snap share | Pressure rate | Win rate | Pass-rush grade |
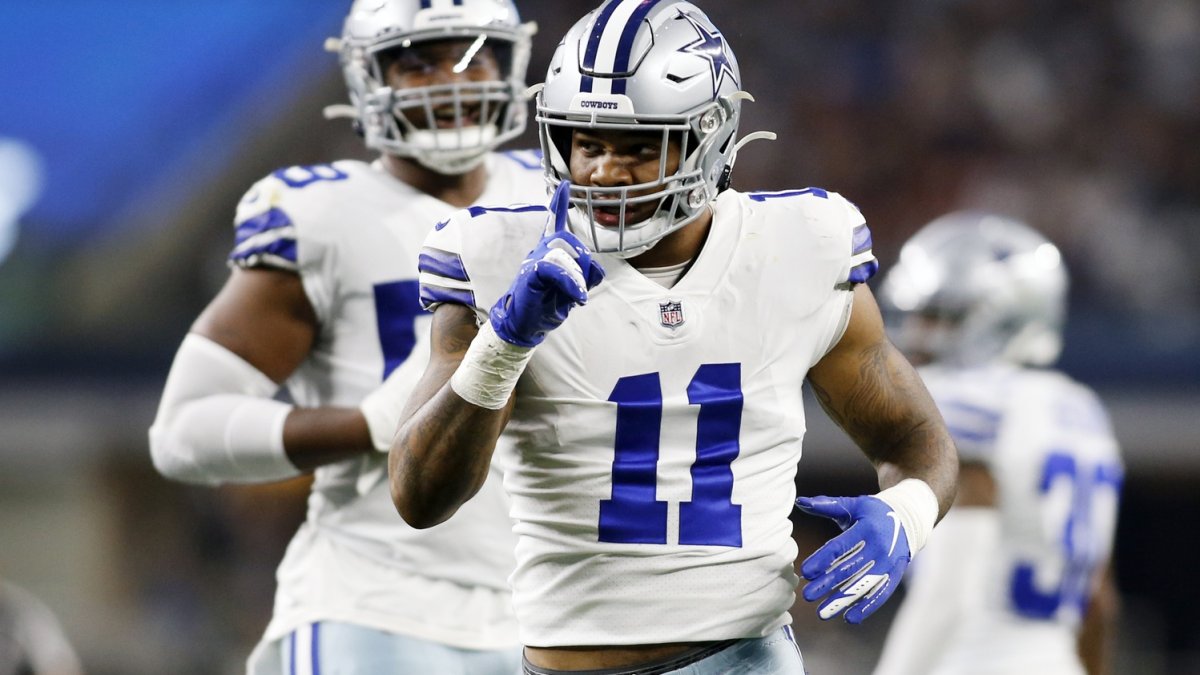
| Micah Parsons | 73.8% | 63.8% | 100% | 18.8% | 18.8% | 79.6 |
| Dorance Armstrong | 50.8% | 42.6% | 72.2% | 4.8% | 9.5% | 57.1 |
| Demarcus Lawrence | 47.7% | 42.6% | 61.1% | 9.5% | 19.1% | 92.3 |
| Sam Williams | 40.0% | 44.7% | 27.8% | 18.8% | 18.8% | 68.2 |
| Dante Fowler Jr. | 29.2% | 21.3% | 50.0% | 20.0% | 20.0% | 92.4 |
- POINT OF INTEREST: Micah Parsons has been an NFL Defensive Player of the Year candidate all season long, but for IDP purposes, there have been plenty of ups and downs throughout the season. This was always the argument for Parsons being a riskier fantasy pick because as great as the highs are — he’s had six multi-sack games this season — his tackle floor is lower than the majority of every-down linebackers, which is what he’s designated as on most fantasy platforms. This has left him with nine games where he didn’t land a sack and ended with no more than seven combined tackles. Parsons will undoubtedly be listed as a defensive end/edge on fantasy platforms next season, so it should become less of an issue for IDP.
DEFENSIVE INTERIOR
| Player | Total defensive snap share | 1st/2nd down snap share | 3rd/4th down snap share | Pressure rate | Win rate | Pass-rush grade |
| Osa Odighizuwa | 43.8% | 56.7% | 22.2% | 0.0% | 15.4% | 68.5 |
| Carlos Watkins | 36.9% | 48.9% | 5.6% | 0.0% | 0.0% | 54.0 |
| Neville Gallimore | 35.4% | 44.7% | 11.1% | 7.7% | 7.7% | 61.6 |
| Quinton Bohanna | 20.0% | 25.5% | 5.6% | 0.0% | 0.0% | 56.0 |
LINEBACKER
| Player | Total defensive snap share | 1st/2nd down snap share | 3rd/4th down snap share | Blitz rate | Tackle efficiency |
| Anthony Barr | 66.2% | 68.1% | 61.1% | 7.0% | 7.0% |
| Damone Clark | 64.6% | 76.6% | 33.3% | 0.0% | 14.3% |
| Jabril Cox | 27.7% | 29.8% | 22.2% | 0.0% | 11.1% |
| Luke Gifford | 16.9% | 21.3% | 5.6% | 0.0% | 0.0% |
- POINT OF INTEREST: The Cowboys linebackers have often been part-time players this season and due to none of them being overly efficient, there just wasn’t much fantasy relevance between them.
SAFETY
| Player | Total defensive snap share | Box snap % | Deep safety % | Slot corner % | Defensive line % |
| Jayron Kearse | 93.8% | 44.3% | 24.6% | 14.8% | 16.4% |
| Malik Hooker | 90.8% | 5.1% | 79.7% | 11.9% | 3.4% |
| Donovan Wilson | 58.5% | 39.5% | 42.1% | 7.9% | 10.5% |
| Israel Mukuamu | 6.2% | 75.0% | 0.0% | 0.0% | 25.0% |
CORNERBACK
| Player | Total defensive snap share | Wide corner % | Slot corner % | Box snap % | Forced incompletion % | Targets faced |
| Trevon Diggs | 100% | 92.3% | 1.5% | 4.6% | 16.7% | 6 |
| DaRon Bland | 95.4% | 16.1% | 74.2% | 8.1% | 0.0% | 3 |
| Nahshon Wright | 72.3% | 97.9% | 0.0% | 2.1% | 10.0% | 10 |
| Kelvin Joseph | 3.1% | 100% | 0.0% | 0.0% | 0.0% | 0 |
DENVER BRONCOS
Team Ranks
| Defensive snaps (Weekly rank) | Zone coverage rate (NFL rank) | Man coverage rate (NFL rank) | +EPA allowed % (NFL rank) |
| 61 (22nd) | 77.1% (3rd) | 16.7% (30th) | 41.9% (T-6th) |
- Dime personnel rate: 10.7% (17th)
- Blitz rate: 37.2% (4th)
EDGE
| Player | Total defensive snap share | 1st/2nd down snap share | 3rd/4th down snap share | Pressure rate | Win rate | Pass-rush grade |
| Jonathon Cooper | 77.0% | 73.5% | 90.9% | 8.7% | 4.3% | 64.3 |
| Nik Bonitto | 60.7% | 59.2% | 72.7% | 8.7% | 4.3% | 52.0 |
| Jonathan Kongbo | 32.8% | 38.8% | 9.1% | 0.0% | 0.0% | 52.2 |
| Wyatt Ray | 26.2% | 28.6% | 9.1% | 16.7% | 16.7% | 57.4 |
DEFENSIVE INTERIOR
| Player | Total defensive snap share | 1st/2nd down snap share | 3rd/4th down snap share | Pressure rate | Win rate | Pass-rush grade |
| DeShawn Williams | 72.1% | 69.4% | 81.8% | 3.2% | 3.2% | 57.9 |
| Jonathan Harris | 68.9% | 69.4% | 72.7% | 3.5% | 3.5% | 53.0 |
| Mike Purcell | 60.7% | 61.2% | 54.5% | 4.3% | 4.3% | 56.8 |
| Eyioma Uwazurike | 32.8% | 30.6% | 36.4% | 0.0% | 0.0% | 50.8 |
| Matt Henningsen | 27.7% | 30.6% | 10.0% | 0.0% | 0.0% | 53.7 |
| Elijah Garcia | 11.5% | 14.3% | 0.0% | 0.0% | 0.0% | 54.4 |
LINEBACKER
| Player | Total defensive snap share | 1st/2nd down snap share | 3rd/4th down snap share | Blitz rate | Tackle efficiency |
| Josey Jewell | 98.4% | 100% | 100% | 5.0% | 10.3% |
| Alex Singleton | 67.2% | 69.4% | 54.5% | 4.9% | 20.5% |
SAFETY
| Player | Total defensive snap share | Box snap % | Deep safety % | Slot corner % | Defensive line % |
| Kareem Jackson | 98.4% | 18.3% | 55.0% | 26.7% | 0.0% |
| Justin Simmons | 98.4% | 21.7% | 61.7% | 16.7% | 0.0% |
| P.J. Locke | 1.6% | 0.0% | 0.0% | 0.0% | 0.0% |
CORNERBACK
| Player | Total defensive snap share | Wide corner % | Slot corner % | Box snap % | Forced incompletion % | Targets faced |
| Patrick Surtain II | 98.4% | 95.0% | 0.0% | 5.0% | 0.0% | 0 |
| Lamar Jackson | 68.9% | 95.2% | 0.0% | 2.4% | 20.0% | 10 |
| K'Waun Williams | 63.9% | 0.0% | 94.9% | 2.6% | 16.7% | 6 |
| Damarri Mathis | 31.1% | 100% | 0.0% | 0.0% | 0.0% | 2 |
| Essang Bassey | 6.6% | 0.0% | 75.0% | 0.0% | 0.0% | 0 |
DETROIT LIONS
Team Ranks
| Defensive snaps (Weekly rank) | Zone coverage rate (NFL rank) | Man coverage rate (NFL rank) | +EPA allowed % (NFL rank) |
| 52 (T-28th) | 55.5% (30th) | 37.4% (3rd) | 47.3% (29th) |
- Dime personnel rate: 3.5% (22nd)
- Blitz rate: 32.2% (10th)
EDGE
| Player | Total defensive snap share | 1st/2nd down snap share | 3rd/4th down snap share | Pressure rate | Win rate | Pass-rush grade |
| Aidan Hutchinson | 71.2% | 63.2% | 92.9% | 31.8% | 31.8% | 85.9 |
| James Houston IV | 63.5% | 57.9% | 78.6% | 13.3% | 20.0% | 91.6 |
| John Cominsky | 63.5% | 60.5% | 71.4% | 21.1% | 21.1% | 64.4 |
| Josh Paschal | 48.1% | 39.5% | 71.4% | 23.5% | 23.5% | 66.8 |
| Romeo Okwara | 28.8% | 36.8% | 7.1% | 28.6% | 28.6% | 61.4 |
- ROOKIE WATCH: James Houston saw his playing time increase significantly this week, playing more than 50% of Detroit's defensive snaps for the first time all season, which allowed him to land three sacks and bring his season total up to eight in just six games. Houston’s sack rate (8.9%) is by far the highest in the league for his position, and it should be considered unstable for fantasy managers looking to chase those points, but an increase in his playing time is a big help for a better production floor at the very least.
DEFENSIVE INTERIOR
| Player | Total defensive snap share | 1st/2nd down snap share | 3rd/4th down snap share | Pressure rate | Win rate | Pass-rush grade |
| Isaiah Buggs | 59.6% | 71.1% | 28.6% | 23.5% | 23.5% | 66.4 |
| Alim McNeill | 53.8% | 65.8% | 21.4% | 12.5% | 12.5% | 60.8 |
| Benito Jones | 70.3% | 91.7% | 30.8% | 25.0% | 25.0% | 70.9 |
LINEBACKER
| Player | Total defensive snap share | 1st/2nd down snap share | 3rd/4th down snap share | Blitz rate | Tackle efficiency |
| Alex Anzalone | 73.1% | 73.7% | 71.4% | 7.9% | 18.4% |
| Derrick Barnes | 51.9% | 52.6% | 50.0% | 3.7% | 8.0% |
| Malcolm Rodriguez | 50.0% | 55.3% | 35.7% | 11.5% | 16.0% |
| Josh Woods | 13.5% | 15.8% | 7.1% | 42.9% | 0.0% |
| Chris Board | 9.6% | 0.0% | 35.7% | 0.0% | 0.0% |
SAFETY
| Player | Total defensive snap share | Box snap % | Deep safety % | Slot corner % | Defensive line % |
| Kerby Joseph | 92.3% | 8.3% | 83.3% | 8.3% | 0.0% |
| Ifeatu Melifonwu | 50.0% | 46.2% | 38.5% | 15.4% | 0.0% |
| C.J. Moore | 11.5% | 0.0% | 83.3% | 16.7% | 0.0% |
| Brady Breeze | 7.7% | 0.0% | 50.0% | 50.0% | 0.0% |
CORNERBACK
| Player | Total defensive snap share | Wide corner % | Slot corner % | Box snap % | Forced incompletion % | Targets faced |
| Will Harris | 94.2% | 2.0% | 71.4% | 24.5% | 50.0% | 4 |
| Jerry Jacobs | 73.1% | 86.8% | 2.6% | 10.5% | 0.0% | 2 |
| Mike Hughes | 65.4% | 91.2% | 0.0% | 8.8% | 0.0% | 0 |
| Jeffrey Okudah | 32.7% | 94.1% | 5.9% | 0.0% | 0.0% | 0 |
| Amani Oruwariye | 26.9% | 100% | 0.0% | 0.0% | 100% | 1 |
GREEN BAY PACKERS
Team Ranks
| Defensive snaps (Weekly rank) | Zone coverage rate (NFL rank) | Man coverage rate (NFL rank) | +EPA allowed % (NFL rank) |
| 58 (T-24th) | 72.3% (8th) | 21.3% (24th) | 45.5% (25th) |
- Dime personnel rate: 4.3% (20th)
- Blitz rate: 36.2% (5th)
EDGE
| Player | Total defensive snap share | 1st/2nd down snap share | 3rd/4th down snap share | Pressure rate | Win rate | Pass-rush grade |
| Preston Smith | 58.6% | 50.0% | 85.7% | 8.3% | 16.7% | 57.9 |
| Kingsley Enagbare | 58.6% | 59.1% | 57.1% | 19.1% | 23.8% | 69.4 |
| Justin Hollins | 44.8% | 47.7% | 35.7% | 15.8% | 15.8% | 58.6 |
| Jonathan Garvin | 31.0% | 36.4% | 14.3% | 0.0% | 0.0% | 52.2 |
DEFENSIVE INTERIOR
| Player | Total defensive snap share | 1st/2nd down snap share | 3rd/4th down snap share | Pressure rate | Win rate | Pass-rush grade |
| Kenny Clark | 62.1% | 59.1% | 71.4% | 16.0% | 20.0% | 91.2 |
| Devonte Wyatt | 58.6% | 61.4% | 50.0% | 4.3% | 4.3% | 47.8 |
| Jarran Reed | 56.9% | 54.5% | 64.3% | 9.1% | 9.1% | 56.7 |
| Tedarrell Slaton | 41.4% | 47.7% | 21.4% | 0.0% | 8.3% | 74.1 |
LINEBACKER
| Player | Total defensive snap share | 1st/2nd down snap share | 3rd/4th down snap share | Blitz rate | Tackle efficiency |
| De’Vondre Campbell | 79.3% | 79.5% | 78.6% | 2.2% | 17.8% |
| Quay Walker | 70.7% | 79.5% | 42.9% | 9.8% | 20.0% |
| Isaiah McDuffie | 20.7% | 20.5% | 21.4% | 0.0% | 41.7% |
| Eric Wilson | 20.7% | 20.5% | 21.4% | 0.0% | 8.3% |
SAFETY
| Player | Total defensive snap share | Box snap % | Deep safety % | Slot corner % | Defensive line % |
| Rudy Ford | 86.2% | 0.0% | 96.0% | 4.0% | 0.0% |
| Adrian Amos | 79.3% | 15.2% | 76.1% | 8.7% | 0.0% |
| Darnell Savage | 77.6% | 15.6% | 13.3% | 71.1% | 0.0% |
| Tariq Carpenter | 22.4% | 7.7% | 76.9% | 15.4% | 0.0% |
CORNERBACK
| Player | Total defensive snap share | Wide corner % | Slot corner % | Box snap % | Forced incompletion % | Targets faced |
| Rasul Douglas | 100% | 89.7% | 1.7% | 6.9% | 14.3% | 7 |
| Jaire Alexander | 79.3% | 93.5% | 4.3% | 0.0% | 50.0% | 2 |
| Innis Gaines | 31.0% | 11.1% | 66.7% | 22.2% | 0.0% | 0 |
| Corey Ballentine | 20.7% | 100% | 0.0% | 0.0% | 0.0% | 2 |
HOUSTON TEXANS
Team Ranks
| Defensive snaps (Weekly rank) | Zone coverage rate (NFL rank) | Man coverage rate (NFL rank) | +EPA allowed % (NFL rank) |
| 63 (T-18th) | 67.1% (20th) | 25.1% (15th) | 45.6% (26th) |
- Dime personnel rate: 0.0% (T-31st)
- Blitz rate: 19.6% (25th)
EDGE
| Player | Total defensive snap share | 1st/2nd down snap share | 3rd/4th down snap share | Pressure rate | Win rate | Pass-rush grade |
| Ogbonnia Okoronkwo | 58.7% | 62.7% | 41.7% | 5.9% | 5.9% | 65.1 |
| Jerry Hughes | 55.6% | 56.9% | 50.0% | 15.8% | 15.8% | 55.8 |
| Mario Addison | 44.4% | 43.1% | 50.0% | 8.3% | 8.3% | 58.6 |
| Jonathan Greenard | 41.3% | 37.3% | 58.3% | 8.3% | 8.3% | 58.0 |
| Rasheem Green | 41.3% | 37.3% | 58.3% | 0.0% | 0.0% | 51.8 |
DEFENSIVE INTERIOR
| Player | Total defensive snap share | 1st/2nd down snap share | 3rd/4th down snap share | Pressure rate | Win rate | Pass-rush grade |
| Maliek Collins | 58.7% | 62.7% | 41.7% | 15.8% | 15.8% | 64.0 |
| Roy Lopez | 54.0% | 60.8% | 25.0% | 0.0% | 0.0% | 52.7 |
| Kurt Hinish | 39.7% | 37.3% | 50.0% | 9.1% | 9.1% | 61.7 |
LINEBACKER
| Player | Total defensive snap share | 1st/2nd down snap share | 3rd/4th down snap share | Blitz rate | Tackle efficiency |
| Christian Harris | 100% | 100% | 100% | 4.8% | 10.0% |
| Christian Kirksey | 100% | 100% | 100% | 4.8% | 10.0% |
| Jake Hansen | 27.0% | 31.4% | 25.0% | 0.0% | 0.0% |
| Blake Cashman | 9.5% | 5.9% | 8.3% | 50.0% | 33.3% |
SAFETY
| Player | Total defensive snap share | Box snap % | Deep safety % | Slot corner % | Defensive line % |
| Jalen Pitre | 96.8% | 8.2% | 88.5% | 3.3% | 0.0% |
| Jonathan Owens | 69.8% | 31.8% | 20.5% | 27.3% | 18.2% |
| M.J. Stewart | 30.2% | 36.8% | 10.5% | 26.3% | 26.3% |
| Eric Murray | 3.2% | 0.0% | 100% | 0.0% | 0.0% |
- ROOKIE WATCH: Jalen Pitre is in the conversation for the end of the fantasy season/fantasy playoffs MVP due to his production over the past five weeks. Since Week 13, Pitre has posted a total of 58 tackles (first at his position) and three interceptions. He’s done this while playing 85% of his defensive snaps from a deep alignment, making the tackle production all the more impressive.
CORNERBACK
| Player | Total defensive snap share | Wide corner % | Slot corner % | Box snap % | Forced incompletion % | Targets faced |
| Steven Nelson | 100% | 84.1% | 9.5% | 1.6% | 0.0% | 6 |
| Desmond King II | 96.8% | 85.2% | 9.8% | 3.3% | 12.5% | 8 |
| Tavierre Thomas | 73.0% | 0.0% | 95.7% | 0.0% | 0.0% | 2 |
INDIANAPOLIS COLTS
Team Ranks
| Defensive snaps (Weekly rank) | Zone coverage rate (NFL rank) | Man coverage rate (NFL rank) | +EPA allowed % (NFL rank) |
| 63 (T-18th) | 68.7% (16th) | 22.2% (21st) | 44.8% (21st) |
- Dime personnel rate: 0.6% (27th)
- Blitz rate: 15.1% (32nd)
EDGE
| Player | Total defensive snap share | 1st/2nd down snap share | 3rd/4th down snap share | Pressure rate | Win rate | Pass-rush grade |
| Kwity Paye | 82.5% | 80.0% | 100% | 4.0% | 4.0% | 56.7 |
| Dayo Odeyingbo | 74.6% | 74.5% | 75.0% | 4.2% | 4.2% | 53.8 |
| Khalid Kareem | 31.7% | 30.9% | 37.5% | 11.1% | 11.1% | 55.2 |
| Ben Banogu | 12.7% | 14.5% | 0.0% | 50.0% | 50.0% | 56.6 |
| Kameron Cline | 3.2% | 3.6% | 0.0% | 0.0% | 0.0% | 59.1 |
DEFENSIVE INTERIOR
| Player | Total defensive snap share | 1st/2nd down snap share | 3rd/4th down snap share | Pressure rate | Win rate | Pass-rush grade |
| DeForest Buckner | 76.2% | 74.5% | 87.5% | 8.7% | 21.7% | 73.1 |
| Grover Stewart | 73.0% | 70.9% | 87.5% | 4.5% | 4.5% | 51.7 |
| Byron Cowart | 30.2% | 32.7% | 12.5% | 0.0% | 0.0% | 53.7 |
| Chris Williams | 19.2% | 22.7% | 0.0% | 33.3% | 33.3% | 68.4 |
LINEBACKER
| Player | Total defensive snap share | 1st/2nd down snap share | 3rd/4th down snap share | Blitz rate | Tackle efficiency |
| Zaire Franklin | 100% | 100% | 100% | 3.2% | 14.8% |
| Bobby Okereke | 96.8% | 96.4% | 100% | 6.6% | 25.4% |
| E.J. Speed | 12.7% | 12.7% | 12.5% | 0.0% | 12.5% |
SAFETY
| Player | Total defensive snap share | Box snap % | Deep safety % | Slot corner % | Defensive line % |
| Rodney McLeod | 100% | 52.4% | 23.8% | 22.2% | 1.6% |
| Julian Blackmon | 100% | 3.2% | 7.9% | 85.7% | 0.0% |
| Rodney Thomas II | 90.5% | 7.0% | 80.7% | 12.3% | 0.0% |
CORNERBACK
| Player | Total defensive snap share | Wide corner % | Slot corner % | Box snap % | Forced incompletion % | Targets faced |
| Stephon Gilmore | 100% | 95.2% | 0.0% | 4.8% | 0.0% | 0 |
| Dallis Flowers | 93.7% | 83.1% | 1.7% | 15.3% | 0.0% | 3 |
| Brandon Facyson | 6.3% | 100% | 0.0% | 0.0% | 0.0% | 0 |
JACKSONVILLE JAGUARS
Team Ranks
| Defensive snaps (Weekly rank) | Zone coverage rate (NFL rank) | Man coverage rate (NFL rank) | +EPA allowed % (NFL rank) |
| 70 (T-7th) | 66.6% (21st) | 26.8% (12th) | 44.6% (T-19th) |
- Dime personnel rate: 0.4% (28th)
- Blitz rate: 25.2% (15th)
EDGE
| Player | Total defensive snap share | 1st/2nd down snap share | 3rd/4th down snap share | Pressure rate | Win rate | Pass-rush grade |
| Josh Allen | 77.1% | 69.4% | 95.2% | 25.7% | 22.9% | 90.9 |
| Arden Key | 58.6% | 51.0% | 76.2% | 16.7% | 29.2% | 77.1 |
| K'Lavon Chaisson | 47.1% | 53.1% | 33.3% | 13.0% | 13.0% | 53.9 |
| Travon Walker | 37.1% | 28.6% | 57.1% | 9.5% | 9.5% | 59.6 |
DEFENSIVE INTERIOR
| Player | Total defensive snap share | 1st/2nd down snap share | 3rd/4th down snap share | Pressure rate | Win rate | Pass-rush grade |
| Roy Robertson-Harris | 50.0% | 53.1% | 42.9% | 19.1% | 19.1% | 73.1 |
| Folorunso Fatukasi | 47.1% | 51.0% | 38.1% | 9.5% | 9.5% | 50.7 |
| Davon Hamilton | 38.6% | 44.9% | 23.8% | 6.3% | 6.3% | 59.2 |
| Corey Peters | 35.7% | 40.8% | 23.8% | 0.0% | 6.7% | 59.8 |
| Adam Gotsis | 35.2% | 38.2% | 30.0% | 21.4% | 21.4% | 84.6 |
LINEBACKER
| Player | Total defensive snap share | 1st/2nd down snap share | 3rd/4th down snap share | Blitz rate | Tackle efficiency |
| Foyesade Oluokun | 74.3% | 75.5% | 71.4% | 7.7% | 13.3% |
| Devin Lloyd | 60.0% | 61.2% | 57.1% | 4.8% | 8.3% |
| Chad Muma | 40.0% | 38.8% | 42.9% | 3.6% | 29.4% |
| Shaquille Quarterman | 25.7% | 24.5% | 28.6% | 5.6% | 50.0% |
- POINT OF INTEREST: The Jaguars mixed Chad Muma in a little more this week but part of that likely came from them blowing out the Texans. Even Foyesade Oluokun’s playing time ended early in the fourth quarter.
SAFETY
| Player | Total defensive snap share | Box snap % | Deep safety % | Slot corner % | Defensive line % |
| Rayshawn Jenkins | 74.3% | 50.0% | 28.8% | 15.4% | 1.9% |
| Andre Cisco | 74.3% | 21.2% | 71.2% | 7.7% | 0.0% |
| Andrew Wingard | 34.3% | 20.8% | 41.7% | 37.5% | 0.0% |
| Daniel Thomas | 25.7% | 0.0% | 94.4% | 5.6% | 0.0% |
CORNERBACK
| Player | Total defensive snap share | Wide corner % | Slot corner % | Box snap % | Forced incompletion % | Targets faced |
| Tre Herndon | 74.3% | 0.0% | 96.2% | 1.9% | 0.0% | 4 |
| Tyson Campbell | 74.3% | 82.7% | 7.7% | 9.6% | 0.0% | 6 |
| Darious Williams | 72.9% | 78.4% | 9.8% | 11.8% | 33.3% | 3 |
| Chris Claybrooks | 25.7% | 100.0% | 0.0% | 0.0% | 0.0% | 0 |
| Gregory Junior | 25.7% | 94.4% | 5.6% | 0.0% | 0.0% | 4 |
KANSAS CITY CHIEFS
Team Ranks
| Defensive snaps (Weekly rank) | Zone coverage rate (NFL rank) | Man coverage rate (NFL rank) | +EPA allowed % (NFL rank) |
| 70 (T-7th) | 61.5% (29th) | 28.8% (8th) | 44.9% (22nd) |
- Dime personnel rate: 22.7% (3rd)
- Blitz rate: 27.7% (13th)
EDGE
| Player | Total defensive snap share | 1st/2nd down snap share | 3rd/4th down snap share | Pressure rate | Win rate | Pass-rush grade |
| Frank Clark | 75.7% | 71.7% | 88.2% | 12.5% | 15.6% | 60.6 |
| George Karlaftis | 51.4% | 45.3% | 70.6% | 4.3% | 8.7% | 64.1 |
| Carlos Dunlap | 50.0% | 56.6% | 29.4% | 15.8% | 10.5% | 64.7 |
| Michael Danna | 48.6% | 41.5% | 70.6% | 13.6% | 13.6% | 72.0 |
DEFENSIVE INTERIOR
| Player | Total defensive snap share | 1st/2nd down snap share | 3rd/4th down snap share | Pressure rate | Win rate | Pass-rush grade |
| Chris Jones | 70.0% | 60.4% | 100% | 6.9% | 10.3% | 70.1 |
| Khalen Saunders | 50.0% | 64.2% | 5.9% | 4.8% | 9.5% | 68.8 |
| Brandon Williams | 28.6% | 37.7% | 0.0% | 0.0% | 0.0% | 54.8 |
| Derrick Nnadi | 20.0% | 22.6% | 11.8% | 0.0% | 0.0% | 58.1 |
LINEBACKER
| Player | Total defensive snap share | 1st/2nd down snap share | 3rd/4th down snap share | Blitz rate | Tackle efficiency |
| Nick Bolton | 98.6% | 98.1% | 100% | 5.8% | 13.8% |
| Willie Gay Jr. | 62.9% | 73.6% | 29.4% | 6.8% | 20.9% |
| Leo Chenal | 31.4% | 41.5% | 0.0% | 9.1% | 13.6% |
| Darius Harris | 17.1% | 17.0% | 17.6% | 8.3% | 18.2% |
SAFETY
| Player | Total defensive snap share | Box snap % | Deep safety % | Slot corner % | Defensive line % |
| Justin Reid | 100% | 32.9% | 42.9% | 15.7% | 4.3% |
| Juan Thornhill | 100% | 10.0% | 74.3% | 11.4% | 2.9% |
| Bryan Cook | 27.1% | 42.1% | 47.4% | 0.0% | 0.0% |
CORNERBACK
| Player | Total defensive snap share | Wide corner % | Slot corner % | Box snap % | Forced incompletion % | Targets faced |
| Trent McDuffie | 100% | 17.1% | 57.1% | 21.4% | 0.0% | 4 |
| L'Jarius Sneed | 80.0% | 92.9% | 5.4% | 1.8% | 0.0% | 3 |
| Jaylen Watson | 68.6% | 95.8% | 4.2% | 0.0% | 0.0% | 5 |
| Joshua Williams | 20.0% | 100% | 0.0% | 0.0% | 100% | 1 |
LAS VEGAS RAIDERS
Team Ranks
| Defensive snaps (Weekly rank) | Zone coverage rate (NFL rank) | Man coverage rate (NFL rank) | +EPA allowed % (NFL rank) |
| 67 (14th) | 62.6% (T-26th) | 30.9% (T-5th) | 47.7% (30th) |
- Dime personnel rate: 17.0% (T-10th)
- Blitz rate: 24.4% (17th)
EDGE
| Player | Total defensive snap share | 1st/2nd down snap share | 3rd/4th down snap share | Pressure rate | Win rate | Pass-rush grade |
| Maxx Crosby | 97.0% | 96.6% | 100% | 14.7% | 23.5% | 68.4 |
| Clelin Ferrell | 97.0% | 96.6% | 100% | 7.7% | 15.4% | 63.5 |
| Malcolm Koonce | 13.4% | 13.8% | 11.1% | 0.0% | 14.3% | 61.1 |
| Isaac Rochell | 3.0% | 3.4% | 0.0% | 0.0% | 0.0% | 56.6 |
DEFENSIVE INTERIOR
| Player | Total defensive snap share | 1st/2nd down snap share | 3rd/4th down snap share | Pressure rate | Win rate | Pass-rush grade |
| Bilal Nichols | 83.6% | 82.8% | 88.9% | 3.5% | 6.9% | 56.9 |
| Andrew Billings | 64.2% | 70.7% | 22.2% | 0.0% | 5.6% | 59.3 |
| Kyle Peko | 40.3% | 44.8% | 11.1% | 0.0% | 0.0% | 60.6 |
| Jerry Tillery | 31.3% | 31.0% | 33.3% | 0.0% | 14.3% | 60.7 |
| Neil Farrell Jr. | 13.8% | 14.3% | 11.1% | 0.0% | 0.0% | 54.8 |
LINEBACKER
| Player | Total defensive snap share | 1st/2nd down snap share | 3rd/4th down snap share | Blitz rate | Tackle efficiency |
| Luke Masterson | 100% | 100% | 100% | 6.0% | 11.3% |
| Harvey Langi | 67.2% | 72.4% | 33.3% | 11.1% | 22.0% |
| Darien Butler | 3.0% | 3.4% | 0.0% | 0.0% | 0.0% |
| Curtis Bolton | 1.5% | 1.7% | 0.0% | 0.0% | 0.0% |
- WAIVER-WIRE: Harvey Langi stepped in as the Raiders' secondary linebacker due to Darien Butler suffering a concussion after just two defensive snaps. Langi would only be viable in deeper leagues as a part-time linebacker.
SAFETY
| Player | Total defensive snap share | Box snap % | Deep safety % | Slot corner % | Defensive line % |
| Duron Harmon | 100% | 38.8% | 50.7% | 6.0% | 1.5% |
| Trevon Moehrig | 100% | 38.8% | 29.9% | 26.9% | 3.0% |
| Roderic Teamer | 41.8% | 46.4% | 0.0% | 28.6% | 14.3% |
| Isaiah Pola-Mao | 6.0% | 25.0% | 50.0% | 0.0% | 25.0% |
CORNERBACK
| Player | Total defensive snap share | Wide corner % | Slot corner % | Box snap % | Forced incompletion % | Targets faced |
| Amik Robertson | 98.5% | 93.9% | 3.0% | 3.0% | 0.0% | 3 |
| Nate Hobbs | 98.5% | 92.4% | 0.0% | 4.5% | 16.7% | 6 |
| Tyler Hall | 38.8% | 0.0% | 73.1% | 23.1% | 100% | 2 |
| Sidney Jones | 1.5% | 100% | 0.0% | 0.0% | 0.0% | 0 |
LOS ANGELES CHARGERS
Team Ranks
| Defensive snaps (Weekly rank) | Zone coverage rate (NFL rank) | Man coverage rate (NFL rank) | +EPA allowed % (NFL rank) |
| 49 (30th) | 65.3% (T-23rd) | 25.9% (14th) | 44.4% (17th) |
- Dime personnel rate: 8.5% (18th)
- Blitz rate: 33.6% (9th)
EDGE
| Player | Total defensive snap share | 1st/2nd down snap share | 3rd/4th down snap share | Pressure rate | Win rate | Pass-rush grade |
| Khalil Mack | 71.4% | 68.4% | 81.8% | 13.3% | 13.3% | 60.3 |
| Kyle Van Noy | 53.1% | 50.0% | 63.6% | 16.7% | 16.7% | 91.9 |
| Joey Bosa | 49.0% | 52.6% | 36.4% | 25.0% | 33.3% | 74.5 |
| Chris Rumph II | 24.5% | 23.7% | 27.3% | 0.0% | 0.0% | 55.1 |
- WAIVER-WIRE: Joey Bosa returned from injured reserve this week and played 24 defensive snaps. Bosa is among the elite at his position and would likely get a bit more playing time next week when fantasy managers can trust him in lineups. Bosa still forced three pressures on his limited playing time.
DEFENSIVE INTERIOR
| Player | Total defensive snap share | 1st/2nd down snap share | 3rd/4th down snap share | Pressure rate | Win rate | Pass-rush grade |
| Sebastian Joseph-Day | 71.4% | 71.1% | 72.7% | 5.6% | 5.6% | 57.0 |
| Morgan Fox | 57.1% | 47.4% | 90.9% | 28.6% | 21.4% | 63.2 |
| Breiden Fehoko | 51.0% | 63.2% | 9.1% | 0.0% | 0.0% | 53.9 |
| Christopher Hinton | 36.7% | 44.7% | 9.1% | 0.0% | 0.0% | 54.2 |
| David Moa | 28.6% | 38.5% | 0.0% | 0.0% | 0.0% | 56.2 |
LINEBACKER
| Player | Total defensive snap share | 1st/2nd down snap share | 3rd/4th down snap share | Blitz rate | Tackle efficiency |
| Drue Tranquill | 87.8% | 86.8% | 90.9% | 7.0% | 23.3% |
| Kenneth Murray | 67.3% | 63.2% | 81.8% | 12.1% | 9.1% |
| Troy Reeder | 12.2% | 13.2% | 9.1% | 0.0% | 0.0% |
| Amen Ogbongbemiga | 8.2% | 7.9% | 9.1% | 0.0% | 0.0% |
| Nick Niemann | 4.1% | 5.3% | 0.0% | 0.0% | 0.0% |
SAFETY
| Player | Total defensive snap share | Box snap % | Deep safety % | Slot corner % | Defensive line % |
| Alohi Gilman | 100% | 42.9% | 55.1% | 2.0% | 0.0% |
| Nasir Adderley | 87.8% | 30.2% | 39.5% | 30.2% | 0.0% |
| Raheem Layne | 14.3% | 14.3% | 42.9% | 42.9% | 0.0% |
| JT Woods | 4.1% | 0.0% | 0.0% | 0.0% | 0.0% |
CORNERBACK
| Player | Total defensive snap share | Wide corner % | Slot corner % | Box snap % | Forced incompletion % | Targets faced |
| Michael Davis | 95.9% | 74.5% | 4.3% | 21.3% | 33.3% | 3 |
| Asante Samuel Jr. | 73.5% | 100% | 0.0% | 0.0% | 0.0% | 1 |
| Bryce Callahan | 65.3% | 6.3% | 78.1% | 15.6% | 0.0% | 2 |
| Ja'Sir Taylor | 34.7% | 64.7% | 17.6% | 17.6% | 100% | 1 |
LOS ANGELES RAMS
Team Ranks
| Defensive snaps (Weekly rank) | Zone coverage rate (NFL rank) | Man coverage rate (NFL rank) | +EPA allowed % (NFL rank) |
| 64 (17th) | 81.9% (1st) | 10.1% (32nd) | 46.0% (27th) |
- Dime personnel rate: 13.4% (15th)
- Blitz rate: 30.9% (11th)
EDGE
| Player | Total defensive snap share | 1st/2nd down snap share | 3rd/4th down snap share | Pressure rate | Win rate | Pass-rush grade |
| Michael Hoecht | 85.9% | 84.0% | 92.9% | 7.7% | 7.7% | 58.3 |
| Leonard Floyd | 84.4% | 86.0% | 78.6% | 15.4% | 7.7% | 59.6 |
| Keir Thomas | 18.8% | 22.0% | 7.1% | 0.0% | 0.0% | 55.9 |
DEFENSIVE INTERIOR
| Player | Total defensive snap share | 1st/2nd down snap share | 3rd/4th down snap share | Pressure rate | Win rate | Pass-rush grade |
| Jonah Williams | 50.0% | 58.0% | 21.4% | 9.1% | 9.1% | 59.0 |
| Marquise Copeland | 48.4% | 60.0% | 7.1% | 0.0% | 0.0% | 54.3 |
| Larrell Murchison | 37.5% | 38.0% | 35.7% | 0.0% | 0.0% | 52.4 |
| Bobby Brown III | 35.9% | 36.0% | 35.7% | 0.0% | 0.0% | 54.2 |
| Greg Gaines | 25.5% | 14.3% | 61.5% | 0.0% | 0.0% | 52.2 |
LINEBACKER
| Player | Total defensive snap share | 1st/2nd down snap share | 3rd/4th down snap share | Blitz rate | Tackle efficiency |
| Bobby Wagner | 100% | 100% | 100% | 3.1% | 11.3% |
| Ernest Jones | 65.6% | 70.0% | 50.0% | 2.4% | 22.5% |
SAFETY
| Player | Total defensive snap share | Box snap % | Deep safety % | Slot corner % | Defensive line % |
| Taylor Rapp | 100% | 29.7% | 59.4% | 6.3% | 4.7% |
| Nick Scott | 87.5% | 19.6% | 66.1% | 14.3% | 0.0% |
| Russ Yeast | 23.4% | 20.0% | 80.0% | 0.0% | 0.0% |
CORNERBACK
| Player | Total defensive snap share | Wide corner % | Slot corner % | Box snap % | Forced incompletion % | Targets faced |
| Troy Hill | 100% | 95.3% | 0.0% | 4.7% | 0.0% | 5 |
| Jalen Ramsey | 100% | 48.4% | 29.7% | 14.1% | 0.0% | 4 |
| Cobie Durant | 75.0% | 56.3% | 37.5% | 6.3% | 0.0% | 7 |
MIAMI DOLPHINS
Team Ranks
| Defensive snaps (Weekly rank) | Zone coverage rate (NFL rank) | Man coverage rate (NFL rank) | +EPA allowed % (NFL rank) |
| 60 (23rd) | 51.5% (32nd) | 40.6% (2nd) | 44.5% (18th) |
- Dime personnel rate: 14.9% (13th)
- Blitz rate: 39.2% (3rd)
EDGE
| Player | Total defensive snap share | 1st/2nd down snap share | 3rd/4th down snap share | Pressure rate | Win rate | Pass-rush grade |
| Jaelan Phillips | 88.3% | 90.7% | 82.4% | 3.6% | 14.3% | 63.9 |
| Andrew Van Ginkel | 63.3% | 62.8% | 64.7% | 5.3% | 5.3% | 58.3 |
| Melvin Ingram III | 46.7% | 37.2% | 70.6% | 0.0% | 0.0% | 48.4 |
DEFENSIVE INTERIOR
| Player | Total defensive snap share | 1st/2nd down snap share | 3rd/4th down snap share | Pressure rate | Win rate | Pass-rush grade |
| Christian Wilkins | 90.0% | 95.3% | 76.5% | 6.7% | 6.7% | 60.5 |
| Zach Sieler | 90.0% | 93.0% | 82.4% | 6.5% | 9.7% | 57.5 |
| Raekwon Davis | 68.3% | 81.4% | 35.3% | 13.0% | 13.0% | 68.5 |
| John Jenkins | 28.3% | 27.9% | 29.4% | 0.0% | 25.0% | 83.1 |
| Josiah Bronson | 8.3% | 9.3% | 5.9% | 0.0% | 0.0% | 58.0 |
LINEBACKER
| Player | Total defensive snap share | 1st/2nd down snap share | 3rd/4th down snap share | Blitz rate | Tackle efficiency |
| Jerome Baker | 81.7% | 76.7% | 94.1% | 8.2% | 12.8% |
| Elandon Roberts | 68.3% | 81.4% | 35.3% | 4.9% | 20.0% |
| Duke Riley | 8.3% | 2.3% | 23.5% | 0.0% | 0.0% |
SAFETY
| Player | Total defensive snap share | Box snap % | Deep safety % | Slot corner % | Defensive line % |
| Jevon Holland | 95.0% | 22.8% | 70.2% | 5.3% | 1.8% |
| Eric Rowe | 86.7% | 21.2% | 15.4% | 55.8% | 3.8% |
| Verone McKinley III | 16.7% | 40.0% | 60.0% | 0.0% | 0.0% |
| Elijah Campbell | 11.7% | 42.9% | 0.0% | 28.6% | 28.6% |
| Clayton Fejedelem | 1.7% | 0.0% | 0.0% | 0.0% | 0.0% |
CORNERBACK
| Player | Total defensive snap share | Wide corner % | Slot corner % | Box snap % | Forced incompletion % | Targets faced |
| Keion Crossen | 98.3% | 86.4% | 3.4% | 6.8% | 25.0% | 4 |
| Kader Kohou | 98.3% | 44.1% | 45.8% | 10.2% | 0.0% | 7 |
| Noah Igbinoghene | 50.0% | 93.3% | 3.3% | 3.3% | 33.3% | 3 |
MINNESOTA VIKINGS
Team Ranks
| Defensive snaps (Weekly rank) | Zone coverage rate (NFL rank) | Man coverage rate (NFL rank) | +EPA allowed % (NFL rank) |
| 63 (T-18th) | 76.9% (4th) | 17.2% (29th) | 45.0% (23rd) |
- Dime personnel rate: 0.7% (26th)
- Blitz rate: 22.5% (20th)
EDGE
| Player | Total defensive snap share | 1st/2nd down snap share | 3rd/4th down snap share | Pressure rate | Win rate | Pass-rush grade |
| D.J. Wonnum | 60.3% | 55.1% | 78.6% | 0.0% | 0.0% | 56.1 |
| Danielle Hunter | 57.1% | 55.1% | 64.3% | 18.8% | 18.8% | 59.9 |
| Za'Darius Smith | 52.4% | 51.0% | 57.1% | 0.0% | 7.1% | 55.3 |
| Patrick Jones II | 42.9% | 44.9% | 35.7% | 0.0% | 0.0% | 52.3 |
DEFENSIVE INTERIOR
| Player | Total defensive snap share | 1st/2nd down snap share | 3rd/4th down snap share | Pressure rate | Win rate | Pass-rush grade |
| Khyiris Tonga | 60.3% | 67.3% | 35.7% | 9.1% | 9.1% | 55.3 |
| Dalvin Tomlinson | 54.0% | 57.1% | 42.9% | 15.4% | 15.4% | 67.9 |
| Harrison Phillips | 49.2% | 53.1% | 35.7% | 0.0% | 0.0% | 62.2 |
| T.J. Smith | 34.9% | 38.8% | 21.4% | 0.0% | 0.0% | 54.9 |
| Esezi Otomewo | 42.1% | 40.7% | 45.5% | 0.0% | 0.0% | 53.6 |
LINEBACKER
| Player | Total defensive snap share | 1st/2nd down snap share | 3rd/4th down snap share | Blitz rate | Tackle efficiency |
| Eric Kendricks | 88.9% | 87.8% | 7.1% | 3.6% | 9.1% |
| Jordan Hicks | 60.3% | 63.3% | 50.0% | 5.3% | 11.1% |
| Brian Asamoah | 41.3% | 40.8% | 42.9% | 11.5% | 16.0% |
SAFETY
| Player | Total defensive snap share | Box snap % | Deep safety % | Slot corner % | Defensive line % |
| Camryn Bynum | 100% | 22.2% | 60.3% | 17.5% | 0.0% |
| Harrison Smith | 74.6% | 38.3% | 53.2% | 6.4% | 0.0% |
| Josh Metellus | 22.2% | 42.9% | 28.6% | 7.1% | 7.1% |
| Theo Jackson | 11.1% | 28.6% | 71.4% | 0.0% | 0.0% |
CORNERBACK
| Player | Total defensive snap share | Wide corner % | Slot corner % | Box snap % | Forced incompletion % | Targets faced |
| Duke Shelley | 96.8% | 93.4% | 0.0% | 4.9% | 25.0% | 4 |
| Patrick Peterson | 85.7% | 81.5% | 1.9% | 14.8% | 0.0% | 2 |
| Chandon Sullivan | 66.7% | 2.4% | 81.0% | 14.3% | 0.0% | 5 |
| Cameron Dantzler | 11.1% | 71.4% | 0.0% | 28.6% | 33.3% | 3 |
NEW ENGLAND PATRIOTS
Team Ranks
| Defensive snaps (Weekly rank) | Zone coverage rate (NFL rank) | Man coverage rate (NFL rank) | +EPA allowed % (NFL rank) |
| 71 (T-5th) | 65.5% (22nd) | 29.1% (7th) | 41.3% (4th) |
- Dime personnel rate: 27.9% (1st)
- Blitz rate: 23.8% (18th)
EDGE
| Player | Total defensive snap share | 1st/2nd down snap share | 3rd/4th down snap share | Pressure rate | Win rate | Pass-rush grade |
| Matthew Judon | 78.9% | 71.7% | 100% | 9.4% | 18.8% | 65.9 |
| Deatrich Wise Jr. | 71.8% | 79.2% | 50.0% | 10.7% | 10.7% | 62.1 |
| Josh Uche | 47.9% | 32.1% | 94.4% | 20.7% | 24.1% | 65.0 |
| Anfernee Jennings | 25.4% | 34.0% | 0.0% | 12.5% | 37.5% | 67.3 |
DEFENSIVE INTERIOR
| Player | Total defensive snap share | 1st/2nd down snap share | 3rd/4th down snap share | Pressure rate | Win rate | Pass-rush grade |
| Davon Godchaux | 47.9% | 62.3% | 5.6% | 13.3% | 13.3% | 66.8 |
| Christian Barmore | 46.5% | 39.6% | 66.7% | 25.9% | 33.3% | 90.0 |
| Lawrence Guy | 45.1% | 58.5% | 5.6% | 7.7% | 15.4% | 58.3 |
| Daniel Ekuale | 25.4% | 7.5% | 77.8% | 5.9% | 11.8% | 57.8 |
| Carl Davis | 14.3% | 21.1% | 0.0% | 33.3% | 33.3% | 74.2 |
- POINT OF INTEREST: Christian Barmore posted the best single-game grade of his career (90.8) and the best pass-rush grade of his career (90.0) so far. Barmore was showing a ton of potential as a rookie last season and dealt with an injury that kept him out several weeks this year, making it more difficult to analyze his season. Still, he continues to be a hot commodity in DT-required dynasty leagues.
LINEBACKER
| Player | Total defensive snap share | 1st/2nd down snap share | 3rd/4th down snap share | Blitz rate | Tackle efficiency |
| Ja’Whaun Bentley | 77.5% | 81.1% | 66.7% | 1.8% | 14.8% |
| Jahlani Tavai | 47.9% | 60.4% | 11.1% | 2.9% | 14.7% |
| Raekwon McMillan | 35.2% | 35.8% | 33.3% | 0.0% | 12.5% |
SAFETY
| Player | Total defensive snap share | Box snap % | Deep safety % | Slot corner % | Defensive line % |
| Devin McCourty | 100% | 15.5% | 73.2% | 9.9% | 0.0% |
| Kyle Dugger | 91.5% | 63.1% | 15.4% | 13.8% | 1.5% |
| Adrian Phillips | 63.4% | 28.9% | 35.6% | 20.0% | 8.9% |
| Jabrill Peppers | 63.4% | 24.4% | 2.2% | 40.0% | 11.1% |
CORNERBACK
| Player | Total defensive snap share | Wide corner % | Slot corner % | Box snap % | Forced incompletion % | Targets faced |
| Myles Bryant | 100% | 78.9% | 14.1% | 2.8% | 20.0% | 5 |
| Jonathan Jones | 85.9% | 86.9% | 9.8% | 3.3% | 20.0% | 5 |
| Tae Hayes | 33.8% | 83.3% | 16.7% | 0.0% | 0.0% | 3 |
| Quandre Mosely | 1.4% | 100% | 0.0% | 0.0% | 0.0% | 0 |
NEW ORLEANS SAINTS
Team Ranks
| Defensive snaps (Weekly rank) | Zone coverage rate (NFL rank) | Man coverage rate (NFL rank) | +EPA allowed % (NFL rank) |
| 55 (27th) | 62.3% (28th) | 30.9% (T-5th) | 42.0% (8th) |
- Dime personnel rate: 18.1% (6th)
- Blitz rate: 17.7% (29th)
EDGE
| Player | Total defensive snap share | 1st/2nd down snap share | 3rd/4th down snap share | Pressure rate | Win rate | Pass-rush grade |
| Cameron Jordan | 81.8% | 75.0% | 100% | 14.7% | 14.7% | 68.7 |
| Carl Granderson | 72.7% | 70.0% | 80.0% | 13.8% | 17.2% | 62.8 |
| Marcus Davenport | 27.3% | 30.0% | 20.0% | 0.0% | 0.0% | 51.4 |
| Payton Turner | 18.2% | 25.0% | 0.0% | 0.0% | 0.0% | 54.3 |
DEFENSIVE INTERIOR
| Player | Total defensive snap share | 1st/2nd down snap share | 3rd/4th down snap share | Pressure rate | Win rate | Pass-rush grade |
| David Onyemata | 63.6% | 60.0% | 73.3% | 4.3% | 4.3% | 54.1 |
| Shy Tuttle | 47.3% | 55.0% | 26.7% | 0.0% | 0.0% | 52.4 |
| Kentavius Street | 38.2% | 40.0% | 33.3% | 0.0% | 0.0% | 52.1 |
| Malcolm Roach | 21.8% | 30.0% | 0.0% | 0.0% | 0.0% | 54.9 |
LINEBACKER
| Player | Total defensive snap share | 1st/2nd down snap share | 3rd/4th down snap share | Blitz rate | Tackle efficiency |
| Demario Davis | 100% | 100% | 100% | 3.6% | 17.0% |
| Kaden Elliss | 67.3% | 60.0% | 86.7% | 43.2% | 5.7% |
| Pete Werner | 43.6% | 52.5% | 20.0% | 4.2% | 4.2% |
SAFETY
| Player | Total defensive snap share | Box snap % | Deep safety % | Slot corner % | Defensive line % |
| Tyrann Mathieu | 100% | 34.5% | 38.2% | 27.3% | 0.0% |
| Daniel Sorensen | 100% | 12.7% | 74.5% | 5.5% | 5.5% |
| P.J. Williams | 30.9% | 5.9% | 94.1% | 0.0% | 0.0% |
| J.T. Gray | 3.6% | 0.0% | 100% | 0.0% | 0.0% |
CORNERBACK
| Player | Total defensive snap share | Wide corner % | Slot corner % | Box snap % | Forced incompletion % | Targets faced |
| Marshon Lattimore | 100% | 89.1% | 3.6% | 5.5% | 12.5% | 8 |
| Paulson Adebo | 100% | 98.2% | 0.0% | 1.8% | 14.3% | 7 |
| Bradley Roby | 83.6% | 0.0% | 91.3% | 4.3% | 0.0% | 6 |
NEW YORK GIANTS
Team Ranks
| Defensive snaps (Weekly rank) | Zone coverage rate (NFL rank) | Man coverage rate (NFL rank) | +EPA allowed % (NFL rank) |
| 58 (T-24th) | 51.8% (31st) | 42.9% (1st) | 44.6% (T-19th) |
- Dime personnel rate: 13.3% (16th)
- Blitz rate: 46.9% (1st)
EDGE
| Player | Total defensive snap share | 1st/2nd down snap share | 3rd/4th down snap share | Pressure rate | Win rate | Pass-rush grade |
| Kayvon Thibodeaux | 72.4% | 65.1% | 93.3% | 4.8% | 4.8% | 60.9 |
| Jihad Ward | 56.9% | 62.8% | 40.0% | 0.0% | 6.7% | 54.9 |
| Oshane Ximines | 53.4% | 48.8% | 66.7% | 0.0% | 6.3% | 53.9 |
| Tomon Fox | 24.1% | 30.2% | 6.7% | 0.0% | 0.0% | 56.1 |
| Azeez Ojulari | 12.1% | 4.7% | 33.3% | 0.0% | 0.0% | 52.1 |
DEFENSIVE INTERIOR
| Player | Total defensive snap share | 1st/2nd down snap share | 3rd/4th down snap share | Pressure rate | Win rate | Pass-rush grade |
| Dexter Lawrence | 67.2% | 67.4% | 66.7% | 16.7% | 27.8% | 87.7 |
| Leonard Williams | 53.4% | 48.8% | 66.7% | 6.3% | 12.5% | 61.7 |
| Ryder Anderson | 34.5% | 39.5% | 20.0% | 0.0% | 0.0% | 54.3 |
| Justin Ellis | 25.9% | 32.6% | 6.7% | 0.0% | 0.0% | 55.0 |
| Henry Mondeaux | 14.3% | 21.4% | 0.0% | 0.0% | 0.0% | 57.3 |
LINEBACKER
| Player | Total defensive snap share | 1st/2nd down snap share | 3rd/4th down snap share | Blitz rate | Tackle efficiency |
| Jaylon Smith | 62.1% | 79.1% | 13.3% | 8.3% | 25.7% |
| Micah McFadden | 41.4% | 55.8% | 0.0% | 4.2% | 17.4% |
| Carter Coughlin | 5.2% | 7.0% | 0.0% | 0.0% | 0.0% |
SAFETY
| Player | Total defensive snap share | Box snap % | Deep safety % | Slot corner % | Defensive line % |
| Julian Love | 94.8% | 16.4% | 74.5% | 9.1% | 0.0% |
| Xavier McKinney | 82.8% | 12.5% | 79.2% | 2.1% | 4.2% |
| Landon Collins | 55.2% | 78.1% | 0.0% | 18.8% | 3.1% |
| Tony Jefferson | 32.8% | 94.7% | 0.0% | 5.3% | 0.0% |
| Jason Pinnock | 17.2% | 0.0% | 90.0% | 10.0% | 0.0% |
- WAIVER-WIRE: Xavier McKinney returned after several weeks on injured reserve and finished second on the team in total tackles (seven) while adding a pass breakup.
CORNERBACK
| Player | Total defensive snap share | Wide corner % | Slot corner % | Box snap % | Forced incompletion % | Targets faced |
| Fabian Moreau | 94.8% | 92.7% | 7.3% | 0.0% | 0.0% | 4 |
| Darnay Holmes | 72.4% | 7.1% | 90.5% | 0.0% | 0.0% | 4 |
| Cordale Flott | 60.3% | 82.9% | 0.0% | 17.1% | 0.0% | 0 |
| Nick McCloud | 55.2% | 62.5% | 18.8% | 15.6% | 20.0% | 5 |
| Zyon Gilbert | 15.5% | 33.3% | 55.6% | 11.1% | 0.0% | 1 |
NEW YORK JETS
Team Ranks
| Defensive snaps (Weekly rank) | Zone coverage rate (NFL rank) | Man coverage rate (NFL rank) | +EPA allowed % (NFL rank) |
| 72 (4th) | 69.9% (14th) | 26.3% (13th) | 41.0% (3rd) |
- Dime personnel rate: 5.4% (19th)
- Blitz rate: 16.9% (31st)
EDGE
| Player | Total defensive snap share | 1st/2nd down snap share | 3rd/4th down snap share | Pressure rate | Win rate | Pass-rush grade |
| Carl Lawson | 52.8% | 50.0% | 61.1% | 25.0% | 30.0% | 86.1 |
| Jermaine Johnson II | 50.0% | 50.0% | 50.0% | 16.7% | 27.8% | 71.4 |
| John Franklin-Myers | 48.6% | 50.0% | 44.4% | 25.0% | 25.0% | 71.3 |
| Micheal Clemons | 47.2% | 50.0% | 38.9% | 6.7% | 6.7% | 58.0 |
| Bryce Huff | 9.7% | 0.0% | 38.9% | 25.0% | 50.0% | 83.4 |
DEFENSIVE INTERIOR
| Player | Total defensive snap share | 1st/2nd down snap share | 3rd/4th down snap share | Pressure rate | Win rate | Pass-rush grade |
| Quinnen Williams | 68.1% | 64.8% | 77.8% | 16.0% | 24.0% | 86.4 |
| Sheldon Rankins | 44.4% | 44.4% | 44.4% | 0.0% | 0.0% | 51.5 |
| Nathan Shepherd | 41.7% | 46.3% | 27.8% | 13.3% | 13.3% | 68.0 |
| Solomon Thomas | 37.5% | 44.4% | 16.7% | 25.0% | 33.3% | 69.4 |
LINEBACKER
| Player | Total defensive snap share | 1st/2nd down snap share | 3rd/4th down snap share | Blitz rate | Tackle efficiency |
| Quincy Williams | 94.4% | 96.3% | 88.9% | 1.5% | 13.4% |
| C.J. Mosley | 91.7% | 94.4% | 83.3% | 1.5% | 15.4% |
| Kwon Alexander | 34.7% | 40.7% | 16.7% | 4.0% | 12.0% |
| Jamien Sherwood | 8.3% | 5.6% | 16.7% | 0.0% | 66.7% |
| Hamsah Nasirildeen | 5.6% | 7.4% | 0.0% | 0.0% | 25.0% |
SAFETY
| Player | Total defensive snap share | Box snap % | Deep safety % | Slot corner % | Defensive line % |
| Jordan Whitehead | 100% | 37.5% | 44.4% | 13.9% | 4.2% |
| Tony Adams | 83.3% | 10.0% | 63.3% | 25.0% | 1.7% |
| Lamarcus Joyner | 16.7% | 25.0% | 41.7% | 33.3% | 0.0% |
| Ashtyn Davis | 1.4% | 0.0% | 100% | 0.0% | 0.0% |
- INJURY: Lamarcus Joyner suffered a hip injury in the first quarter and did not return.
- WAIVER-WIRE: Tony Adams filled in for the injured Joyner and had a decently productive game with six tackles. Adams could be a deep league option if Joyner misses next week.
CORNERBACK
| Player | Total defensive snap share | Wide corner % | Slot corner % | Box snap % | Forced incompletion % | Targets faced |
| D.J. Reed Jr. | 100% | 93.1% | 0.0% | 5.6% | 0.0% | 1 |
| Sauce Gardner | 100% | 79.2% | 0.0% | 19.4% | 37.5% | 8 |
| Michael Carter II | 63.9% | 0.0% | 76.1% | 19.6% | 0.0% | 1 |
PHILADELPHIA EAGLES
Team Ranks
| Defensive snaps (Weekly rank) | Zone coverage rate (NFL rank) | Man coverage rate (NFL rank) | +EPA allowed % (NFL rank) |
| 68 (T-28th) | 71.1% (12th) | 23.6% (18th) | 42.8% (10th) |
- Dime personnel rate: 4.2% (21st)
- Blitz rate: 24.4% (T-16th)
EDGE
| Player | Total defensive snap share | 1st/2nd down snap share | 3rd/4th down snap share | Pressure rate | Win rate | Pass-rush grade |
| Haason Reddick | 94.1% | 92.2% | 100% | 15.4% | 19.2% | 68.4 |
| Brandon Graham | 73.5% | 72.5% | 76.5% | 16.7% | 16.7% | 73.3 |
| Patrick Johnson | 26.5% | 25.5% | 29.4% | 0.0% | 0.0% | 53.7 |
| Josh Sweat | 10.3% | 9.8% | 11.8% | 0.0% | 0.0% | 54.2 |
- INJURY: Josh Sweat was carted off due to a neck injury in the first quarter and is likely to miss some time.
- WAIVER-WIRE: Brandon Graham has been very productive in a limited role and will now get more playing time while Sweat is out. He should be a solid edge option where needed.
DEFENSIVE INTERIOR
| Player | Total defensive snap share | 1st/2nd down snap share | 3rd/4th down snap share | Pressure rate | Win rate | Pass-rush grade |
| Fletcher Cox | 64.7% | 60.8% | 76.5% | 14.3% | 14.3% | 57.5 |
| Javon Hargrave | 64.7% | 58.8% | 82.4% | 15.8% | 21.1% | 70.4 |
| Milton Williams | 38.2% | 43.1% | 23.5% | 8.3% | 8.3% | 58.9 |
| Ndamukong Suh | 32.4% | 37.3% | 17.6% | 10.0% | 10.0% | 59.1 |
| Linval Joseph | 29.4% | 33.3% | 17.6% | 0.0% | 0.0% | 56.6 |
| Jordan Davis | 28.1% | 29.8% | 23.5% | 0.0% | 0.0% | 57.3 |
LINEBACKER
| Player | Total defensive snap share | 1st/2nd down snap share | 3rd/4th down snap share | Blitz rate | Tackle efficiency |
| Kyzir White | 95.6% | 100% | 82.4% | 1.5% | 11.1% |
| T.J. Edwards | 94.1% | 100% | 76.5% | 1.6% | 19.4% |
| Nakobe Dean | 2.9% | 2.0% | 5.9% | 0.0% | 0.0% |
SAFETY
| Player | Total defensive snap share | Box snap % | Deep safety % | Slot corner % | Defensive line % |
| Marcus Epps | 100% | 19.1% | 61.8% | 17.6% | 1.5% |
| Reed Blankenship | 97.1% | 24.2% | 69.7% | 6.1% | 0.0% |
| K'Von Wallace | 8.8% | 33.3% | 0.0% | 16.7% | 50.0% |
CORNERBACK
| Player | Total defensive snap share | Wide corner % | Slot corner % | Box snap % | Forced incompletion % | Targets faced |
| Darius Slay | 97.1% | 92.4% | 0.0% | 7.6% | 0.0% | 2 |
| James Bradberry | 97.1% | 71.2% | 0.0% | 27.3% | 0.0% | 1 |
| Josiah Scott | 47.1% | 0.0% | 90.6% | 9.4% | 0.0% | 6 |
PITTSBURGH STEELERS
Team Ranks
| Defensive snaps (Weekly rank) | Zone coverage rate (NFL rank) | Man coverage rate (NFL rank) | +EPA allowed % (NFL rank) |
| 52 (T-28th) | 62.6% (T-26th) | 32.4% (4th) | 43.0% (11th) |
- Dime personnel rate: 17.4% (9th)
- Blitz rate: 33.9% (8th)
EDGE
| Player | Total defensive snap share | 1st/2nd down snap share | 3rd/4th down snap share | Pressure rate | Win rate | Pass-rush grade |
| Alex Highsmith | 100% | 100% | 100% | 14.3% | 9.5% | 58.1 |
| T.J. Watt | 94.2% | 92.5% | 100% | 18.2% | 22.7% | 66.4 |
| DeMarvin Leal | 51.9% | 60.0% | 25.0% | 0.0% | 0.0% | 52.9 |
| Isaiahh Loudermilk | 7.7% | 10.0% | 0.0% | 0.0% | 0.0% | 59.1 |
| Jamir Jones | 5.8% | 7.5% | 0.0% | 0.0% | 0.0% | 58.7 |
DEFENSIVE INTERIOR
| Player | Total defensive snap share | 1st/2nd down snap share | 3rd/4th down snap share | Pressure rate | Win rate | Pass-rush grade |
| Cameron Heyward | 88.5% | 85.0% | 100% | 9.5% | 9.5% | 59.0 |
| Larry Ogunjobi | 80.8% | 82.5% | 75.0% | 11.1% | 11.1% | 58.7 |
| Montravius Adams | 55.8% | 62.5% | 33.3% | 0.0% | 9.1% | 60.1 |
| Tyson Alualu | 25.0% | 30.0% | 8.3% | 0.0% | 0.0% | 55.3 |
LINEBACKER
| Player | Total defensive snap share | 1st/2nd down snap share | 3rd/4th down snap share | Blitz rate | Tackle efficiency |
| Robert Spillane | 100% | 100% | 100% | 5.8% | 18.0% |
| Mark Robinson | 50.0% | 57.5% | 25.0% | 0.0% | 23.1% |
| Myles Jack | 11.5% | 12.5% | 8.3% | 0.0% | 0.0% |
| Devin Bush | 9.6% | 7.5% | 16.7% | 0.0% | 40.0% |
- INJURY: Myles Jack suffered a groin injury in the second quarter and did not return. Hopefully, IDP managers weren’t starting Jack this week, but Robert Spillane remains the only trustworthy Steelers linebacker for the season's final week.
SAFETY
| Player | Total defensive snap share | Box snap % | Deep safety % | Slot corner % | Defensive line % |
| Terrell Edmunds | 96.2% | 42.0% | 16.0% | 22.0% | 4.0% |
| Minkah Fitzpatrick | 94.2% | 4.1% | 85.7% | 10.2% | 0.0% |
| Damontae Kazee | 32.7% | 0.0% | 88.2% | 11.8% | 0.0% |
| Elijah Riley | 1.9% | 0.0% | 100% | 0.0% | 0.0% |
CORNERBACK
| Player | Total defensive snap share | Wide corner % | Slot corner % | Box snap % | Forced incompletion % | Targets faced |
| Cameron Sutton | 100% | 96.2% | 1.9% | 0.0% | 0.0% | 1 |
| Levi Wallace | 53.8% | 82.1% | 10.7% | 3.6% | 0.0% | 0 |
| Arthur Maulet | 36.5% | 5.3% | 89.5% | 5.3% | 0.0% | 4 |
| James Pierre | 1.9% | 100% | 0.0% | 0.0% | 0.0% | 0 |
SAN FRANCISCO 49ERS
Team Ranks
| Defensive snaps (Weekly rank) | Zone coverage rate (NFL rank) | Man coverage rate (NFL rank) | +EPA allowed % (NFL rank) |
| 69 (T-10th) | 76.5% (5th) | 17.8% (27th) | 40.4% (2nd) |
- Dime personnel rate: 0.3% (29th)
- Blitz rate: 22.2% (21st)
EDGE
| Player | Total defensive snap share | 1st/2nd down snap share | 3rd/4th down snap share | Pressure rate | Win rate | Pass-rush grade |
| Nick Bosa | 85.5% | 84.5% | 90.9% | 29.4% | 23.5% | 70.5 |
| Charles Omenihu | 40.6% | 32.8% | 81.8% | 11.8% | 5.9% | 59.6 |
| Samson Ebukam | 39.1% | 32.8% | 72.7% | 13.3% | 13.3% | 54.0 |
| Jordan Willis | 24.6% | 27.6% | 9.1% | 0.0% | 12.5% | 65.3 |
| Drake Jackson | 23.2% | 25.9% | 9.1% | 0.0% | 0.0% | 51.0 |
DEFENSIVE INTERIOR
| Player | Total defensive snap share | 1st/2nd down snap share | 3rd/4th down snap share | Pressure rate | Win rate | Pass-rush grade |
| Arik Armstead | 78.3% | 75.9% | 90.9% | 3.3% | 6.7% | 60.2 |
| T.Y. McGill | 53.6% | 56.9% | 36.4% | 21.1% | 21.1% | 65.2 |
| Kerry Hyder | 33.3% | 34.5% | 27.3% | 22.2% | 22.2% | 76.2 |
| Javon Kinlaw | 31.9% | 32.8% | 27.3% | 9.1% | 18.2% | 67.5 |
LINEBACKER
| Player | Total defensive snap share | 1st/2nd down snap share | 3rd/4th down snap share | Blitz rate | Tackle efficiency |
| Fred Warner | 100% | 100% | 100% | 1.4% | 16.7% |
| Azeez Al-Shaair | 65.2% | 72.4% | 27.3% | 4.4% | 16.7% |
| Dre Greenlaw | 62.3% | 60.3% | 72.7% | 0.0% | 23.8% |
| Oren Burks | 7.2% | 8.6% | 0.0% | 0.0% | 40.0% |
- INJURY: Dre Greenlaw suffered a back injury and did not return.
- WAIVER-WIRE: Azeez Al-Shaair is Greenlaw’s immediate replacement and should be added by any team needing linebacker help.
SAFETY
| Player | Total defensive snap share | Box snap % | Deep safety % | Slot corner % | Defensive line % |
| Tashaun Gipson Sr. | 100% | 14.5% | 68.1% | 10.1% | 7.2% |
| Talanoa Hufanga | 100% | 31.9% | 40.6% | 17.4% | 10.1% |
| Jimmie Ward | 63.8% | 25.0% | 0.0% | 75.0% | 0.0% |
CORNERBACK
| Player | Total defensive snap share | Wide corner % | Slot corner % | Box snap % | Forced incompletion % | Targets faced |
| Charvarius Ward | 95.7% | 97.0% | 0.0% | 1.5% | 0.0% | 6 |
| Deommodore Lenoir | 95.7% | 87.9% | 0.0% | 12.1% | 14.3% | 7 |
SEATTLE SEAHAWKS
Team Ranks
| Defensive snaps (Weekly rank) | Zone coverage rate (NFL rank) | Man coverage rate (NFL rank) | +EPA allowed % (NFL rank) |
| 68 (T-12th) | 78.6% (2nd) | 13.7% (31st) | 43.9% (16th) |
- Dime personnel rate: 17.0% (10th)
- Blitz rate: 17.3% (30th)
EDGE
| Player | Total defensive snap share | 1st/2nd down snap share | 3rd/4th down snap share | Pressure rate | Win rate | Pass-rush grade |
| Uchenna Nwosu | 85.3% | 86.8% | 80.0% | 8.8% | 11.8% | 63.2 |
| Darrell Taylor | 61.8% | 52.8% | 93.3% | 24.2% | 24.2% | 91.7 |
| Boye Mafe | 36.8% | 41.5% | 20.0% | 0.0% | 6.7% | 55.7 |
| Bruce Irvin | 16.2% | 18.9% | 6.7% | 28.6% | 42.9% | 70.0 |
DEFENSIVE INTERIOR
| Player | Total defensive snap share | 1st/2nd down snap share | 3rd/4th down snap share | Pressure rate | Win rate | Pass-rush grade |
| Shelby Harris | 50.0% | 45.3% | 66.7% | 3.9% | 3.9% | 53.9 |
| Poona Ford | 47.1% | 50.9% | 33.3% | 22.7% | 27.3% | 75.6 |
| Quinton Jefferson | 41.2% | 26.4% | 93.3% | 23.8% | 23.8% | 70.5 |
| Myles Adams | 29.4% | 37.7% | 0.0% | 21.4% | 28.6% | 83.5 |
| L.J. Collier | 29.4% | 35.8% | 6.7% | 0.0% | 6.3% | 55.6 |
| Al Woods | 31.0% | 39.1% | 0.0% | 10.0% | 10.0% | 63.7 |
LINEBACKER
| Player | Total defensive snap share | 1st/2nd down snap share | 3rd/4th down snap share | Blitz rate | Tackle efficiency |
| Cody Barton | 88.2% | 92.5% | 73.3% | 3.3% | 8.5% |
| Jordyn Brooks | 36.8% | 39.6% | 26.7% | 4.0% | 16.0% |
| Tanner Muse | 27.9% | 34.0% | 6.7% | 5.3% | 11.1% |
- INJURY: Jordyn Brooks tore his ACL in the second quarter and is out for the remainder of the season.
- WAIVER-WIRE: Tanner Muse is the next man up as the secondary linebacker while Cody Barton steps into more of an every-down role. Both should be viable options in Week 18.
SAFETY
| Player | Total defensive snap share | Box snap % | Deep safety % | Slot corner % | Defensive line % |
| Quandre Diggs | 100% | 2.9% | 92.6% | 2.9% | 0.0% |
| Johnathan Abram | 100% | 50.0% | 23.5% | 19.1% | 2.9% |
| Teez Tabor | 47.1% | 15.6% | 75.0% | 9.4% | 0.0% |
CORNERBACK
| Player | Total defensive snap share | Wide corner % | Slot corner % | Box snap % | Forced incompletion % | Targets faced |
| Michael Jackson | 100% | 97.1% | 0.0% | 2.9% | 11.1% | 8 |
| Tariq Woolen | 100% | 85.3% | 2.9% | 5.9% | 0.0% | 9 |
| Coby Bryant | 63.2% | 0.0% | 95.3% | 4.7% | 0.0% | 2 |
| Justin Coleman | 13.2% | 22.2% | 66.7% | 0.0% | 0.0% | 0 |
TAMPA BAY BUCCANEERS
Team Ranks
| Defensive snaps (Weekly rank) | Zone coverage rate (NFL rank) | Man coverage rate (NFL rank) | +EPA allowed % (NFL rank) |
| 66 (15th) | 72.6% (7th) | 22.0% (22nd) | 41.7% (5th) |
- Dime personnel rate: 2.3% (23rd)
- Blitz rate: 35.1% (6th)
EDGE
| Player | Total defensive snap share | 1st/2nd down snap share | 3rd/4th down snap share | Pressure rate | Win rate | Pass-rush grade |
| Anthony Nelson | 100% | 100% | 100% | 9.1% | 6.1% | 76.5 |
| Joe Tryon-Shoyinka | 98.5% | 98.1% | 100% | 12.5% | 9.4% | 55.4 |
DEFENSIVE INTERIOR
| Player | Total defensive snap share | 1st/2nd down snap share | 3rd/4th down snap share | Pressure rate | Win rate | Pass-rush grade |
| Akiem Hicks | 66.7% | 73.6% | 38.5% | 3.9% | 11.5% | 69.0 |
| Vita Vea | 57.6% | 50.9% | 84.6% | 14.8% | 14.8% | 68.1 |
| William Gholston | 36.4% | 43.4% | 7.7% | 16.7% | 16.7% | 67.2 |
| Logan Hall | 34.8% | 28.3% | 61.5% | 5.9% | 5.9% | 54.3 |
| Rakeem Nunez-Roches | 30.3% | 35.8% | 7.7% | 0.0% | 0.0% | 53.3 |
| Patrick O'Connor | 10.6% | 11.3% | 7.7% | 25.0% | 25.0% | 48.4 |
LINEBACKER
| Player | Total defensive snap share | 1st/2nd down snap share | 3rd/4th down snap share | Blitz rate | Tackle efficiency |
| Devin White | 100% | 100% | 100% | 10.6% | 8.2% |
| Lavonte David | 100% | 100% | 100% | 6.1% | 13.1% |
SAFETY
| Player | Total defensive snap share | Box snap % | Deep safety % | Slot corner % | Defensive line % |
| Antoine Winfield Jr. | 100% | 9.1% | 33.3% | 54.5% | 3.0% |
| Mike Edwards | 95.5% | 33.3% | 38.1% | 14.3% | 12.7% |
| Logan Ryan | 62.1% | 12.2% | 80.5% | 2.4% | 4.9% |
| Keanu Neal | 7.6% | 20.0% | 80.0% | 0.0% | 0.0% |
CORNERBACK
| Player | Total defensive snap share | Wide corner % | Slot corner % | Box snap % | Forced incompletion % | Targets faced |
| Sean Murphy-Bunting | 100% | 80.3% | 3.0% | 15.2% | 16.7% | 6 |
| Jamel Dean | 100% | 100% | 0.0% | 0.0% | 0.0% | 5 |
TENNESSEE TITANS
Team Ranks
| Defensive snaps (Weekly rank) | Zone coverage rate (NFL rank) | Man coverage rate (NFL rank) | +EPA allowed % (NFL rank) |
| 80 (1st) | 68.8% (15th) | 23.7% (17th) | 43.1% (12th) |
- Dime personnel rate: 24.2% (2nd)
- Blitz rate: 17.8% (28th)
EDGE
| Player | Total defensive snap share | 1st/2nd down snap share | 3rd/4th down snap share | Pressure rate | Win rate | Pass-rush grade |
| Rashad Weaver | 71.3% | 64.6% | 100% | 0.0% | 2.9% | 56.4 |
| DeMarcus Walker | 68.8% | 64.6% | 86.7% | 7.1% | 7.1% | 59.3 |
| Tarell Basham | 58.8% | 53.8% | 80.0% | 11.5% | 19.2% | 81.5 |
| Mario Edwards Jr. | 56.3% | 49.2% | 86.7% | 7.1% | 10.7% | 57.7 |
| Sam Okuayinonu | 16.3% | 20.0% | 0.0% | 0.0% | 10.0% | 60.0 |
DEFENSIVE INTERIOR
| Player | Total defensive snap share | 1st/2nd down snap share | 3rd/4th down snap share | Pressure rate | Win rate | Pass-rush grade |
| Teair Tart | 46.3% | 53.8% | 13.3% | 17.6% | 23.5% | 82.1 |
| Kevin Strong Jr. | 43.8% | 49.2% | 20.0% | 0.0% | 5.9% | 59.1 |
| Jayden Peevy | 33.8% | 38.5% | 0.0% | 0.0% | 0.0% | 55.0 |
| Naquan Jones | 21.1% | 26.2% | 6.7% | 0.0% | 0.0% | 57.0 |
LINEBACKER
| Player | Total defensive snap share | 1st/2nd down snap share | 3rd/4th down snap share | Blitz rate | Tackle efficiency |
| Jack Gibbens | 100% | 100% | 100% | 6.3% | 14.9% |
| Monty Rice | 81.3% | 90.8% | 40.0% | 3.1% | 21.3% |
| Joe Jones | 18.8% | 23.1% | 0.0% | 0.0% | 6.7% |
- WAIVER-WIRE: Jack Gibbens played an every-down role over Monty Rice this week and managed 10 tackles. For those playing in Week 18, he could be a decent option in deeper leagues.
SAFETY
| Player | Total defensive snap share | Box snap % | Deep safety % | Slot corner % | Defensive line % |
| Kevin Byard | 93.8% | 38.7% | 30.7% | 28.0% | 2.7% |
| Andrew Adams | 85.0% | 29.4% | 54.4% | 13.2% | 2.9% |
| Joshua Kalu | 57.5% | 17.4% | 0.0% | 80.4% | 2.2% |
| Lonnie Johnson Jr. | 33.8% | 14.8% | 74.1% | 11.1% | 0.0% |
CORNERBACK
| Player | Total defensive snap share | Wide corner % | Slot corner % | Box snap % | Forced incompletion % | Targets faced |
| Tre Avery | 98.8% | 87.3% | 1.3% | 10.1% | 25.0% | 8 |
| Roger McCreary | 98.8% | 60.8% | 20.3% | 16.5% | 14.3% | 7 |
| Greg Mabin | 20.0% | 100% | 0.0% | 0.0% | 0.0% | 2 |
| John Reid | 2.5% | 0.0% | 100% | 0.0% | 0.0% | 1 |
WASHINGTON COMMANDERS
Team Ranks
| Defensive snaps (Weekly rank) | Zone coverage rate (NFL rank) | Man coverage rate (NFL rank) | +EPA allowed % (NFL rank) |
| 56 (26th) | 68.3% (18th) | 22.2% (T-19th) | 40.3% (1st) |
- Dime personnel rate: 17.5% (8th)
- Blitz rate: 18.8% (27th)
EDGE
| Player | Total defensive snap share | 1st/2nd down snap share | 3rd/4th down snap share | Pressure rate | Win rate | Pass-rush grade |
| Montez Sweat | 67.9% | 65.1% | 76.9% | 25.0% | 18.8% | 70.3 |
| Chase Young | 66.1% | 62.8% | 76.9% | 17.6% | 23.5% | 51.3 |
| Efe Obada | 41.1% | 39.5% | 46.2% | 20.0% | 30.0% | 51.2 |
| Casey Toohill | 41.1% | 39.5% | 46.2% | 18.2% | 18.2% | 54.4 |
DEFENSIVE INTERIOR
| Player | Total defensive snap share | 1st/2nd down snap share | 3rd/4th down snap share | Pressure rate | Win rate | Pass-rush grade |
| Daron Payne | 91.1% | 88.4% | 100% | 18.2% | 18.2% | 70.3 |
| John Ridgeway | 55.4% | 62.8% | 30.8% | 0.0% | 0.0% | 53.7 |
| Jonathan Allen | 30.4% | 30.2% | 30.8% | 0.0% | 10.0% | 64.9 |
| David Bada | 25.0% | 27.9% | 15.4% | 0.0% | 0.0% | 57.5 |
- INJURY: Jonathan Allen suffered a knee injury early in the second quarter and did not return.
LINEBACKER
| Player | Total defensive snap share | 1st/2nd down snap share | 3rd/4th down snap share | Blitz rate | Tackle efficiency |
| Jamin Davis | 100% | 100% | 100% | 7.1% | 17.0% |
| David Mayo | 92.9% | 100% | 69.2% | 0.0% | 14.3% |
| Khaleke Hudson | 1.8% | 2.3% | 0.0% | 0.0% | 0.0% |
SAFETY
| Player | Total defensive snap share | Box snap % | Deep safety % | Slot corner % | Defensive line % |
| Darrick Forrest | 100% | 32.1% | 57.1% | 8.9% | 1.8% |
| Jeremy Reaves | 98.2% | 49.1% | 38.2% | 10.9% | 1.8% |
| Bobby McCain | 82.1% | 21.7% | 13.0% | 60.9% | 4.3% |
| Percy Butler | 7.1% | 0.0% | 75.0% | 25.0% | 0.0% |
CORNERBACK
| Player | Total defensive snap share | Wide corner % | Slot corner % | Box snap % | Forced incompletion % | Targets faced |
| Kendall Fuller | 100% | 83.9% | 1.8% | 10.7% | 0.0% | 3 |
| Danny Johnson | 100% | 78.6% | 1.8% | 19.6% | 75.0% | 4 |
KEY TERMS AND METHODOLOGY
- Overall defense: Understand which teams are deploying specific coverages and personnel packages that help determine which IDPs will be on the field and how they are deployed.
- Edge defenders & defensive interior: Which players are dominating at the line of scrimmage and putting up the best predictive pass rush metrics.
- Linebackers: Which linebackers are on the field and which ones are being subbed out regularly.
- Safeties: Where are these players lining up pre-snap — the closer to the line of scrimmage, the better their odds of landing a tackle.
- Cornerbacks: Who are the outside and slot corners for each team and which ones are targeted the most.
Data keys
- Tackle efficiency = Percentage of snaps where that IDP was in on a tackle. Average tackle efficiency for linebackers in 2022 is 12.3%.
- Win rate = Percentage of snaps that a defensive lineman won their rep against a blocker. Average win rate for edge defenders in 2022 is 12.1%. Average win rate for interior defenders in 2022 is 8.7%.
- Pressure rate = Percentage of pass-rush snaps that resulted in a pressure. Average pressure rate for edge defenders in 2022 is 9.2%. Average pressure rate for interior defenders in 2022 is 6.1%.
- Pass-rush grade = PFF pass-rush grade, taking into account the quality of every pass-rush snap for every player on every play. Average pass-rush grade for edge defenders in 2022 is 63.0. Average pass-rush grade for interior defenders in 2022 is 61.3.
- +EPA allowed % = The percentage of plays against the defense that resulted in positive expected points added for the offense.
- Zone coverage rate = Percentage of Cover-2, Cover-3 (+variations), Cover-4/quarters, and Cover-6 snaps played by the defense.
- Man coverage rate = Percentage of Cover-1, Cover-0, and Cover-2-Man snaps played by the defense.
- Dime personnel rate = Percentage of snaps the defense spent with six defensive backs on the field at once, typically at the cost of a linebacker.
- Blitz rate = Percentage of snaps where the defense sent at least one extra pass rusher on a given play.
- Box snaps = Snaps where the defensive player is lined up in a linebacker or strong safety alignment (within 2-10 yards of the line of scrimmage).
- Free safety snaps = Snaps where the defensive player is lined up more than 10.5 yards from the line of scrimmage.
- Slot corner snaps = Snaps where the defensive player is lined up covering an eligible receiver who is aligned inside of an outside receiving option.
- Outside corner snaps = Snaps where the defensive player is the widest outside defender to any given side where there is a wide receiver aligned.
- Defensive line snaps = Snaps where the defensive player is lined up on or within 1.5 yards of the line of scrimmage.
- Forced incompletion rate = Percentage of snaps where a coverage player forced an incomplete pass by way of a pass-breakup, a hit that knocks the ball loose, cutting off the receiver’s route, forcing the receiver out of bounds before a completion can be made, or tight enough coverage that causes the ball to be uncatchable.
