
- Unlock your edge with PFF+: Access Premium Stats, dominate fantasy with in-season tools and projections and make smarter bets with the new PFF Player Prop Tool. Get 25% off your PFF+ annual subscription with code PFFFANTASYPODCAST25.
Estimated Reading Time: 6 minutes

Last year, I introduced a new framework for understanding wide receiver play, quarterback decision-making and offensive potential. This framework relies on an XGBOOST model and PFF’s impressive collection of route-level data. Using machine learning and this breadth of PFF data, we can create models with the goal of predicting where a target should go on a given play.
The resulting metrics, Share of Predicted Targets and Share of Predicted Air Yards, are both more stable than their “actual” counterparts
Week 4 Recap
- Zay Flowers: 8 Targets – 26.67% Target Share
- Troy Franklin: 8 Targets – 19% Target Share
- Cooper Kupp: 5 Targets – 20.83% Target Share
- Jakobi Meyers: 7 Targets – 35% Target Share
- Khalil Shakir: 5 Targets – 22.7% Target Share
Week 5 Potential Breakouts
These are players who were open significantly more than they garnered targets in Week 4. In general, players who show up on this list see an uptick in Targets per Route Run and Target Share relative to both themselves and all players with similar target shares.
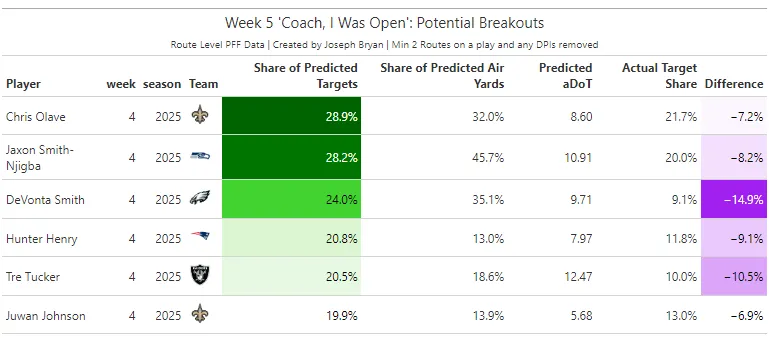
A.J. Brown had a massive 37% Target Share in Week 4, while DeVonta Smith was left out to dry, only garnering a 9% target share in an offense that had zero passing yards on 11 dropbacks in the second half against Tampa. These are two receivers ready to have an awesome season, and they are simply not being supported in this passing offense.
Defensive Analysis Through Week 4
The Predicted Targets Model allows us to evaluate a quarterback’s performance over a single game, a series of games or even an entire season; this also applies to opposing quarterbacks and our ability to analyze a defense. This model analyzes every route on every play, calculating the probability that a given player will be targeted based on factors such as openness, PFF grade, level of separation and more. By leveraging this route-level data, we can determine whether the quarterback made an optimal decision and if the defense allows optimal decisions — or even better, forces bad decisions.
To simplify the analysis, I categorized every decision into three distinct categories:
1. Optimal Decision: The quarterback threw to the player with the highest target probability.
2. Suboptimal Decision: The quarterback threw to a player who did not have the highest target probability.
3. Bad Decision: The quarterback threw to the player with the lowest target probability.
It’s important to note that these categorizations are based on the model’s quantifications and may not always align perfectly with real-world outcomes. For example, Jalen Hurts might throw a 25-yard jump ball to A.J. Brown. While the model might label this as a suboptimal decision based on A.J. Brown’s openness, the context — such as Brown’s talent — might make it a good choice.
Example Play
Let’s break down a hypothetical play where four players ran routes with the following target probabilities:
- A.J. Brown: 74.5% — Optimal Decision
- DeVonta Smith: 17.2% — Suboptimal Decision
- Saquon Barkley: 13.7% — Suboptimal Decision
- Dallas Goedert: 12.8% — Suboptimal & Bad Decision (A decision is both suboptimal and bad when it is the worst option)
If Jalen Hurts throws to each of these players, the corresponding decision category is shown above. I applied this process to every route on every play, aggregating the data into the table below for broader insights. Now, we can apply this in reverse and look at what a defense is allowing — or even when defenses are forcing bad decisions.
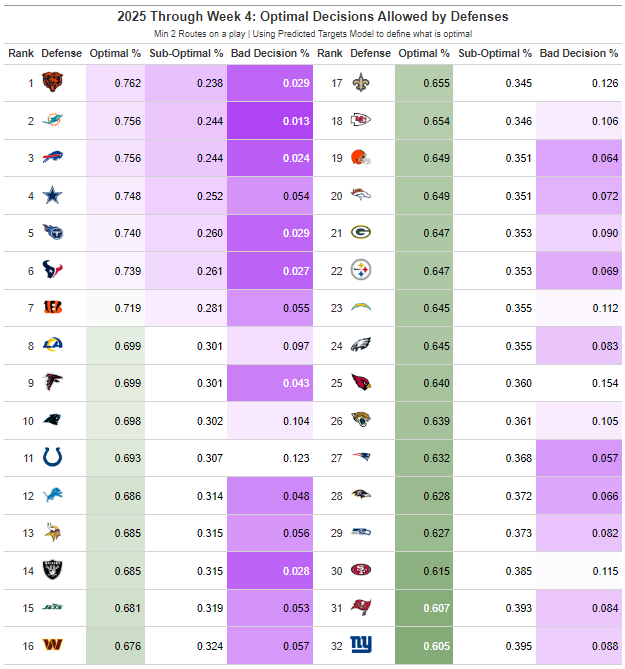
These are results from the first four weeks of the season. A defense allowing an optimal decision isn’t always a bad thing for the defense, as the gameplan could be to cover deep and intermediate passes while allowing open targets underneath. Forcing bad decisions is mostly a good thing, as these could lead to turnovers — but, depending on whether the defense is in man or zone, this might be more indicative of the quarterback thinking they have a one-on-one advantage and throwing more jump balls.
The Giants are not allowing a lot of optimal decisions, and this is likely due to the fact they are the only team that has played more man coverage snaps (99) than zone coverage snaps (91) this season. This information by itself doesn’t necessarily mean the defense is good or bad, but it does reveal that the quarterbacks that the Giants have faced aren’t playing optimally, according to my model.
The Bears are also very interesting, as they do not run the most zone coverage; they actually play Cover 1 at the fourth-highest rate in the NFL. When digging a little deeper, this is likely due to the fact that the Bears get the second-least amount of quick pressure in the NFL while also running man coverage at a relatively high rate. These are two factors that allow receivers enough time to beat their man coverage, while simultaneously giving the quarterback sufficient time to make most of their reads and find the optimal target.
The Dolphins almost never force a bad decision, and they rank as PFF’s second-worst team coverage unit. Miami only has one secondary player with a PFF coverage grade above 70.0 on the season (Rasul Douglas). The Dolphins also boast the third-worst PFF grade as a team when in man coverage and the fifth-worst grade when in zone coverage. Combine that with the sixth-worst quick pressure rate in the NFL, and you have a defense that has had the inability to force bad decisions.
Week 4 Review
The Commanders’ defense currently slots 32nd in team PFF coverage grade by a wide margin. The Commanders have a 32.5 team coverage grade, while the Dolphins — who are 31st — possess a 42.2 mark.
On this example, it’s 2nd-and-16 in the second quarter. The Falcons are only winning by 3 and, the Commanders have the down and distance advantage.
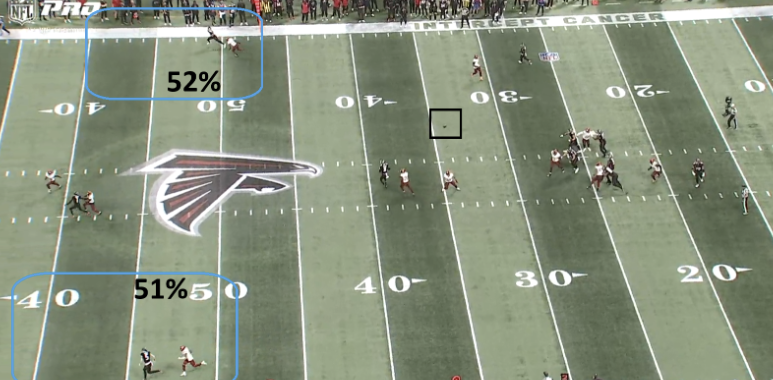
The Falcons are aiming at a big play: They have Drake London run a corner-go and Casey Washington run an out-and-up route. The Commanders are in man coverage, and both routes get open. Michael Penix Jr. prefers London and gives him the target, while Casey Washington is also wide open on the other side of the field. London catches this pass despite Marshon Lattimore holding him, and it’s a huge gain for the Falcons.
