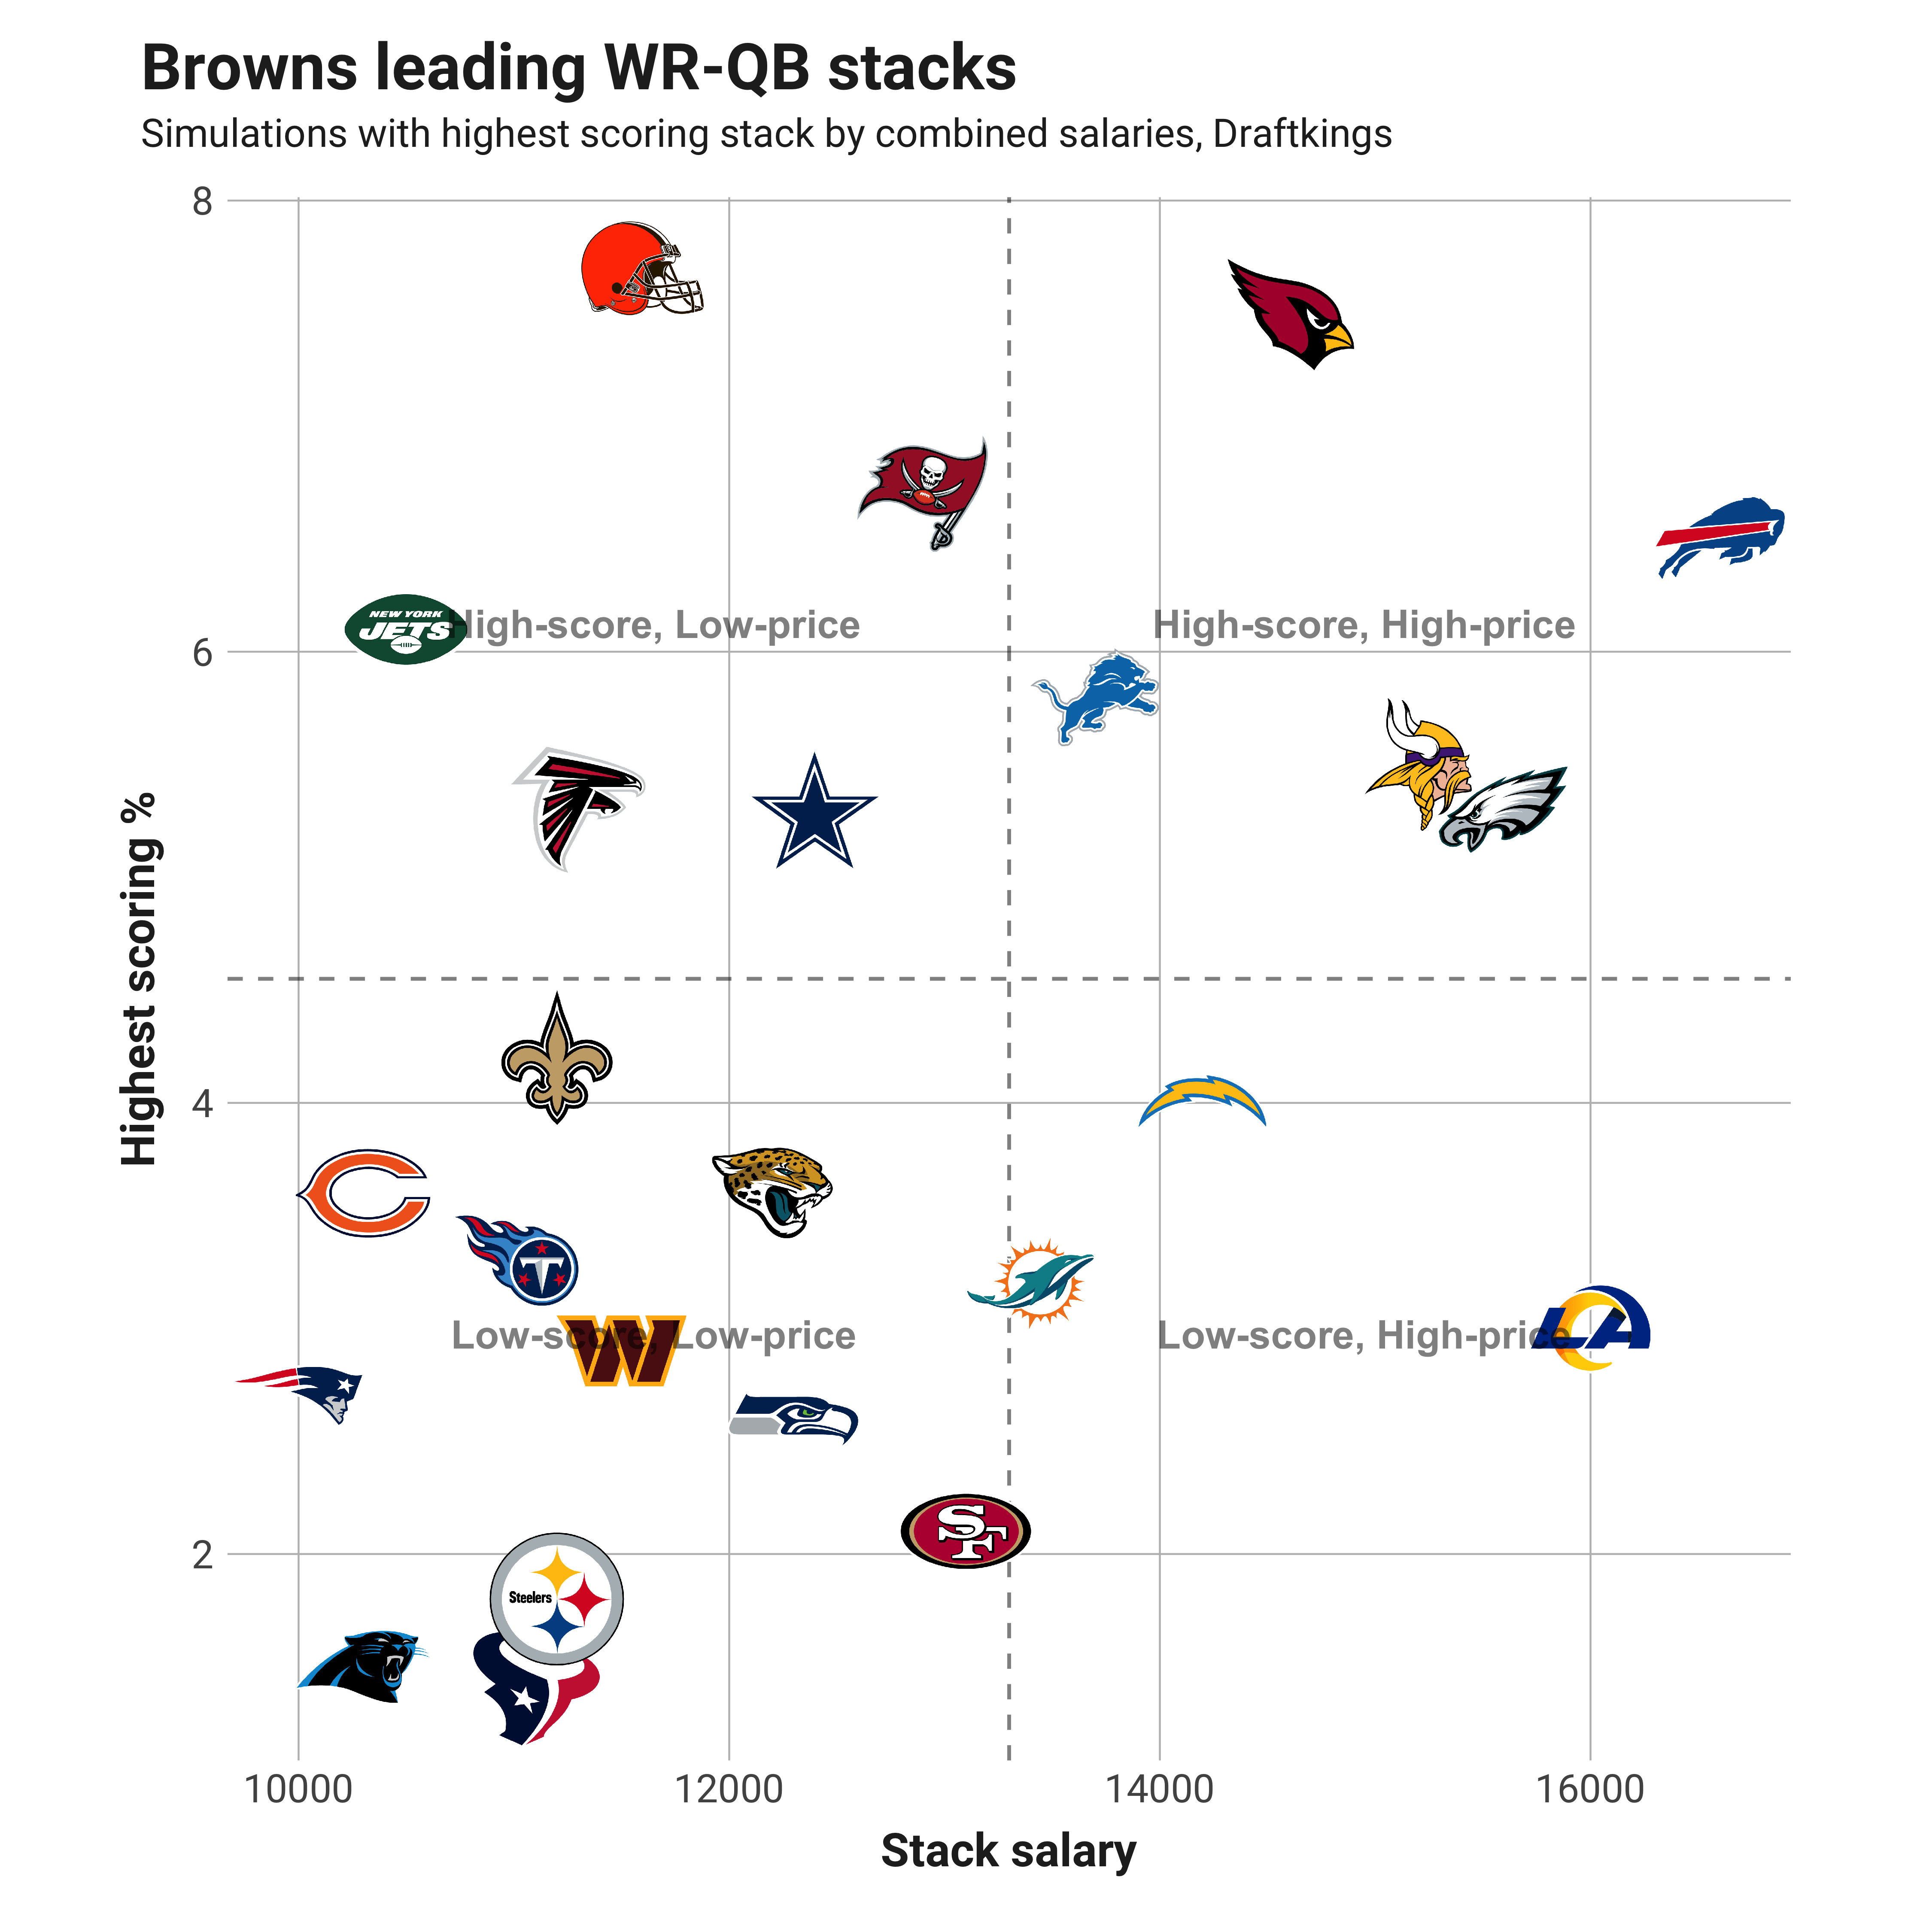
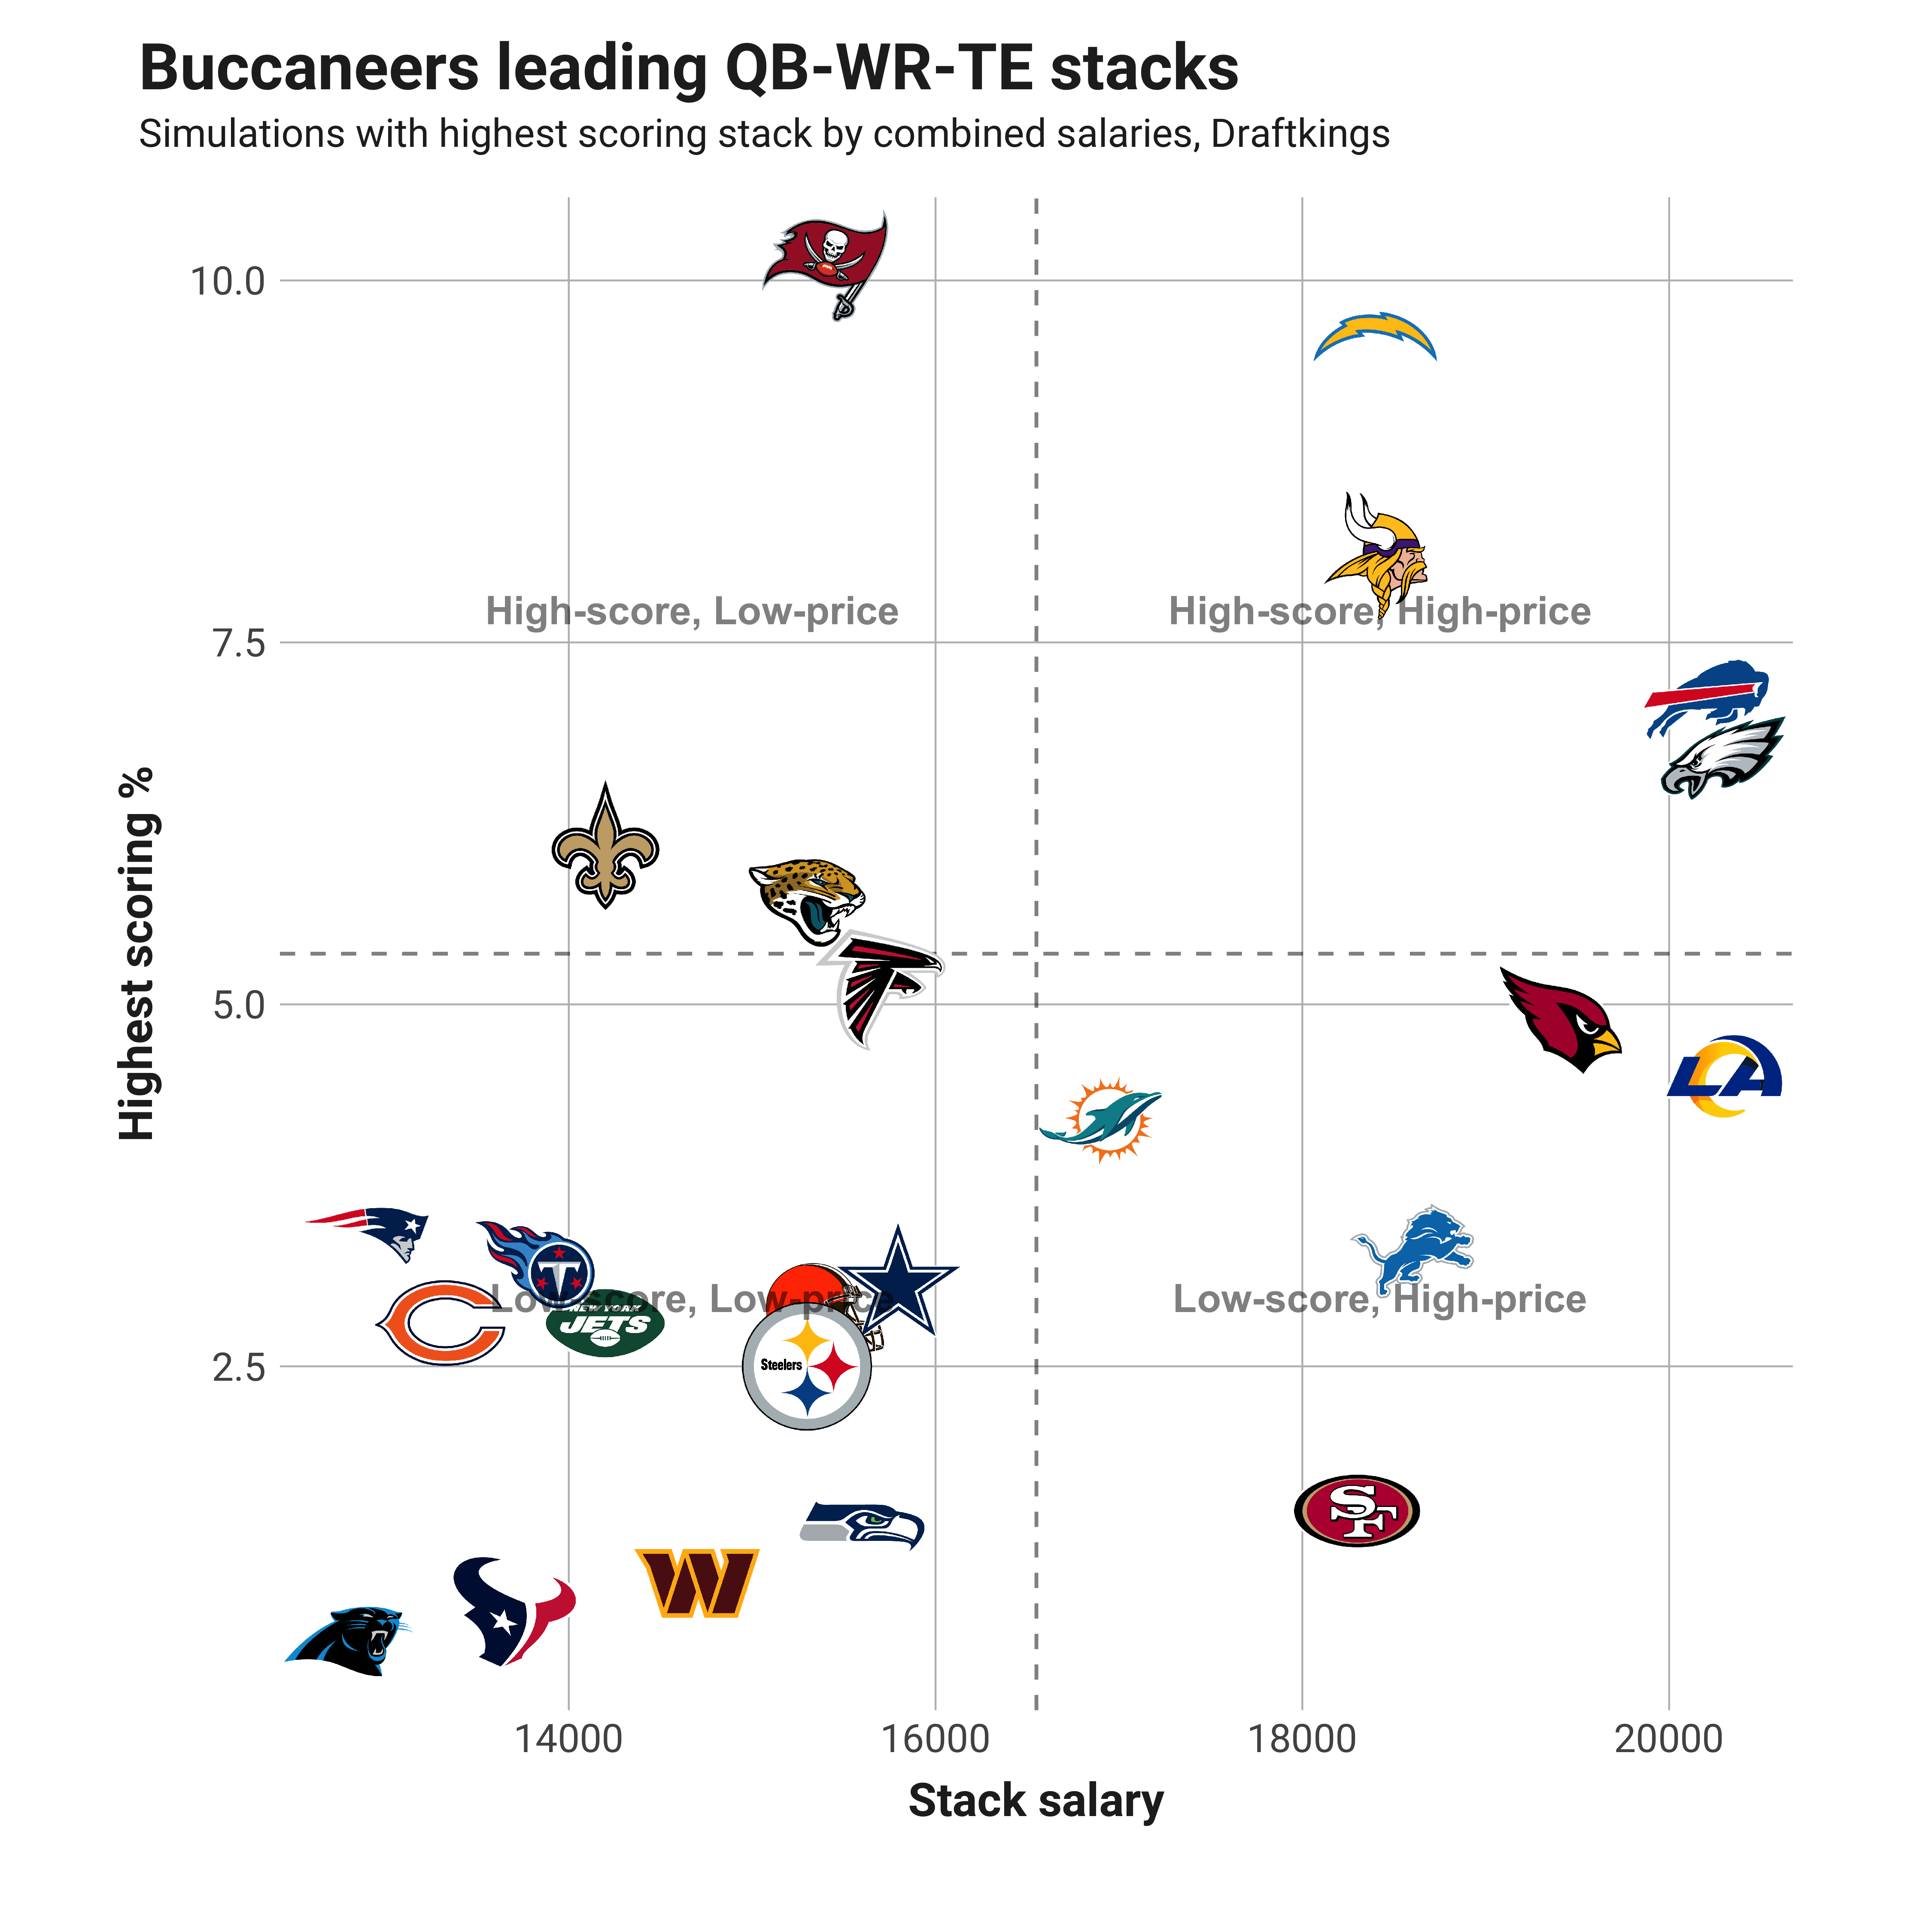
- Stack the Tampa Bay Buccaneers and Cleveland Browns: The combinations of Tom Brady–Mike Evans and Jacoby Brissett–Amari Cooper are projected to be top stacks this week with lower combined salaries.
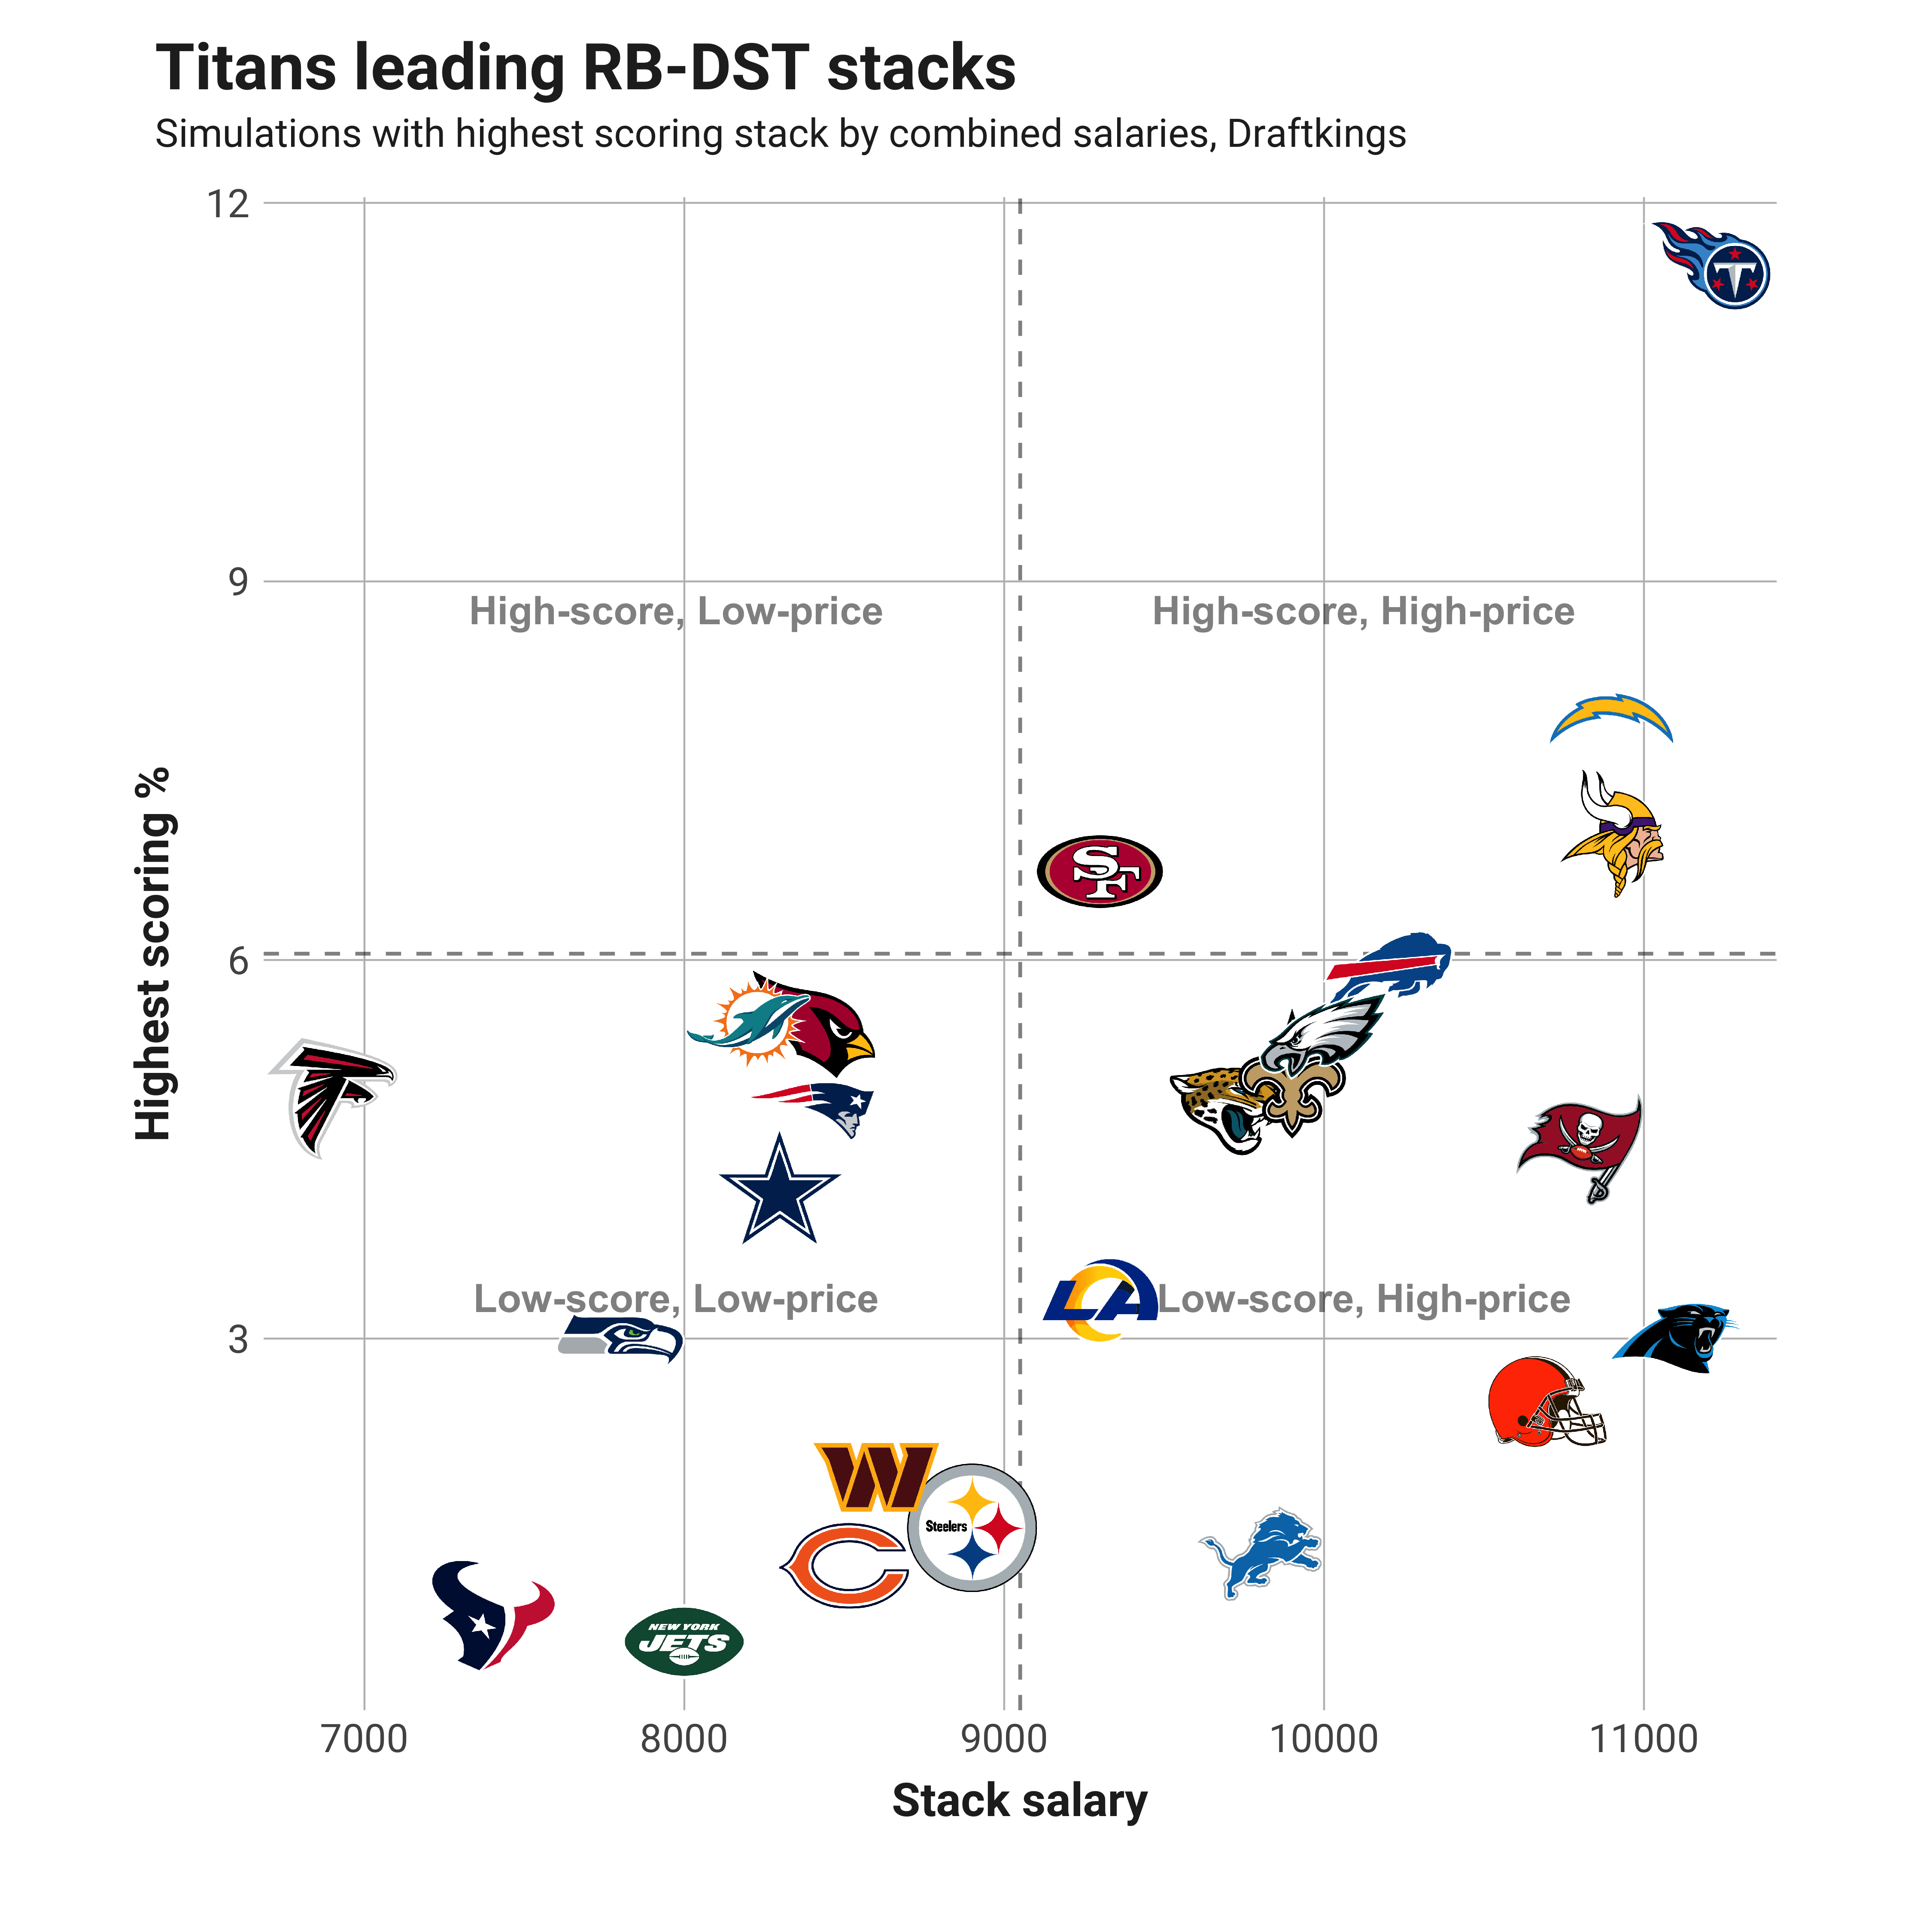
- High-upside RB-DST stack for Week 2: The Tennessee Titans have the highest chance of being the highest-scoring RB-DST stack, but the San Francisco 49ers are a better value with a lower salary on Jeff Wilson.
- Best Week 2 DFS three-player stack: The QB-WR-TE stack to own this week is the Los Angeles Chargers‘ Justin Herbert, Mike Williams and Gerald Everett.
This DFS main-slate stacks analysis is a variation of the methodology used in analyses on the single-game DraftKings showdown slates. It uses the combination of current projections, historical game results and similarity algorithms to simulate an upcoming game by looking back at the most similar historical matchups. In this analysis, I’m taking the same outline and applying it instead to the DFS main slate by projecting the likelihood each team’s QB-WR, RB-DST, QB-WR-TE, QB-RB-WR stacks will be the highest scoring of the slate. These are some of the most popular stack combinations employed in DFS strategy.
The numbers below are harnessing the unexpected connections and reactions between players that have actually happened over the past several years and thereby point to under/overvalued stacks that won’t be identified through traditional projections and logical deduction.

QUARTERBACK/WIDE RECEIVER STACK
QB/WR players
| Team | Opponent | Highest % | Player | Pos | DK Fpts | DK Salary | FD Fpts | FD Salary |
| CLV | LAC | 7.7 | Jacoby Brissett | QB | 18.9 | 5,600 | 17.7 | 6,700 |
| CLV | LAC | 7.7 | Amari Cooper | WR | 14.1 | 6,000 | 11.1 | 7,000 |
| ARZ | PHI | 7.5 | Kyler Murray | QB | 20.8 | 7,400 | 19.7 | 8,100 |
| ARZ | PHI | 7.5 | Marquise Brown | WR | 15.2 | 7,200 | 11.9 | 7,800 |
| TB | ATL | 6.7 | Tom Brady | QB | 24.2 | 6,000 | 22.4 | 7,800 |
| TB | ATL | 6.7 | Mike Evans | WR | 18.1 | 6,900 | 14.7 | 7,500 |
| BUF | PIT | 6.5 | Josh Allen | QB | 27.3 | 8,200 | 25.5 | 9,000 |
| BUF | PIT | 6.5 | Stefon Diggs | WR | 18.7 | 8,400 | 14.7 | 8,600 |
| NYJ | MIA | 6.1 | Zach Wilson | QB | 16.9 | 5,300 | 15.8 | 7,200 |
| NYJ | MIA | 6.1 | Garrett Wilson | WR | 10.5 | 5,200 | 8.4 | 6,000 |
| DET | NE | 5.8 | Jared Goff | QB | 15.1 | 6,100 | 14.2 | 8,000 |
| DET | NE | 5.8 | Amon-Ra St. Brown | WR | 14.3 | 7,600 | 10.9 | 8,200 |
| MIN | CHI | 5.5 | Kirk Cousins | QB | 21.4 | 6,300 | 19.8 | 7,100 |
| MIN | CHI | 5.5 | Justin Jefferson | WR | 22.7 | 8,900 | 17.8 | 8,800 |
| ATL | TB | 5.3 | Marcus Mariota | QB | 18.0 | 5,400 | 16.7 | 6,800 |
| ATL | TB | 5.3 | Drake London | WR | 14.7 | 5,900 | 11.4 | 6,200 |
| DAL | LA | 5.3 | Cooper Rush | QB | 17.1 | 5,400 | 15.9 | 6,500 |
| DAL | LA | 5.3 | CeeDee Lamb | WR | 14.8 | 7,000 | 11.7 | 7,200 |
| PHI | ARZ | 5.3 | Jalen Hurts | QB | 26.7 | 8,100 | 24.8 | 8,600 |
| PHI | ARZ | 5.3 | A.J. Brown | WR | 18.4 | 7,500 | 14.6 | 8,000 |
| NO | SEA | 4.2 | Jameis Winston | QB | 20.1 | 5,500 | 18.8 | 7,300 |
| NO | SEA | 4.2 | Chris Olave | WR | 18.5 | 5,700 | 14.6 | 6,900 |
| LAC | CLV | 4.0 | Justin Herbert | QB | 20.0 | 7,100 | 18.7 | 8,200 |
| LAC | CLV | 4.0 | Mike Williams | WR | 15.4 | 7,100 | 12.3 | 7,400 |
| CHI | MIN | 3.6 | Justin Fields | QB | 16.9 | 5,300 | 15.9 | 6,600 |
| CHI | MIN | 3.6 | Darnell Mooney | WR | 10.8 | 5,000 | 8.6 | 5,800 |
| JAX | HST | 3.6 | Trevor Lawrence | QB | 19.2 | 5,600 | 18.0 | 7,600 |
| JAX | HST | 3.6 | Christian Kirk | WR | 14.1 | 6,600 | 11.2 | 7,600 |
| TEN | WAS | 3.3 | Ryan Tannehill | QB | 17.8 | 5,800 | 17.0 | 6,900 |
| TEN | WAS | 3.3 | Robert Woods | WR | 10.7 | 5,200 | 8.4 | 5,900 |
| MIA | NYJ | 3.2 | Teddy Bridgewater | QB | 20.7 | 5,400 | 19.6 | 6,400 |
| MIA | NYJ | 3.2 | Tyreek Hill | WR | 20.8 | 8,000 | 16.6 | 8,400 |
| LA | DAL | 3.0 | Matthew Stafford | QB | 19.8 | 6,400 | 18.5 | 7,400 |
| LA | DAL | 3.0 | Cooper Kupp | WR | 22.0 | 9,600 | 17.1 | 9,500 |
| WAS | TEN | 2.9 | Carson Wentz | QB | 17.5 | 5,700 | 16.3 | 6,800 |
| WAS | TEN | 2.9 | Curtis Samuel | WR | 13.8 | 5,800 | 11.0 | 5,800 |
| NE | DET | 2.7 | Mac Jones | QB | 18.4 | 5,200 | 17.2 | 6,600 |
| NE | DET | 2.7 | Jakobi Meyers | WR | 12.7 | 4,800 | 9.9 | 6,000 |
| SEA | NO | 2.6 | Geno Smith | QB | 18.4 | 5,500 | 17.0 | 6,900 |
| SEA | NO | 2.6 | D.K. Metcalf | WR | 16.4 | 6,800 | 13.0 | 7,100 |
| SF | CAR | 2.1 | Jimmy Garoppolo | QB | 17.3 | 5,400 | 16.3 | 7,000 |
| SF | CAR | 2.1 | Deebo Samuel | WR | 18.9 | 7,700 | 15.9 | 7,300 |
| PIT | BUF | 1.8 | Kenny Pickett | QB | 15.6 | 5,100 | 14.6 | 6,500 |
| PIT | BUF | 1.8 | Diontae Johnson | WR | 12.4 | 6,100 | 9.5 | 6,700 |
| CAR | SF | 1.5 | Baker Mayfield | QB | 13.9 | 5,100 | 13.0 | 6,400 |
| CAR | SF | 1.5 | D.J. Moore | WR | 13.7 | 5,200 | 10.9 | 5,900 |
| HST | JAX | 1.4 | Davis Mills | QB | 16.9 | 5,000 | 15.6 | 6,400 |
| HST | JAX | 1.4 | Brandin Cooks | WR | 17.4 | 6,100 | 13.5 | 6,800 |
RUNNING BACK/DST
RB/DST players
| Team | Opponent | Highest % | Player | Pos | DK Fpts | DK Salary | FD Fpts | FD Salary |
| TEN | WAS | 11.5 | Derrick Henry | RB | 20.7 | 8,200 | 18.0 | 8,900 |
| TEN | WAS | 11.5 | Titans DST | DST | 6.4 | 3,000 | 6.4 | 4,200 |
| LAC | CLV | 7.9 | Austin Ekeler | RB | 18.8 | 7,800 | 15.7 | 9,000 |
| LAC | CLV | 7.9 | Chargers DST | DST | 4.9 | 3,100 | 4.9 | 3,900 |
| MIN | CHI | 7.0 | Dalvin Cook | RB | 20.0 | 7,300 | 17.3 | 7,300 |
| MIN | CHI | 7.0 | Vikings DST | DST | 10.2 | 3,600 | 10.2 | 4,300 |
| SF | CAR | 6.7 | Jeff Wilson Jr. | RB | 13.4 | 5,500 | 12.2 | 6,500 |
| SF | CAR | 6.7 | 49ers DST | DST | 9.1 | 3,800 | 9.1 | 4,400 |
| BUF | PIT | 5.9 | Devin Singletary | RB | 13.3 | 6,100 | 11.6 | 6,000 |
| BUF | PIT | 5.9 | Bills DST | DST | 11.4 | 4,100 | 11.4 | 5,000 |
| MIA | NYJ | 5.5 | Raheem Mostert | RB | 10.4 | 5,000 | 9.4 | 5,800 |
| ARZ | PHI | 5.5 | James Conner | RB | 12.4 | 6,300 | 10.6 | 6,700 |
| MIA | NYJ | 5.5 | Dolphins DST | DST | 7.9 | 3,200 | 7.9 | 4,900 |
| ARZ | PHI | 5.5 | Cardinals DST | DST | 5.5 | 2,100 | 5.5 | 3,400 |
| PHI | ARZ | 5.4 | Miles Sanders | RB | 10.9 | 6,500 | 9.5 | 7,600 |
| PHI | ARZ | 5.4 | Eagles DST | DST | 6.8 | 3,500 | 6.8 | 4,500 |
| NO | SEA | 5.1 | Alvin Kamara | RB | 17.5 | 6,600 | 15.2 | 7,000 |
| NO | SEA | 5.1 | Saints DST | DST | 8.2 | 3,300 | 8.2 | 3,800 |
| ATL | TB | 4.9 | Tyler Allgeier | RB | 10.2 | 4,700 | 8.9 | 5,700 |
| ATL | TB | 4.9 | Falcons DST | DST | 2.9 | 2,200 | 2.9 | 3,000 |
| NE | DET | 4.8 | Rhamondre Stevenson | RB | 10.1 | 5,500 | 9.2 | 6,000 |
| JAX | HST | 4.8 | James Robinson | RB | 12.4 | 6,300 | 11.2 | 8,000 |
| NE | DET | 4.8 | Patriots DST | DST | 6.3 | 2,900 | 6.3 | 3,600 |
| JAX | HST | 4.8 | Jaguars DST | DST | 7.8 | 3,400 | 7.8 | 4,600 |
| TB | ATL | 4.5 | Leonard Fournette | RB | 17.6 | 6,900 | 15.6 | 7,800 |
| TB | ATL | 4.5 | Buccaneers DST | DST | 8.2 | 3,900 | 8.2 | 4,800 |
| DAL | LA | 4.2 | Ezekiel Elliott | RB | 10.5 | 5,800 | 9.2 | 6,200 |
| DAL | LA | 4.2 | Cowboys DST | DST | 6.2 | 2,500 | 6.2 | 4,100 |
| LA | DAL | 3.3 | Cam Akers | RB | 10.8 | 5,600 | 9.7 | 6,100 |
| LA | DAL | 3.3 | Rams DST | DST | 6.6 | 3,700 | 6.6 | 3,900 |
| SEA | NO | 3.0 | Rashaad Penny | RB | 10.3 | 5,300 | 9.2 | 6,900 |
| CAR | SF | 3.0 | Christian McCaffrey | RB | 19.1 | 8,500 | 15.8 | 8,700 |
| SEA | NO | 3.0 | Seahawks DST | DST | 6.1 | 2,500 | 6.1 | 3,100 |
| CAR | SF | 3.0 | Panthers DST | DST | 5.4 | 2,600 | 5.4 | 3,600 |
| CLV | LAC | 2.5 | Nick Chubb | RB | 13.9 | 8,000 | 12.5 | 9,400 |
| CLV | LAC | 2.5 | Browns DST | DST | 6.5 | 2,700 | 6.5 | 4,000 |
| WAS | TEN | 1.9 | Antonio Gibson | RB | 13.9 | 5,900 | 12.1 | 6,300 |
| WAS | TEN | 1.9 | Commanders DST | DST | 5.5 | 2,700 | 5.5 | 3,200 |
| PIT | BUF | 1.5 | Najee Harris | RB | 12.0 | 6,500 | 10.3 | 6,600 |
| PIT | BUF | 1.5 | Steelers DST | DST | 4.3 | 2,400 | 4.3 | 3,500 |
| DET | NE | 1.3 | D'Andre Swift | RB | 14.6 | 7,000 | 12.7 | 8,300 |
| DET | NE | 1.3 | Lions DST | DST | 5.5 | 2,800 | 5.5 | 4,700 |
| CHI | MIN | 1.2 | David Montgomery | RB | 12.3 | 6,200 | 10.7 | 7,100 |
| CHI | MIN | 1.2 | Bears DST | DST | 4.5 | 2,300 | 4.5 | 3,300 |
| HST | JAX | 0.8 | Rex Burkhead | RB | 8.7 | 5,000 | 7.5 | 5,100 |
| HST | JAX | 0.8 | Texans DST | DST | 5.7 | 2,400 | 5.7 | 3,700 |
| NYJ | MIA | 0.6 | Breece Hall | RB | 12.4 | 5,400 | 10.7 | 6,600 |
| NYJ | MIA | 0.6 | Jets DST | DST | 5.2 | 2,600 | 5.2 | 4,000 |
QUARTERBACK/WIDE RECEIVER/TIGHT END
QB/WR/TE players
| Team | Opponent | Highest % | Player | Pos | DK Fpts | DK Salary | FD Fpts | FD Salary |
| TB | ATL | 10.1 | Tom Brady | QB | 24.2 | 6,000 | 22.4 | 7,800 |
| TB | ATL | 10.1 | Mike Evans | WR | 18.1 | 6,900 | 14.7 | 7,500 |
| TB | ATL | 10.1 | Cade Otton | TE | 6.5 | 2,500 | 5.3 | 4,100 |
| LAC | CLV | 9.6 | Justin Herbert | QB | 20.0 | 7,100 | 18.7 | 8,200 |
| LAC | CLV | 9.6 | Mike Williams | WR | 15.4 | 7,100 | 12.3 | 7,400 |
| LAC | CLV | 9.6 | Gerald Everett | TE | 11.1 | 4,200 | 8.7 | 6,300 |
| MIN | CHI | 8.1 | Kirk Cousins | QB | 21.4 | 6,300 | 19.8 | 7,100 |
| MIN | CHI | 8.1 | Justin Jefferson | WR | 22.7 | 8,900 | 17.8 | 8,800 |
| MIN | CHI | 8.1 | Irv Smith Jr. | TE | 8.8 | 3,200 | 7.2 | 4,700 |
| BUF | PIT | 7.1 | Josh Allen | QB | 27.3 | 8,200 | 25.5 | 9,000 |
| BUF | PIT | 7.1 | Stefon Diggs | WR | 18.7 | 8,400 | 14.7 | 8,600 |
| BUF | PIT | 7.1 | Dawson Knox | TE | 9.9 | 3,600 | 8.0 | 5,000 |
| PHI | ARZ | 6.7 | Jalen Hurts | QB | 26.7 | 8,100 | 24.8 | 8,600 |
| PHI | ARZ | 6.7 | A.J. Brown | WR | 18.4 | 7,500 | 14.6 | 8,000 |
| PHI | ARZ | 6.7 | Dallas Goedert | TE | 10.6 | 4,700 | 8.5 | 6,100 |
| NO | SEA | 6.1 | Jameis Winston | QB | 20.1 | 5,500 | 18.8 | 7,300 |
| NO | SEA | 6.1 | Chris Olave | WR | 18.5 | 5,700 | 14.6 | 6,900 |
| NO | SEA | 6.1 | Juwan Johnson | TE | 7.9 | 3,000 | 6.4 | 4,700 |
| JAX | HST | 5.7 | Trevor Lawrence | QB | 19.2 | 5,600 | 18.0 | 7,600 |
| JAX | HST | 5.7 | Christian Kirk | WR | 14.1 | 6,600 | 11.2 | 7,600 |
| JAX | HST | 5.7 | Evan Engram | TE | 9.7 | 3,100 | 7.6 | 4,900 |
| ATL | TB | 5.1 | Marcus Mariota | QB | 18.0 | 5,400 | 16.7 | 6,800 |
| ATL | TB | 5.1 | Drake London | WR | 14.7 | 5,900 | 11.4 | 6,200 |
| ATL | TB | 5.1 | Kyle Pitts | TE | 13.4 | 4,400 | 10.6 | 5,600 |
| ARZ | PHI | 4.9 | Kyler Murray | QB | 20.8 | 7,400 | 19.7 | 8,100 |
| ARZ | PHI | 4.9 | Marquise Brown | WR | 15.2 | 7,200 | 11.9 | 7,800 |
| ARZ | PHI | 4.9 | Zach Ertz | TE | 12.0 | 4,800 | 9.3 | 5,900 |
| LA | DAL | 4.5 | Matthew Stafford | QB | 19.8 | 6,400 | 18.5 | 7,400 |
| LA | DAL | 4.5 | Cooper Kupp | WR | 22.0 | 9,600 | 17.1 | 9,500 |
| LA | DAL | 4.5 | Tyler Higbee | TE | 12.5 | 4,300 | 9.7 | 5,500 |
| MIA | NYJ | 4.2 | Teddy Bridgewater | QB | 20.7 | 5,400 | 19.6 | 6,400 |
| MIA | NYJ | 4.2 | Tyreek Hill | WR | 20.8 | 8,000 | 16.6 | 8,400 |
| MIA | NYJ | 4.2 | Mike Gesicki | TE | 5.3 | 3,500 | 4.3 | 5,000 |
| NE | DET | 3.4 | Mac Jones | QB | 18.4 | 5,200 | 17.2 | 6,600 |
| NE | DET | 3.4 | Jakobi Meyers | WR | 12.7 | 4,800 | 9.9 | 6,000 |
| NE | DET | 3.4 | Hunter Henry | TE | 6.4 | 2,900 | 5.2 | 4,500 |
| DET | NE | 3.3 | Jared Goff | QB | 15.1 | 6,100 | 14.2 | 8,000 |
| DET | NE | 3.3 | Amon-Ra St. Brown | WR | 14.3 | 7,600 | 10.9 | 8,200 |
| DET | NE | 3.3 | T.J. Hockenson | TE | 9.8 | 4,900 | 7.8 | 7,000 |
| TEN | WAS | 3.2 | Ryan Tannehill | QB | 17.8 | 5,800 | 17.0 | 6,900 |
| TEN | WAS | 3.2 | Robert Woods | WR | 10.7 | 5,200 | 8.4 | 5,900 |
| TEN | WAS | 3.2 | Austin Hooper | TE | 5.0 | 2,800 | 3.9 | 4,500 |
| DAL | LA | 3.1 | Cooper Rush | QB | 17.1 | 5,400 | 15.9 | 6,500 |
| DAL | LA | 3.1 | CeeDee Lamb | WR | 14.8 | 7,000 | 11.7 | 7,200 |
| DAL | LA | 3.1 | Dalton Schultz | TE | 10.0 | 3,400 | 7.8 | 4,800 |
| CLV | LAC | 2.9 | Jacoby Brissett | QB | 18.9 | 5,600 | 17.7 | 6,700 |
| CLV | LAC | 2.9 | Amari Cooper | WR | 14.1 | 6,000 | 11.1 | 7,000 |
| CLV | LAC | 2.9 | David Njoku | TE | 9.9 | 3,800 | 7.8 | 5,700 |
| CHI | MIN | 2.8 | Justin Fields | QB | 16.9 | 5,300 | 15.9 | 6,600 |
| CHI | MIN | 2.8 | Darnell Mooney | WR | 10.8 | 5,000 | 8.6 | 5,800 |
| CHI | MIN | 2.8 | Cole Kmet | TE | 7.8 | 3,000 | 6.0 | 4,600 |
| NYJ | MIA | 2.8 | Zach Wilson | QB | 16.9 | 5,300 | 15.8 | 7,200 |
| NYJ | MIA | 2.8 | Garrett Wilson | WR | 10.5 | 5,200 | 8.4 | 6,000 |
| NYJ | MIA | 2.8 | Tyler Conklin | TE | 6.5 | 3,700 | 5.0 | 5,300 |
| PIT | BUF | 2.5 | Kenny Pickett | QB | 15.6 | 5,100 | 14.6 | 6,500 |
| PIT | BUF | 2.5 | Diontae Johnson | WR | 12.4 | 6,100 | 9.5 | 6,700 |
| PIT | BUF | 2.5 | Pat Freiermuth | TE | 9.0 | 4,100 | 7.0 | 5,800 |
| SF | CAR | 1.5 | Jimmy Garoppolo | QB | 17.3 | 5,400 | 16.3 | 7,000 |
| SF | CAR | 1.5 | Deebo Samuel | WR | 18.9 | 7,700 | 15.9 | 7,300 |
| SF | CAR | 1.5 | George Kittle | TE | 10.0 | 5,200 | 8.0 | 6,500 |
| SEA | NO | 1.4 | Geno Smith | QB | 18.4 | 5,500 | 17.0 | 6,900 |
| SEA | NO | 1.4 | D.K. Metcalf | WR | 16.4 | 6,800 | 13.0 | 7,100 |
| SEA | NO | 1.4 | Will Dissly | TE | 6.2 | 3,300 | 4.9 | 5,100 |
| WAS | TEN | 1.0 | Carson Wentz | QB | 17.5 | 5,700 | 16.3 | 6,800 |
| WAS | TEN | 1.0 | Curtis Samuel | WR | 13.8 | 5,800 | 11.0 | 5,800 |
| WAS | TEN | 1.0 | Logan Thomas | TE | 8.7 | 3,200 | 6.8 | 5,200 |
| HST | JAX | 0.8 | Davis Mills | QB | 16.9 | 5,000 | 15.6 | 6,400 |
| HST | JAX | 0.8 | Brandin Cooks | WR | 17.4 | 6,100 | 13.5 | 6,800 |
| HST | JAX | 0.8 | O.J. Howard | TE | 5.7 | 2,600 | 4.5 | 4,500 |
| CAR | SF | 0.6 | Baker Mayfield | QB | 13.9 | 5,100 | 13.0 | 6,400 |
| CAR | SF | 0.6 | D.J. Moore | WR | 13.7 | 5,200 | 10.9 | 5,900 |
| CAR | SF | 0.6 | Tommy Tremble | TE | 3.8 | 2,500 | 3.0 | 4,600 |
QUARTERBACK/RUNNING BACK/WIDE RECEIVER
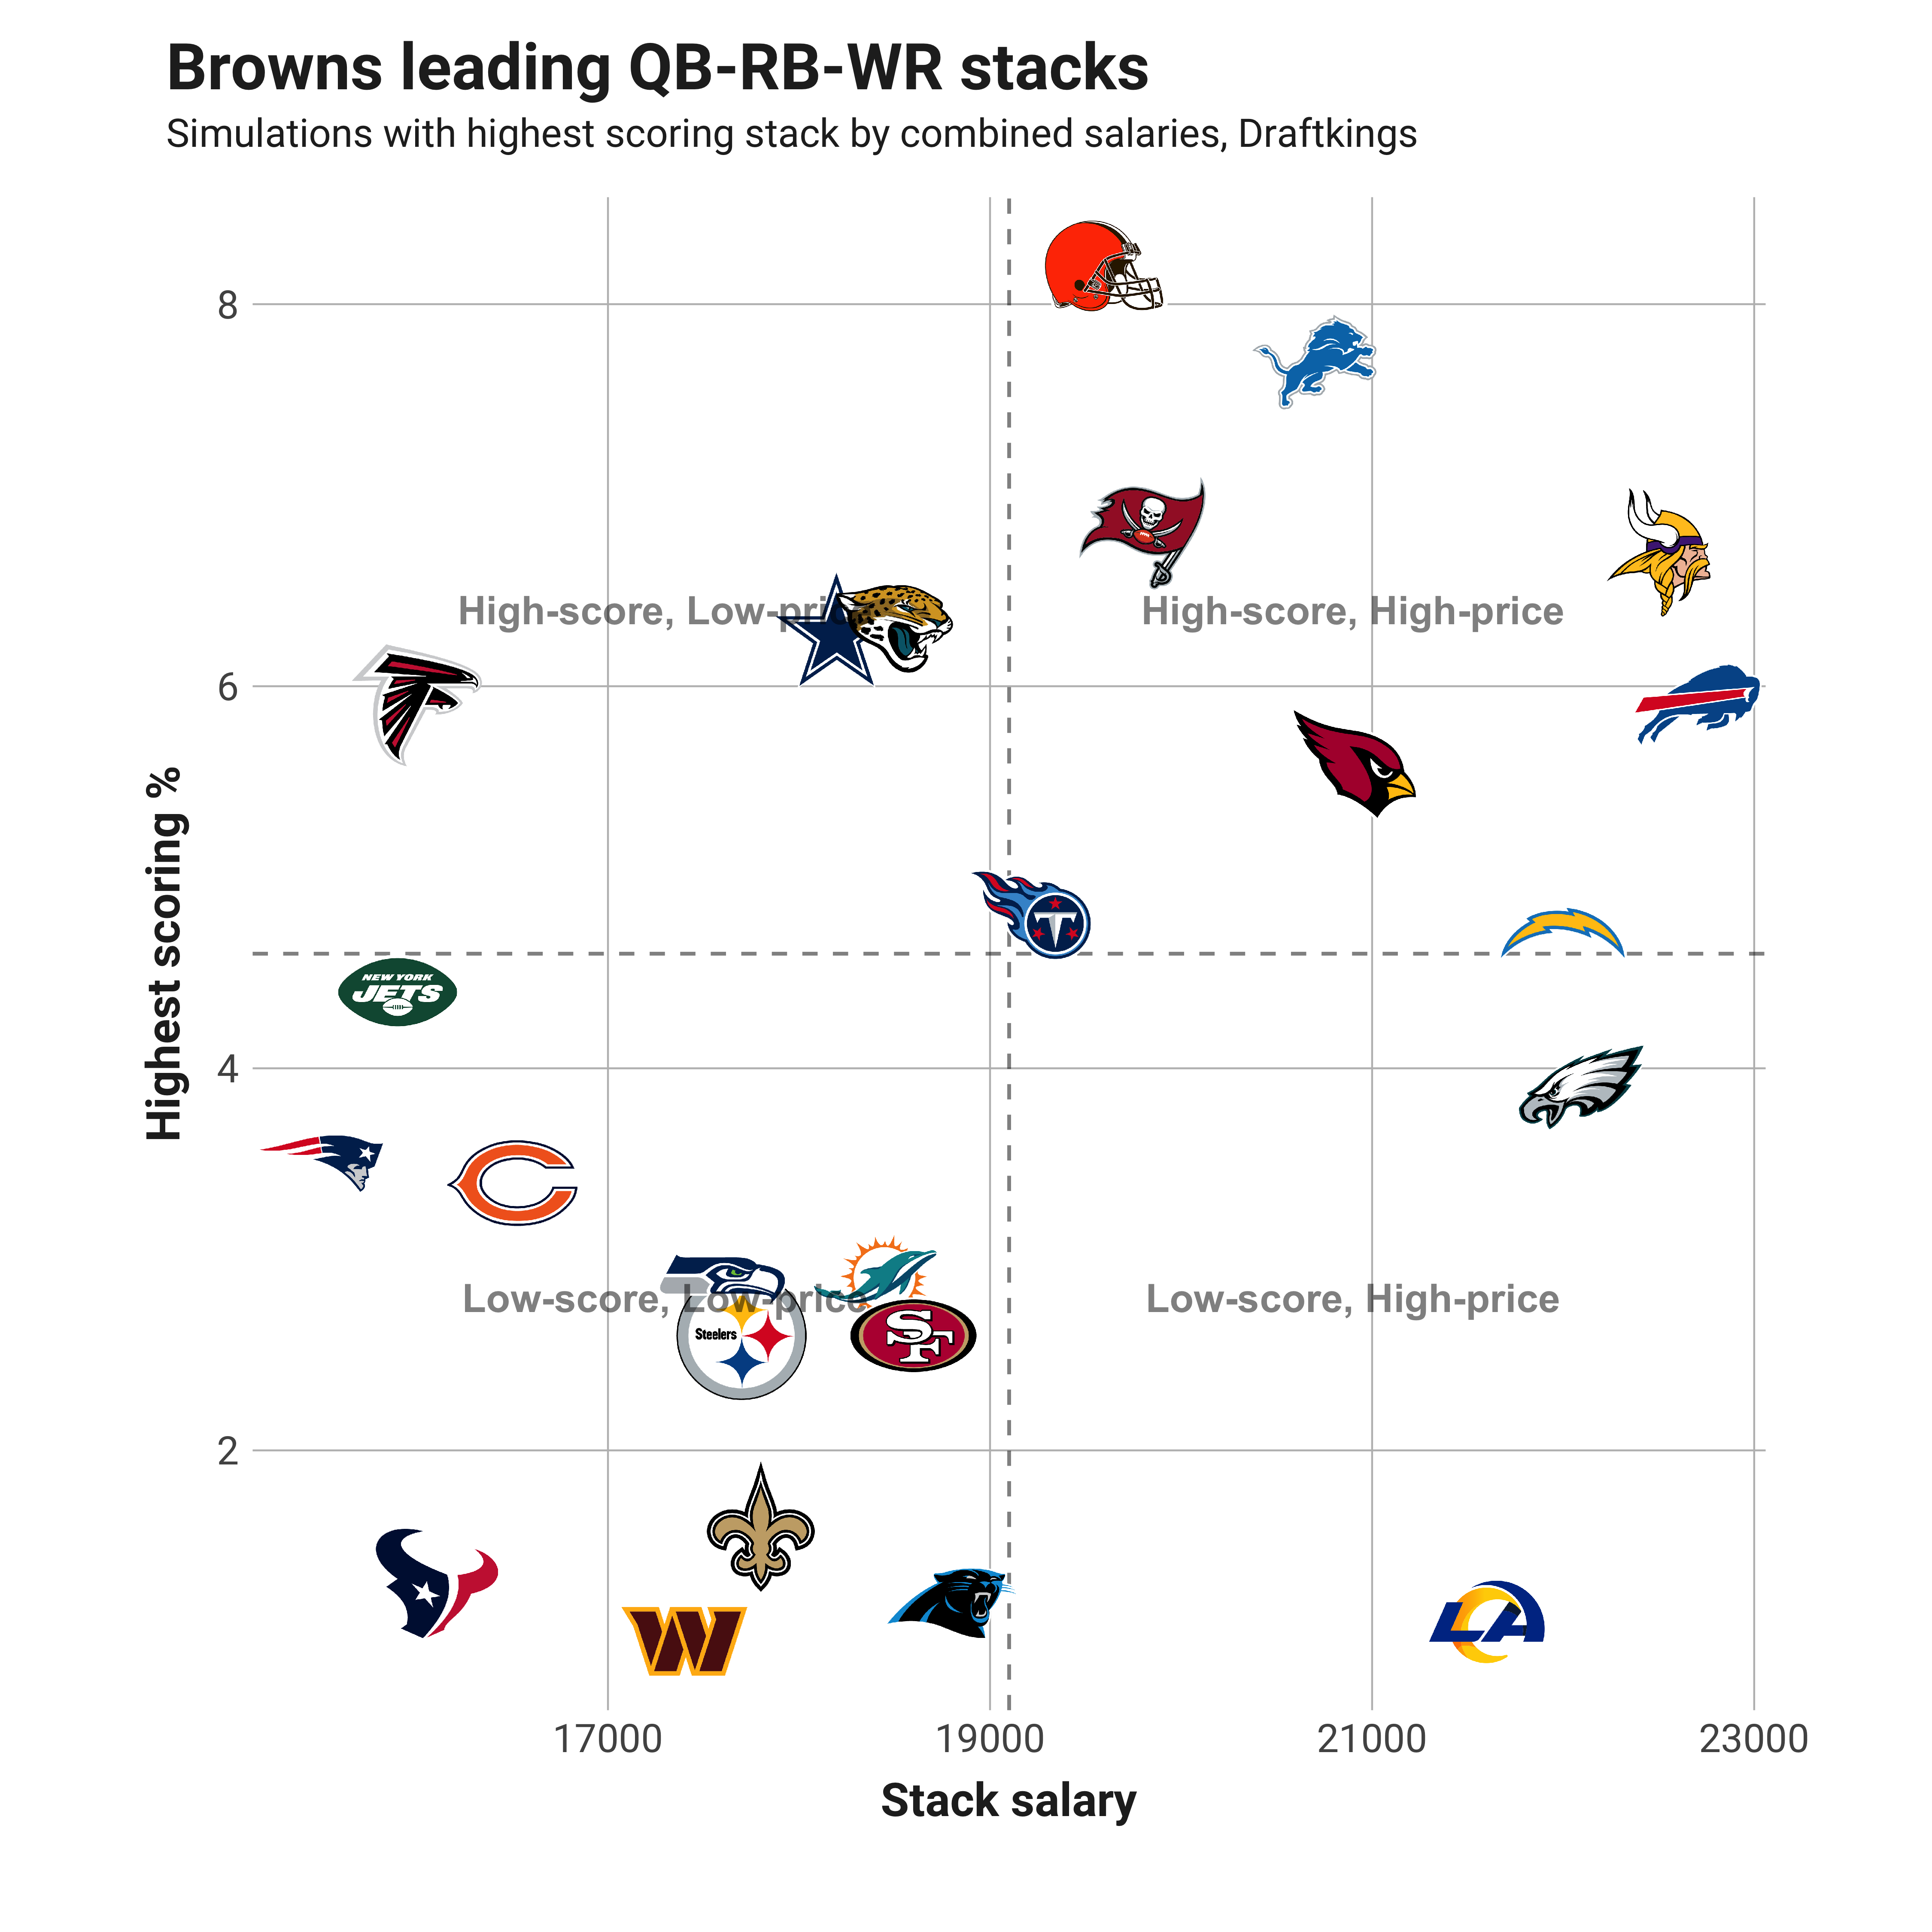
QB/RB/WR players
| Team | Opponent | Highest % | Player | Pos | DK Fpts | DK Salary | FD Fpts | FD Salary |
| CLV | LAC | 8.2 | Jacoby Brissett | QB | 18.9 | 5,600 | 17.7 | 6,700 |
| CLV | LAC | 8.2 | Nick Chubb | RB | 13.9 | 8,000 | 12.5 | 9,400 |
| CLV | LAC | 8.2 | Amari Cooper | WR | 14.1 | 6,000 | 11.1 | 7,000 |
| DET | NE | 7.7 | Jared Goff | QB | 15.1 | 6,100 | 14.2 | 8,000 |
| DET | NE | 7.7 | D'Andre Swift | RB | 14.6 | 7,000 | 12.7 | 8,300 |
| DET | NE | 7.7 | Amon-Ra St. Brown | WR | 14.3 | 7,600 | 10.9 | 8,200 |
| TB | ATL | 6.8 | Tom Brady | QB | 24.2 | 6,000 | 22.4 | 7,800 |
| TB | ATL | 6.8 | Leonard Fournette | RB | 17.6 | 6,900 | 15.6 | 7,800 |
| TB | ATL | 6.8 | Mike Evans | WR | 18.1 | 6,900 | 14.7 | 7,500 |
| MIN | CHI | 6.7 | Kirk Cousins | QB | 21.4 | 6,300 | 19.8 | 7,100 |
| MIN | CHI | 6.7 | Dalvin Cook | RB | 20.0 | 7,300 | 17.3 | 7,300 |
| MIN | CHI | 6.7 | Justin Jefferson | WR | 22.7 | 8,900 | 17.8 | 8,800 |
| DAL | LA | 6.3 | Cooper Rush | QB | 17.1 | 5,400 | 15.9 | 6,500 |
| DAL | LA | 6.3 | Ezekiel Elliott | RB | 10.5 | 5,800 | 9.2 | 6,200 |
| DAL | LA | 6.3 | CeeDee Lamb | WR | 14.8 | 7,000 | 11.7 | 7,200 |
| JAX | HST | 6.3 | Trevor Lawrence | QB | 19.2 | 5,600 | 18.0 | 7,600 |
| JAX | HST | 6.3 | James Robinson | RB | 12.4 | 6,300 | 11.2 | 8,000 |
| JAX | HST | 6.3 | Christian Kirk | WR | 14.1 | 6,600 | 11.2 | 7,600 |
| ATL | TB | 5.9 | Marcus Mariota | QB | 18.0 | 5,400 | 16.7 | 6,800 |
| ATL | TB | 5.9 | Tyler Allgeier | RB | 10.2 | 4,700 | 8.9 | 5,700 |
| ATL | TB | 5.9 | Drake London | WR | 14.7 | 5,900 | 11.4 | 6,200 |
| BUF | PIT | 5.9 | Josh Allen | QB | 27.3 | 8,200 | 25.5 | 9,000 |
| BUF | PIT | 5.9 | Devin Singletary | RB | 13.3 | 6,100 | 11.6 | 6,000 |
| BUF | PIT | 5.9 | Stefon Diggs | WR | 18.7 | 8,400 | 14.7 | 8,600 |
| ARZ | PHI | 5.6 | Kyler Murray | QB | 20.8 | 7,400 | 19.7 | 8,100 |
| ARZ | PHI | 5.6 | James Conner | RB | 12.4 | 6,300 | 10.6 | 6,700 |
| ARZ | PHI | 5.6 | Marquise Brown | WR | 15.2 | 7,200 | 11.9 | 7,800 |
| TEN | WAS | 4.8 | Ryan Tannehill | QB | 17.8 | 5,800 | 17.0 | 6,900 |
| TEN | WAS | 4.8 | Derrick Henry | RB | 20.7 | 8,200 | 18.0 | 8,900 |
| TEN | WAS | 4.8 | Robert Woods | WR | 10.7 | 5,200 | 8.4 | 5,900 |
| LAC | CLV | 4.7 | Justin Herbert | QB | 20.0 | 7,100 | 18.7 | 8,200 |
| LAC | CLV | 4.7 | Austin Ekeler | RB | 18.8 | 7,800 | 15.7 | 9,000 |
| LAC | CLV | 4.7 | Mike Williams | WR | 15.4 | 7,100 | 12.3 | 7,400 |
| NYJ | MIA | 4.4 | Zach Wilson | QB | 16.9 | 5,300 | 15.8 | 7,200 |
| NYJ | MIA | 4.4 | Breece Hall | RB | 12.4 | 5,400 | 10.7 | 6,600 |
| NYJ | MIA | 4.4 | Garrett Wilson | WR | 10.5 | 5,200 | 8.4 | 6,000 |
| PHI | ARZ | 3.9 | Jalen Hurts | QB | 26.7 | 8,100 | 24.8 | 8,600 |
| PHI | ARZ | 3.9 | Miles Sanders | RB | 10.9 | 6,500 | 9.5 | 7,600 |
| PHI | ARZ | 3.9 | A.J. Brown | WR | 18.4 | 7,500 | 14.6 | 8,000 |
| NE | DET | 3.5 | Mac Jones | QB | 18.4 | 5,200 | 17.2 | 6,600 |
| NE | DET | 3.5 | Rhamondre Stevenson | RB | 10.1 | 5,500 | 9.2 | 6,000 |
| NE | DET | 3.5 | Jakobi Meyers | WR | 12.7 | 4,800 | 9.9 | 6,000 |
| CHI | MIN | 3.4 | Justin Fields | QB | 16.9 | 5,300 | 15.9 | 6,600 |
| CHI | MIN | 3.4 | David Montgomery | RB | 12.3 | 6,200 | 10.7 | 7,100 |
| CHI | MIN | 3.4 | Darnell Mooney | WR | 10.8 | 5,000 | 8.6 | 5,800 |
| MIA | NYJ | 2.9 | Teddy Bridgewater | QB | 20.7 | 5,400 | 19.6 | 6,400 |
| MIA | NYJ | 2.9 | Raheem Mostert | RB | 10.4 | 5,000 | 9.4 | 5,800 |
| MIA | NYJ | 2.9 | Tyreek Hill | WR | 20.8 | 8,000 | 16.6 | 8,400 |
| SEA | NO | 2.9 | Geno Smith | QB | 18.4 | 5,500 | 17.0 | 6,900 |
| SEA | NO | 2.9 | Rashaad Penny | RB | 10.3 | 5,300 | 9.2 | 6,900 |
| SEA | NO | 2.9 | D.K. Metcalf | WR | 16.4 | 6,800 | 13.0 | 7,100 |
| PIT | BUF | 2.6 | Kenny Pickett | QB | 15.6 | 5,100 | 14.6 | 6,500 |
| PIT | BUF | 2.6 | Najee Harris | RB | 12.0 | 6,500 | 10.3 | 6,600 |
| PIT | BUF | 2.6 | Diontae Johnson | WR | 12.4 | 6,100 | 9.5 | 6,700 |
| SF | CAR | 2.6 | Jimmy Garoppolo | QB | 17.3 | 5,400 | 16.3 | 7,000 |
| SF | CAR | 2.6 | Jeff Wilson Jr. | RB | 13.4 | 5,500 | 12.2 | 6,500 |
| SF | CAR | 2.6 | Deebo Samuel | WR | 18.9 | 7,700 | 15.9 | 7,300 |
| NO | SEA | 1.6 | Jameis Winston | QB | 20.1 | 5,500 | 18.8 | 7,300 |
| NO | SEA | 1.6 | Alvin Kamara | RB | 17.5 | 6,600 | 15.2 | 7,000 |
| NO | SEA | 1.6 | Chris Olave | WR | 18.5 | 5,700 | 14.6 | 6,900 |
| HST | JAX | 1.3 | Davis Mills | QB | 16.9 | 5,000 | 15.6 | 6,400 |
| HST | JAX | 1.3 | Rex Burkhead | RB | 8.7 | 5,000 | 7.5 | 5,100 |
| HST | JAX | 1.3 | Brandin Cooks | WR | 17.4 | 6,100 | 13.5 | 6,800 |
| CAR | SF | 1.2 | Baker Mayfield | QB | 13.9 | 5,100 | 13.0 | 6,400 |
| CAR | SF | 1.2 | Christian McCaffrey | RB | 19.1 | 8,500 | 15.8 | 8,700 |
| CAR | SF | 1.2 | D.J. Moore | WR | 13.7 | 5,200 | 10.9 | 5,900 |
| LA | DAL | 1.1 | Matthew Stafford | QB | 19.8 | 6,400 | 18.5 | 7,400 |
| LA | DAL | 1.1 | Cam Akers | RB | 10.8 | 5,600 | 9.7 | 6,100 |
| LA | DAL | 1.1 | Cooper Kupp | WR | 22.0 | 9,600 | 17.1 | 9,500 |
| WAS | TEN | 1.0 | Carson Wentz | QB | 17.5 | 5,700 | 16.3 | 6,800 |
| WAS | TEN | 1.0 | Antonio Gibson | RB | 13.9 | 5,900 | 12.1 | 6,300 |
| WAS | TEN | 1.0 | Curtis Samuel | WR | 13.8 | 5,800 | 11.0 | 5,800 |
METHODOLOGY
For each game on the DFS Sunday main slate, I looked through thousands of NFL matchups from 2014-2021 and found the closest analogies according to the following parameters: Betting spread, over/under, average fantasy points scoring for the top-ranked positional players of both rosters (QB1, RB1, WR1, TE1).
Once I find the 75 most similar matchups for each upcoming game, I then simulate the main slate 10,000 times by randomly choosing one of the 75 matchups for each game and then find the highest scoring QB-WR, RB-DST, QB-WR-TE and QB-RB-WR stacks on the entire simulated slate.
Every match of historical and current games is not perfect, but by matching 75 different matchups to each game and simulating 10,000 times, we can smooth out the bumps and get a strong picture of how a slate of similar games would have played out.
The last step is totaling up the number of times a particular team shows up as the top stacks for each of the three stacks projected and then dividing that number by the total simulations. That number is what I call the “Highest scoring %” on the Y-axis of the plots below labeled by team logo. Below the plots by team, I join the highest projected players that make up the stacks for that team and list their projected fantasy points and salaries for DraftKings and FanDuel.
HOW TO VIEW THE PLOTS
Each plot below has every team on the main slate positioned by the combined salary of the stack and the percentage of time that team’s stack was the highest scoring in the 10K simulations.
A way to look at them is that anything above the dashed horizontal line is a good scoring stack, and anything to the right of the dashed vertical line is a high-priced stack. You should pay most attention to the upper-right (high-scoring and high-priced) and upper-left (high-scoring and low-priced) quadrants. Ideally, you’ll find something in the upper-left that you’re confident in, but often paying up and moving into the upper-right can be beneficial.
[/am4show]
