
- Available exclusively to PFF+ members in the PFF app, the PFF Player Prop Tool harnesses the power of predictive analytics and matchup data to help you make smarter, faster and more confident picks. Download the PFF app now — available on the Apple App Store and Google Play Store.
Many NFL bettors start by looking at individual markets — like spreads, totals, teasers or props — and ask, “Which spread looks good?” or “What totals stand out this week?” This is a bottom-up approach, where you focus on specific bets first.
In this space, we’ll take a different approach. We’ll focus on one game each week and use a top-down strategy to break it down. This means starting with the bigger picture — how teams, players or trends are performing — and then finding the best ways to apply that information to different betting markets.
While some of our bets may focus on traditional markets, like spreads or totals, we’ll often explore other opportunities to maximize value.

Dallas Cowboys -6.5 (+230 on FanDuel)
As always, we’ll start with team fundamentals to set the stage for our analysis. The chart below from PFF's Timo Riske offers one perspective, but whichever metric you choose to measure team performance through two weeks, the story remains the same.
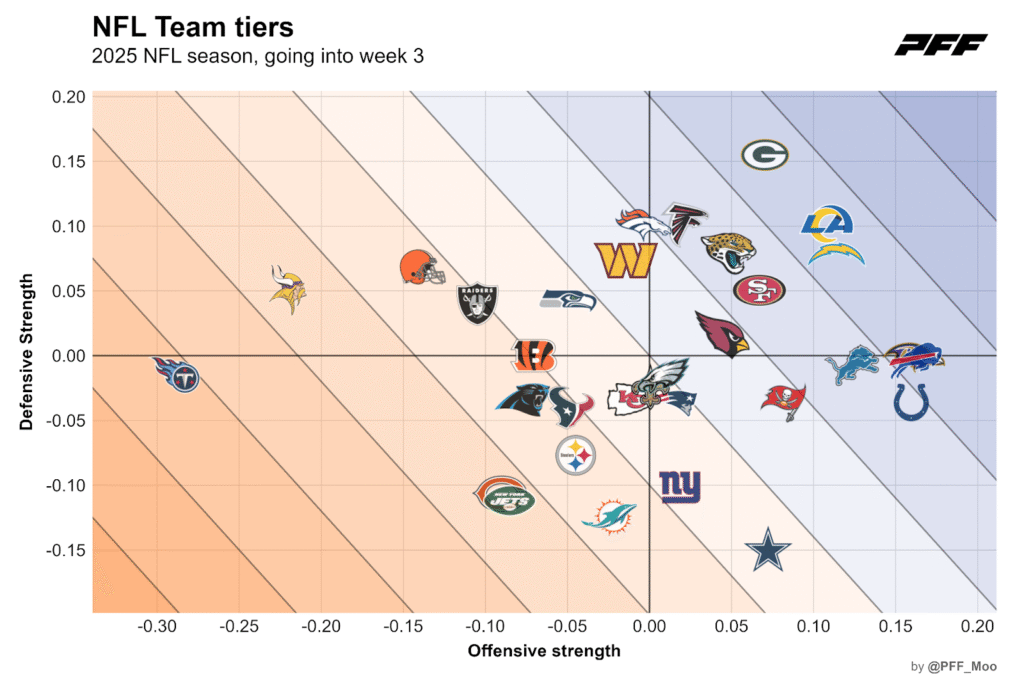
We start with two offenses headed in opposite directions: Dallas has been one of the league’s best, while Chicago ranks near the bottom. On defense, both teams have been equally underwhelming.
Of course, it's still early — just two games — and we shouldn’t overreact, but the numbers offer fresh context to layer onto our preseason priors. The goal here is to balance what we believed coming into the year with what’s now unfolding on the field, and to assess where team performance may actually be sustainable.
Across the board, Dak Prescott and the Cowboys' passing game have been excellent — and it is not just because of weak opponents. Prescott is up to 0.18 EPA per play this season, a sharp rise from -0.04 in 2024. His raw PFF grade has jumped from 0.2 to 0.13, currently the third-best among quarterbacks. His accuracy rate has climbed from 37.7% to 55%, and his “system-play rate” is up from 63% to 68%. Most notably, plays within structure are producing 0.34 EPA per play, up from 0.0 a year ago.
No matter how you slice it, the early returns are vastly improved. The question now: how much of it is sticky?
The Cowboys brought in Klayton Adams as offensive coordinator this offseason, and his impact on the run game has been immediate. Dallas currently leads the NFL in rushing success rate, while Arizona — Adams’ former team — has struggled on the ground without him. A strong run game is valuable in its own right, but it also sets up more favorable passing situations. It’s no coincidence that Prescott’s in-structure rate is up alongside the improved rushing efficiency.
Dallas also revamped its receiving corps by adding George Pickens, which has drastically changed the passing game. The Cowboys ranked dead last in separation rate last season but have climbed to 16th through two games. They’ve also forced coverage mistakes at a rate nearly 12% higher than last year.
With better scheming and upgraded personnel, Prescott is no longer working uphill, and the results so far reflect that.
This isn’t a fluke; it’s structural.
Matchup Angles
While Prescott may be hitting close to his ceiling through two games, this doesn’t look like the spot where regression sets in. Chicago’s defense has been abysmal to start the season—and that’s a continuation of what we saw over the back half of last year.
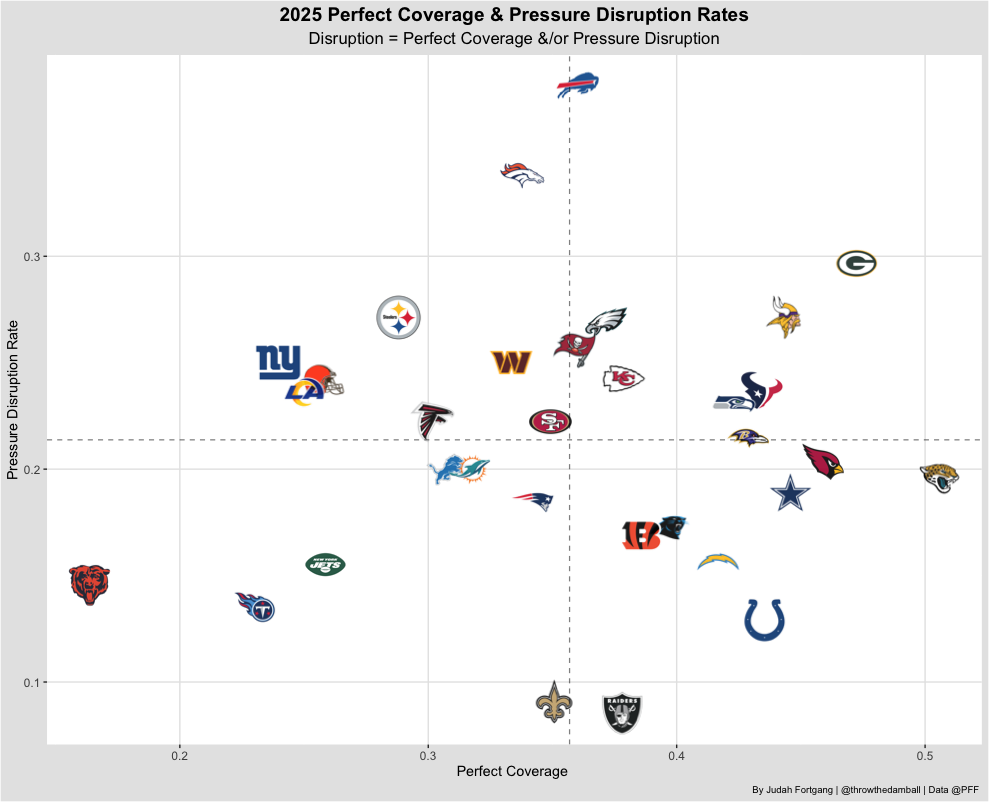
The chart above illustrates how much disruption a defense creates — whether through “perfect coverage” or by generating pressure that prevents quarterbacks from progressing through their reads. The Bears rank dead last in disruption and grade poorly in both categories. And the situation is only getting worse: with Jaylon Johnson sidelined, they’re now starting three cornerbacks, none of whom have posted a single-season PFF grade above 60.0.
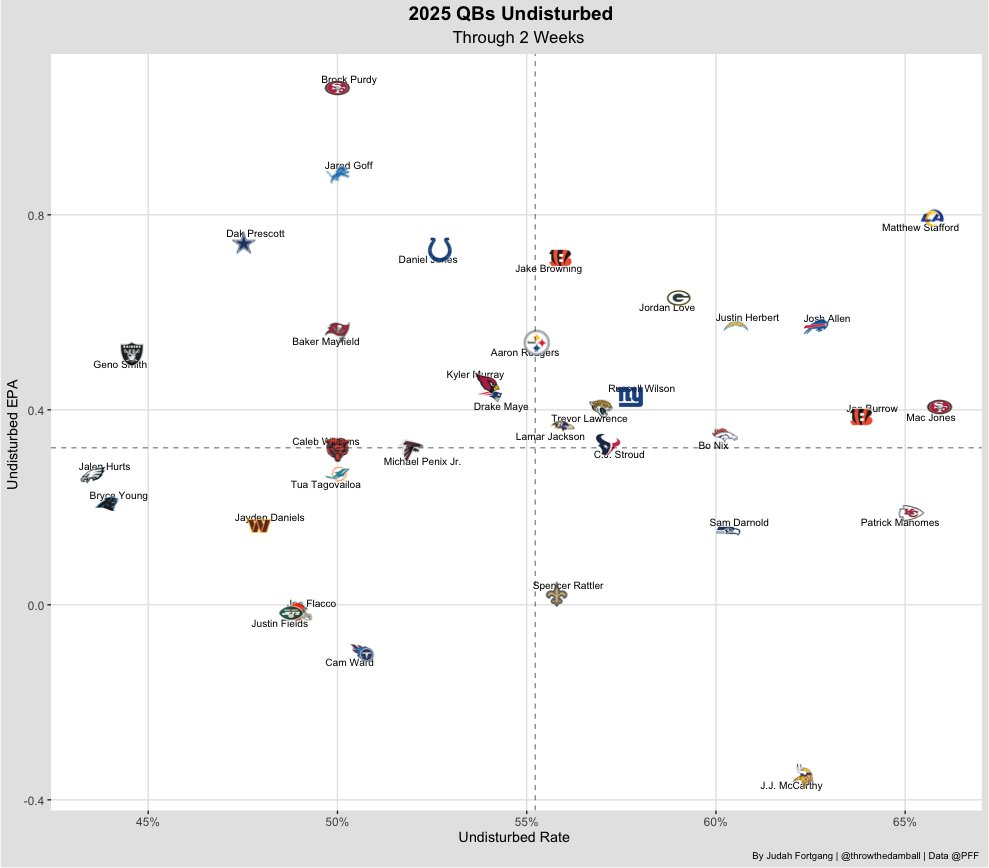
While the sample is still small, Prescott has been dominant when kept clean, and he should see more undisturbed dropbacks in this matchup than he did over the first two weeks. At a clip of 0.8 EPA per clean play, even three to four additional undisturbed snaps could swing the outcome.
The Cowboys should have no trouble moving the ball and putting up points against this Bears defense. On the other side, I’m less confident in Chicago’s ability to fully exploit Dallas’ defensive vulnerabilities.
The chart below illustrates the rate at which quarterbacks create plays versus how often they destroy them.
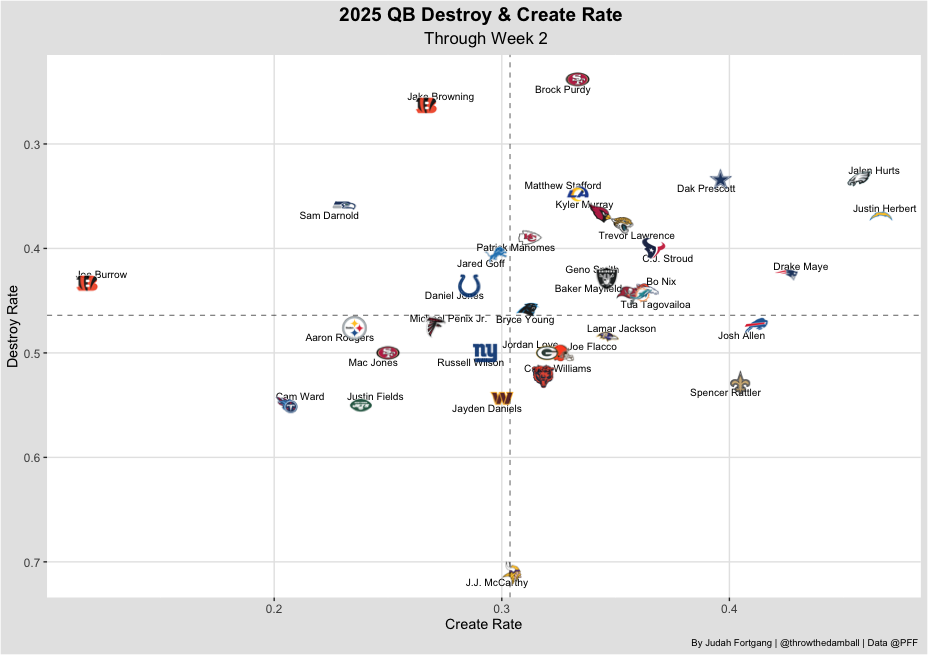
“Destroy rate” refers to plays where there’s no defensive disruptor, yet the quarterback tanks the play — either through an inaccurate throw, taking a sack or scrambling into a negative expected outcome.
Caleb Williams ranked bottom-five in this category last season, and early returns suggest he’s trending in the same direction. That raises concerns about his ability to succeed even in favorable matchups.
He also led the league last year in pressure created by the quarterback himself, and with his time to throw increasing by 0.2 seconds this season, he appears headed for a repeat. If that trend holds, Williams may once again struggle to take full advantage of advantageous situations.