This article will be a weekly statistical review of all NFL teams during the 2023 season.
For more statistics, snap counts and PFF grades from the 2023 NFL season, check out PFF Premium Stats.
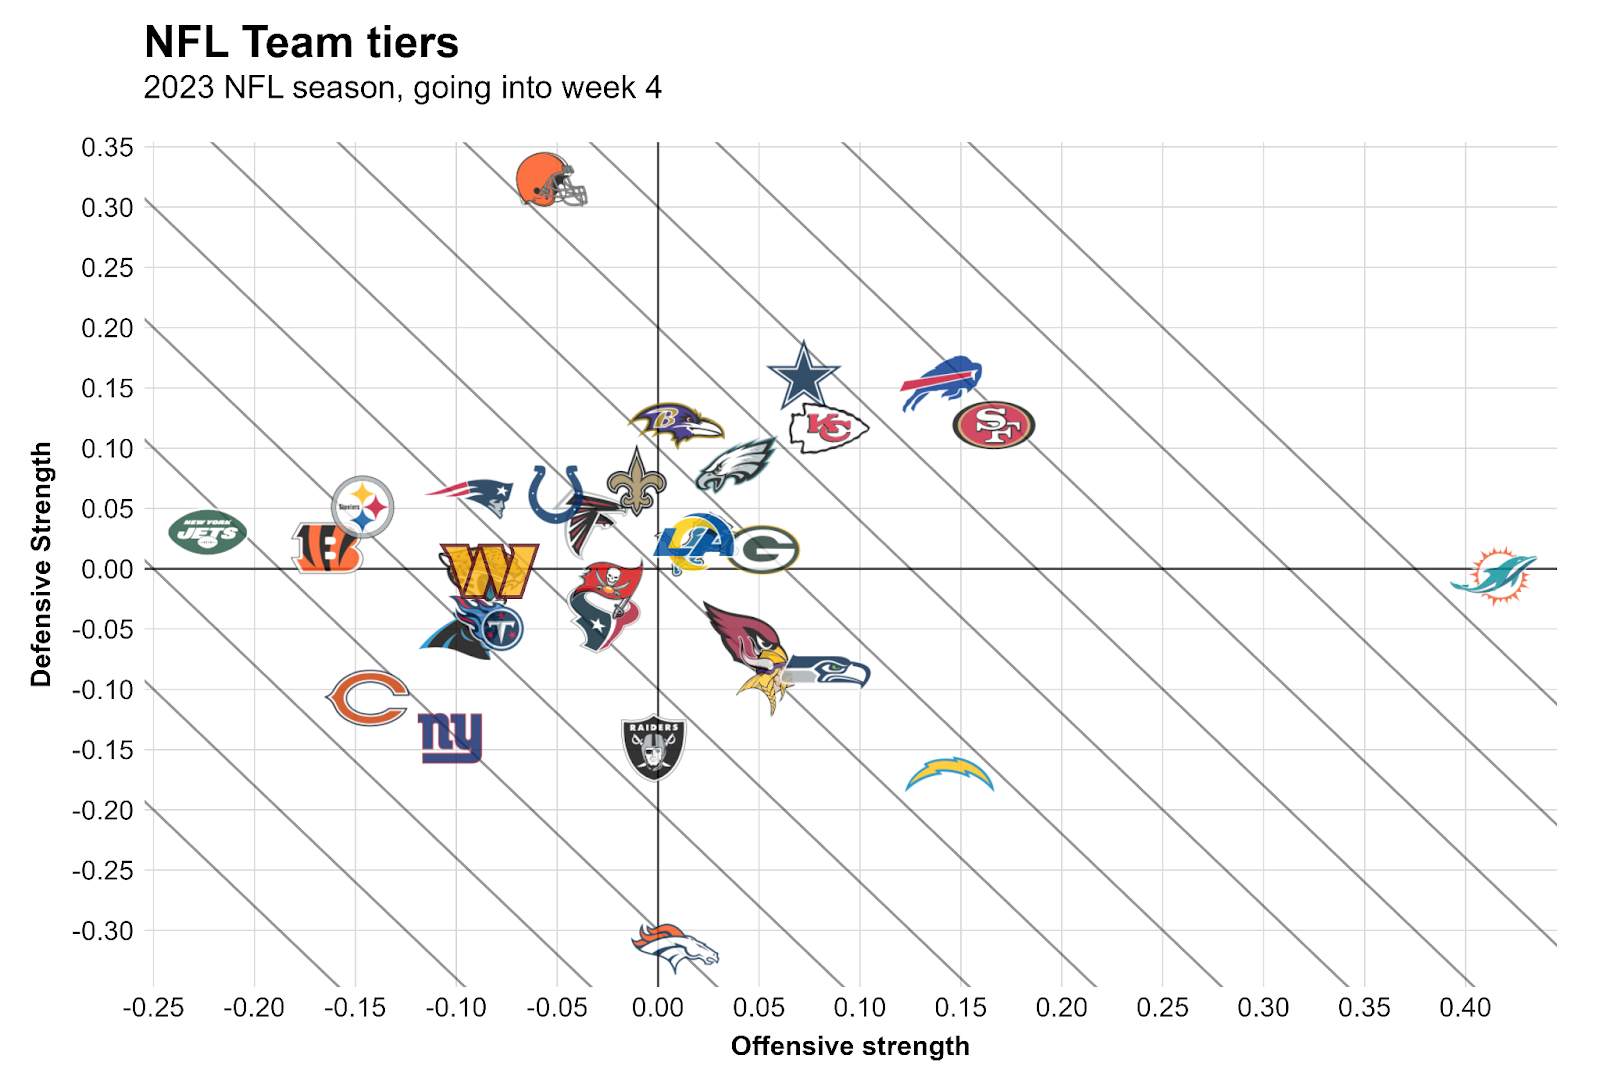
Team Strengths
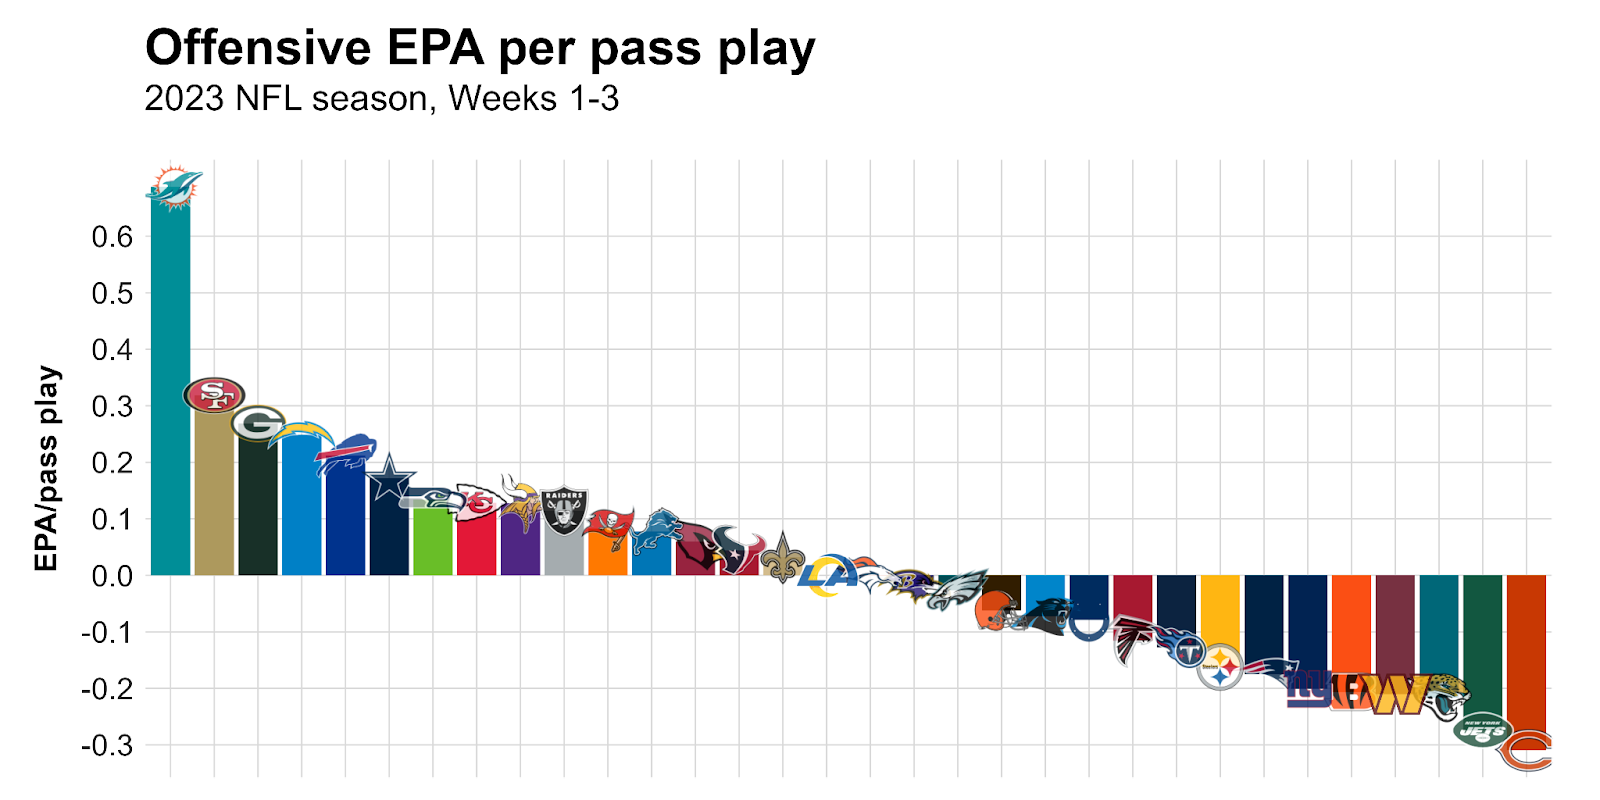
The following chart shows how well teams have played in terms of expected points added per play. To improve predictive power, high-leverage plays such as turnovers and goal-line plays are down-weighted a bit.
Starting next week, this chart will be opponent-adjusted.
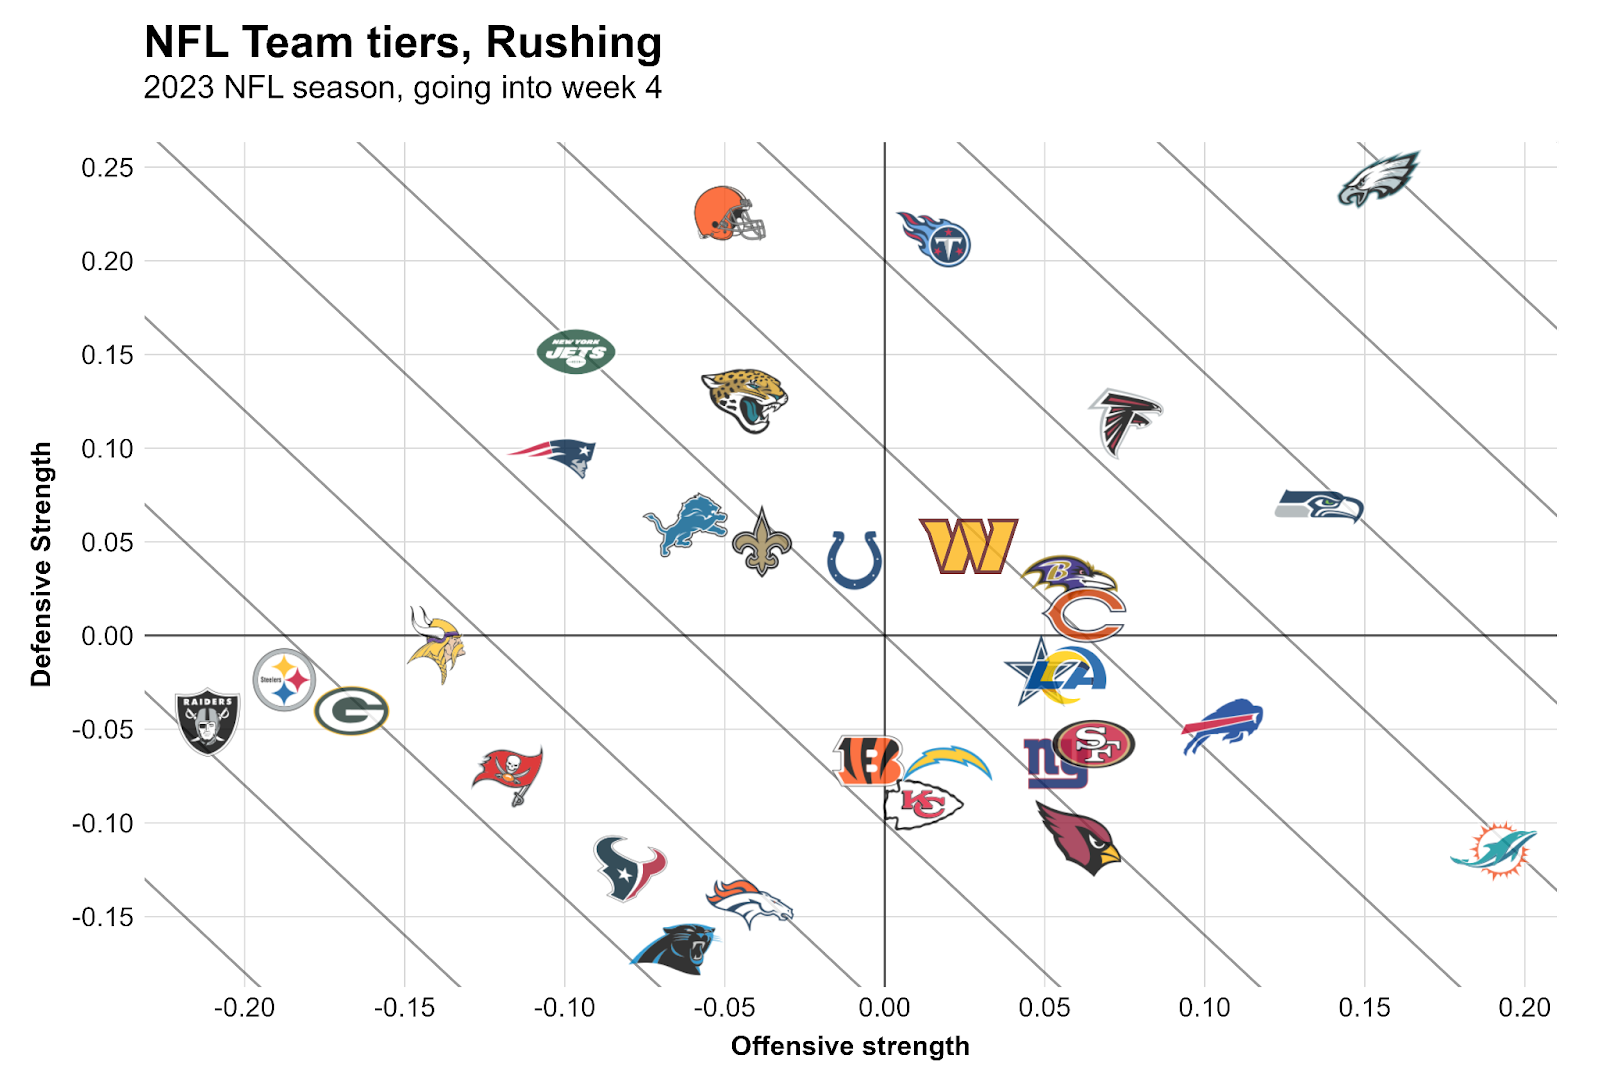
We will also separate the teams by rushing and passing efficiency. The following chart shows rushing efficiency:
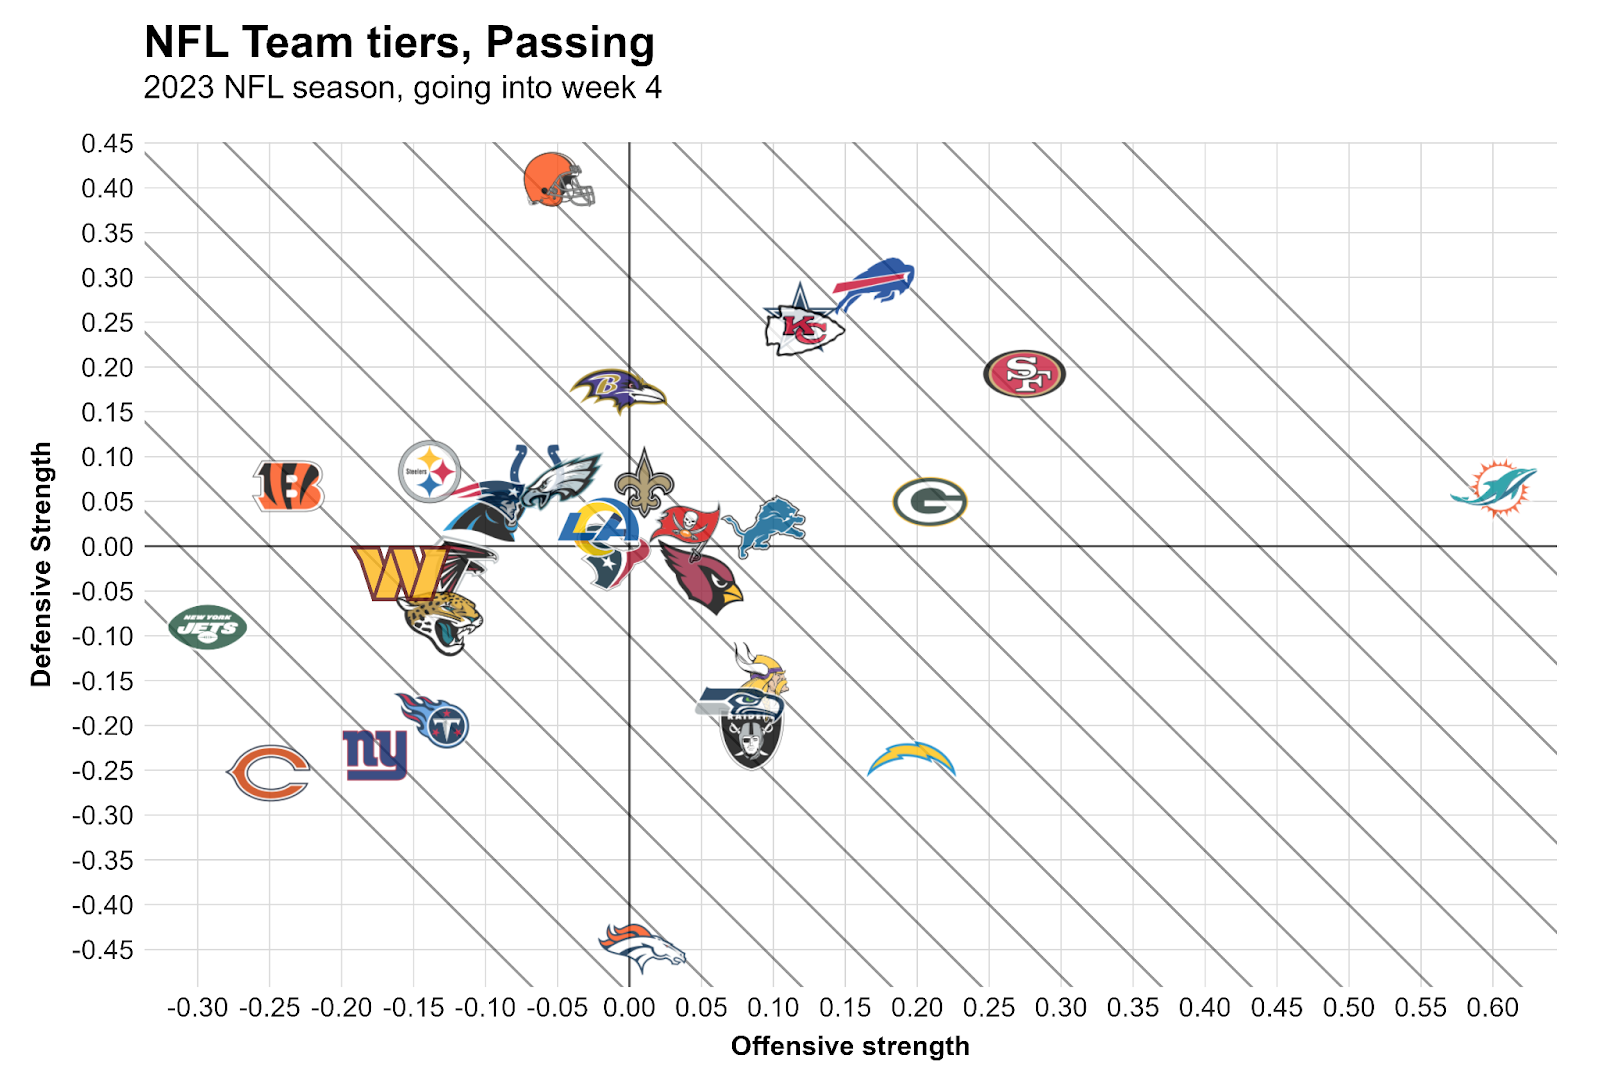
Here is the passing efficiency of each team:
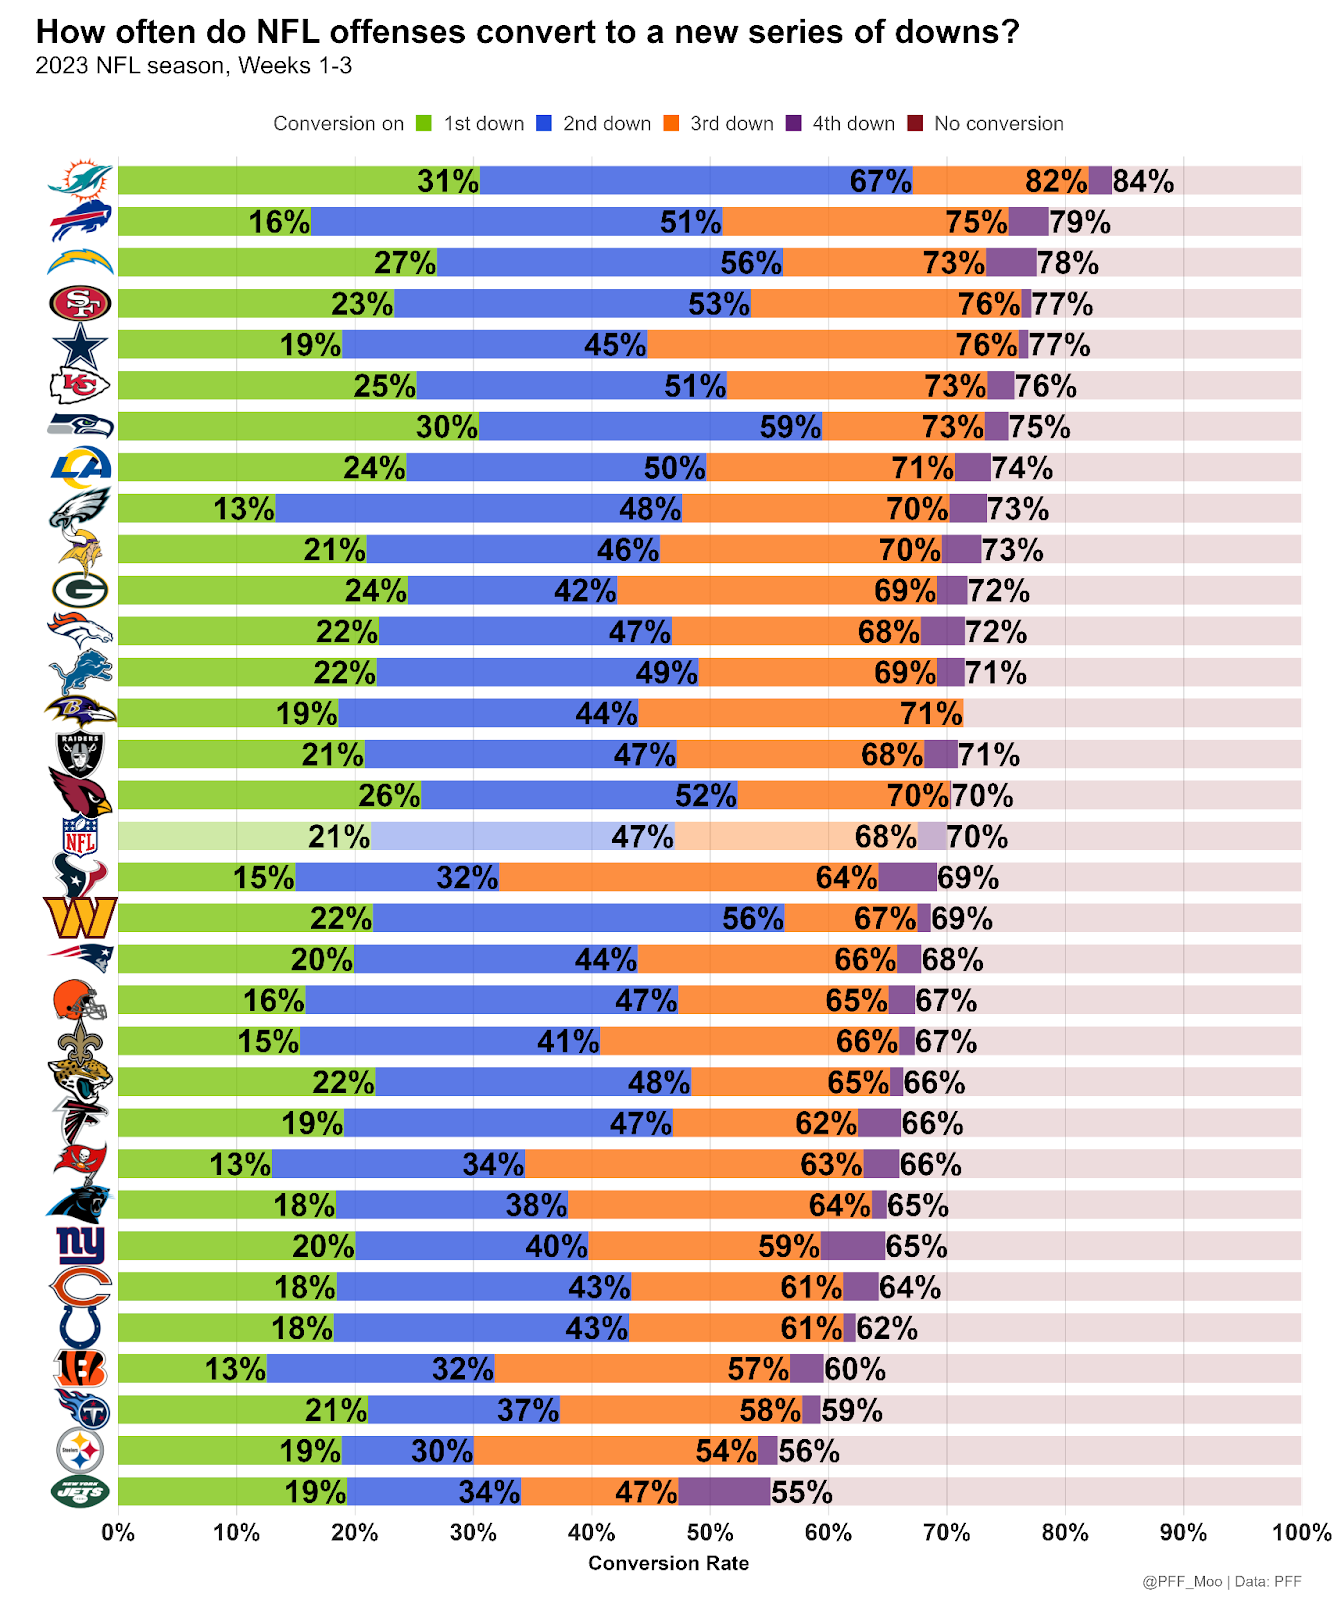
Moving the sticks
The following chart shows how often teams move the sticks — that is, convert a series of downs to a new series of downs. For example, the Miami Dolphins have moved the sticks on first down 31% of the time. They have moved the sticks on the first two downs 67% of the time. After three downs, they have moved the sticks 82% of the time. In total (that is using all four downs), they have moved the sticks 84% of the time.
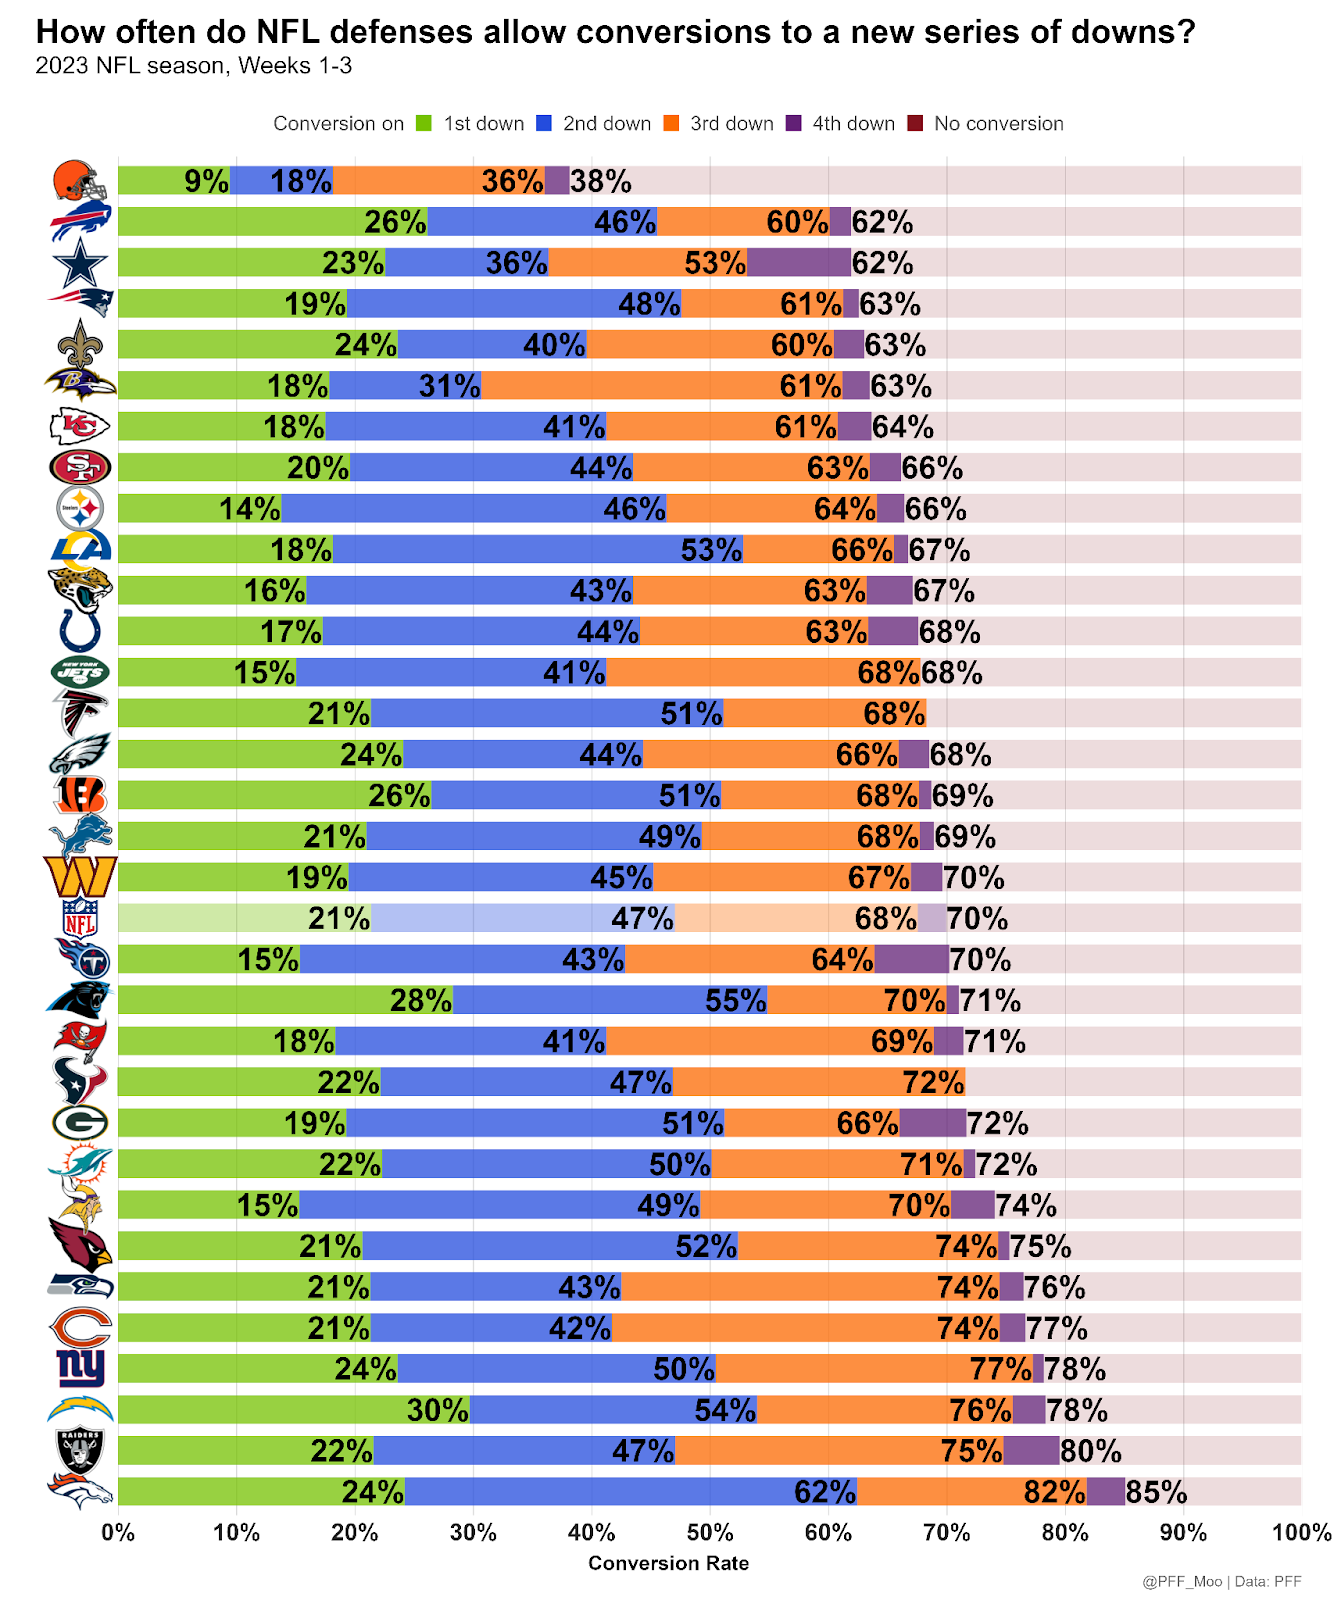
Here is the same chart for the other side of the ball, which shows a dominant Cleveland Browns defense:
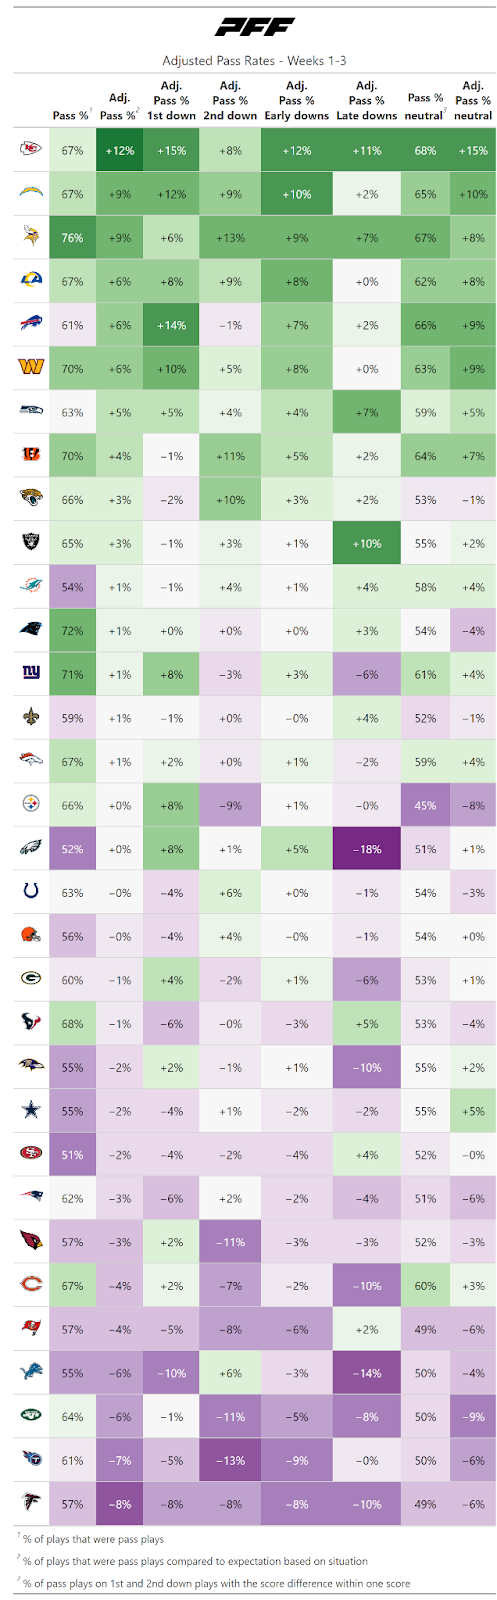
Pass rates
The following table shows how often teams drop back to pass, adjusted for down, distance and the current score.
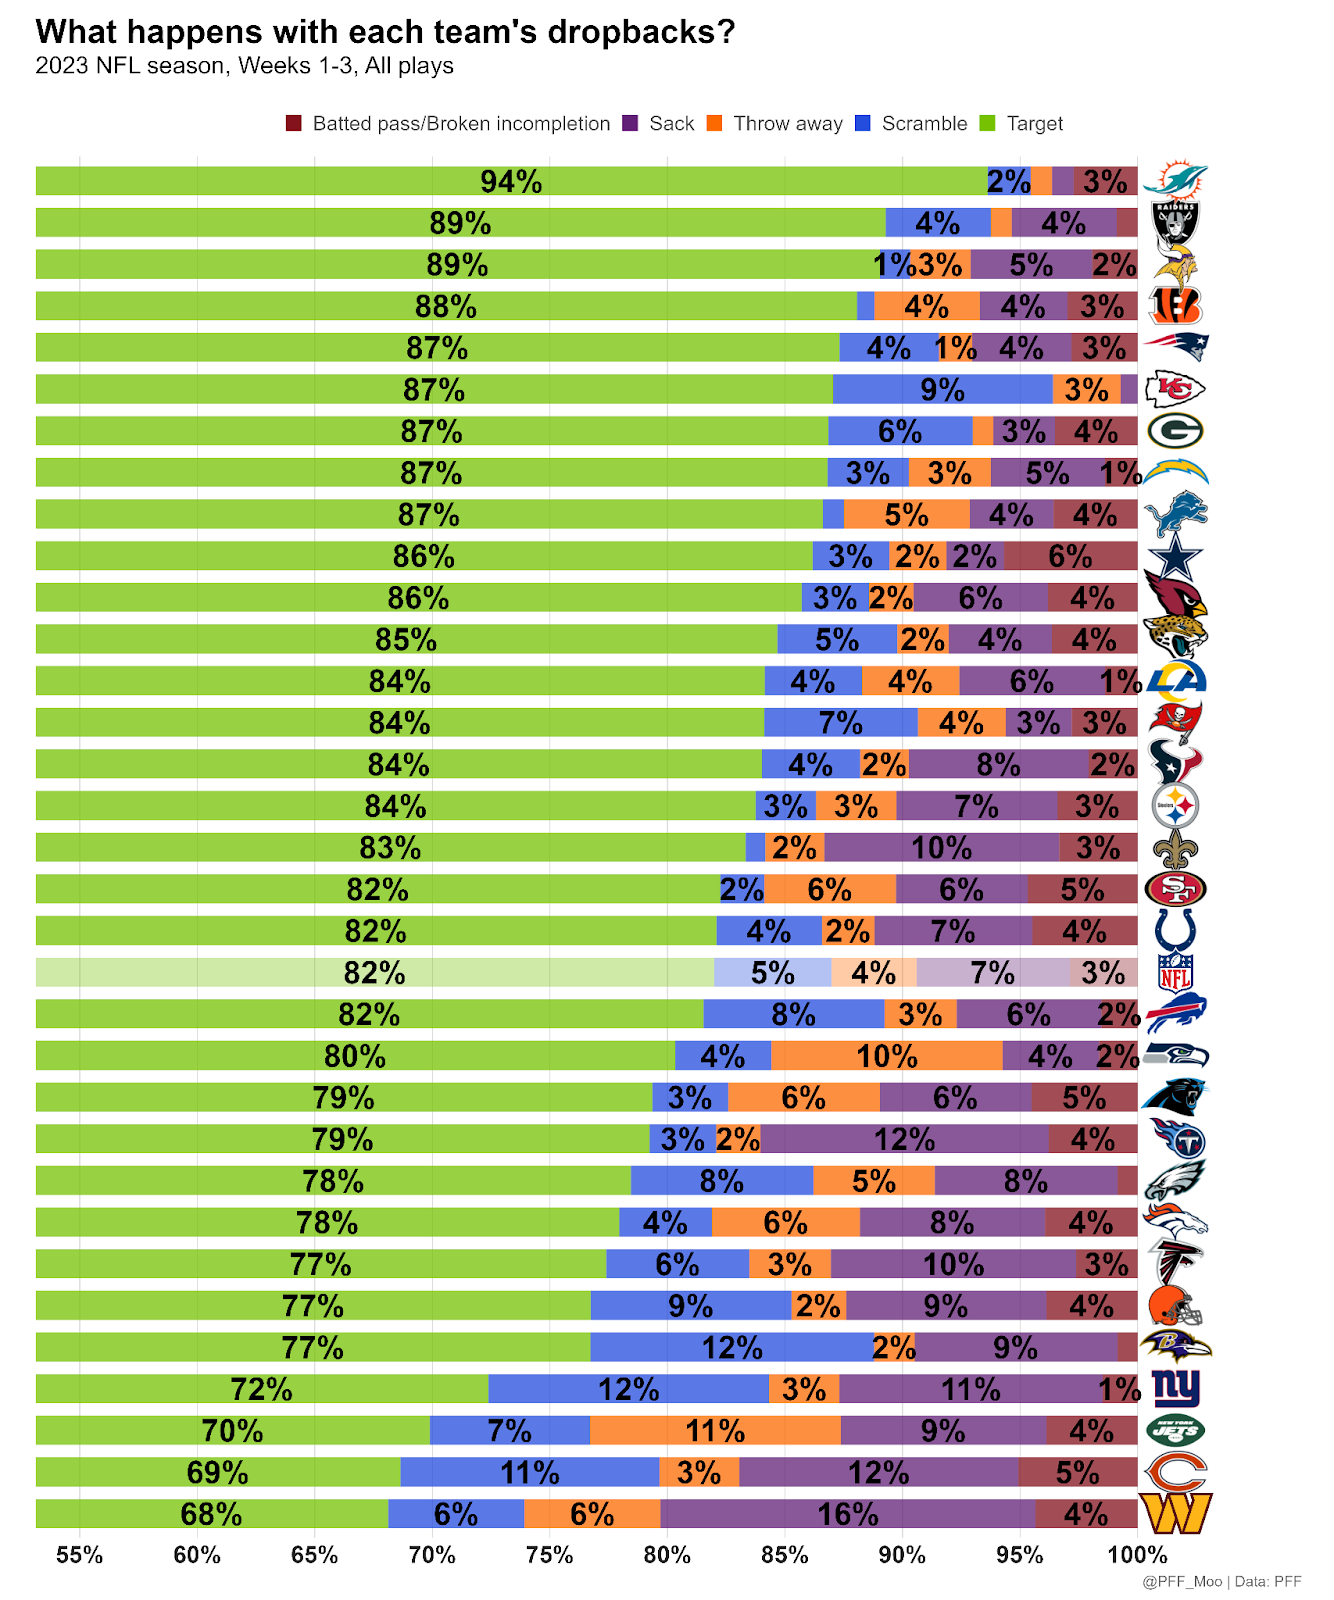
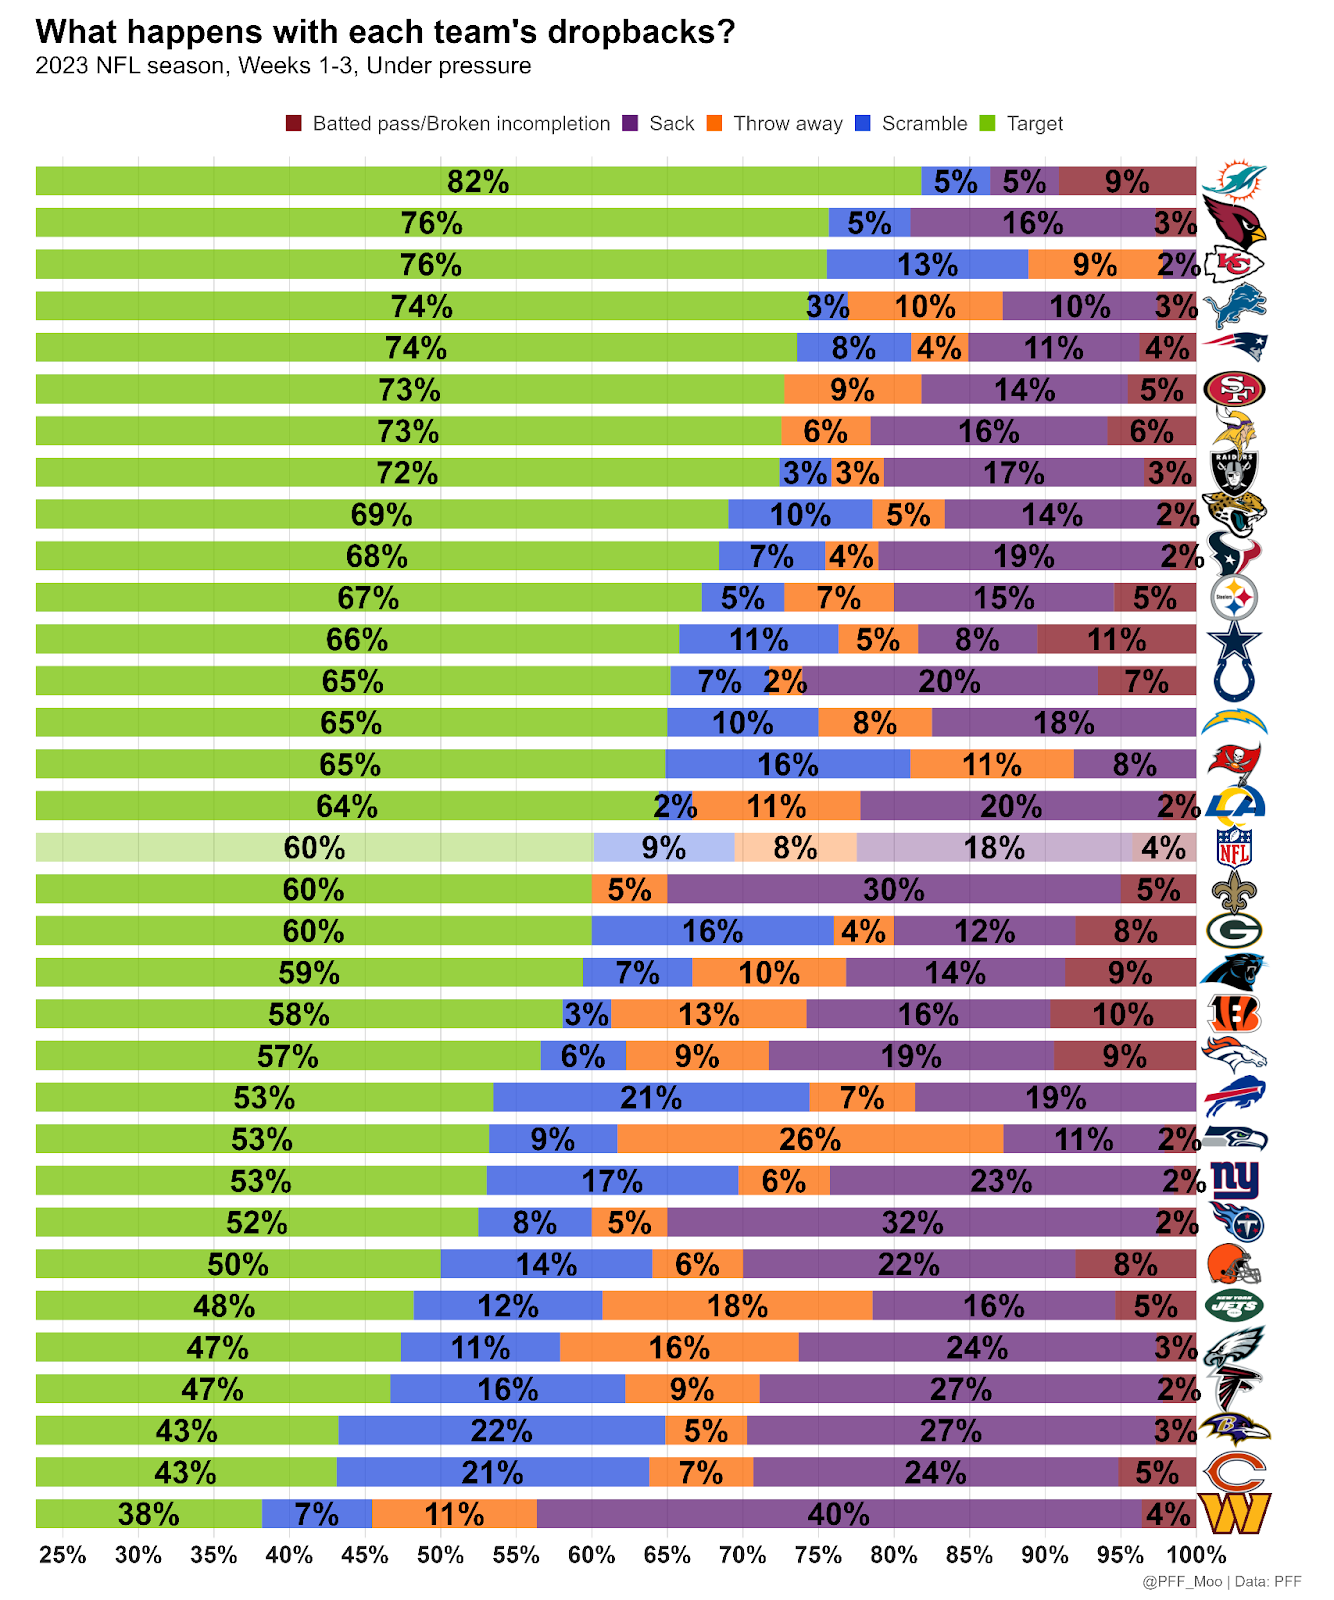
Dropback outcomes
With passing targets being the most efficient outcome of a dropback on average, just getting a throw off more often than others can already be an important indicator of a good offense. There are notable exceptions for teams with mobile quarterbacks, but teams mostly want to have a large green bar (targets) and a small purple (sacks) bar in the chart below.
Here is the same chart for when the quarterback is under pressure:
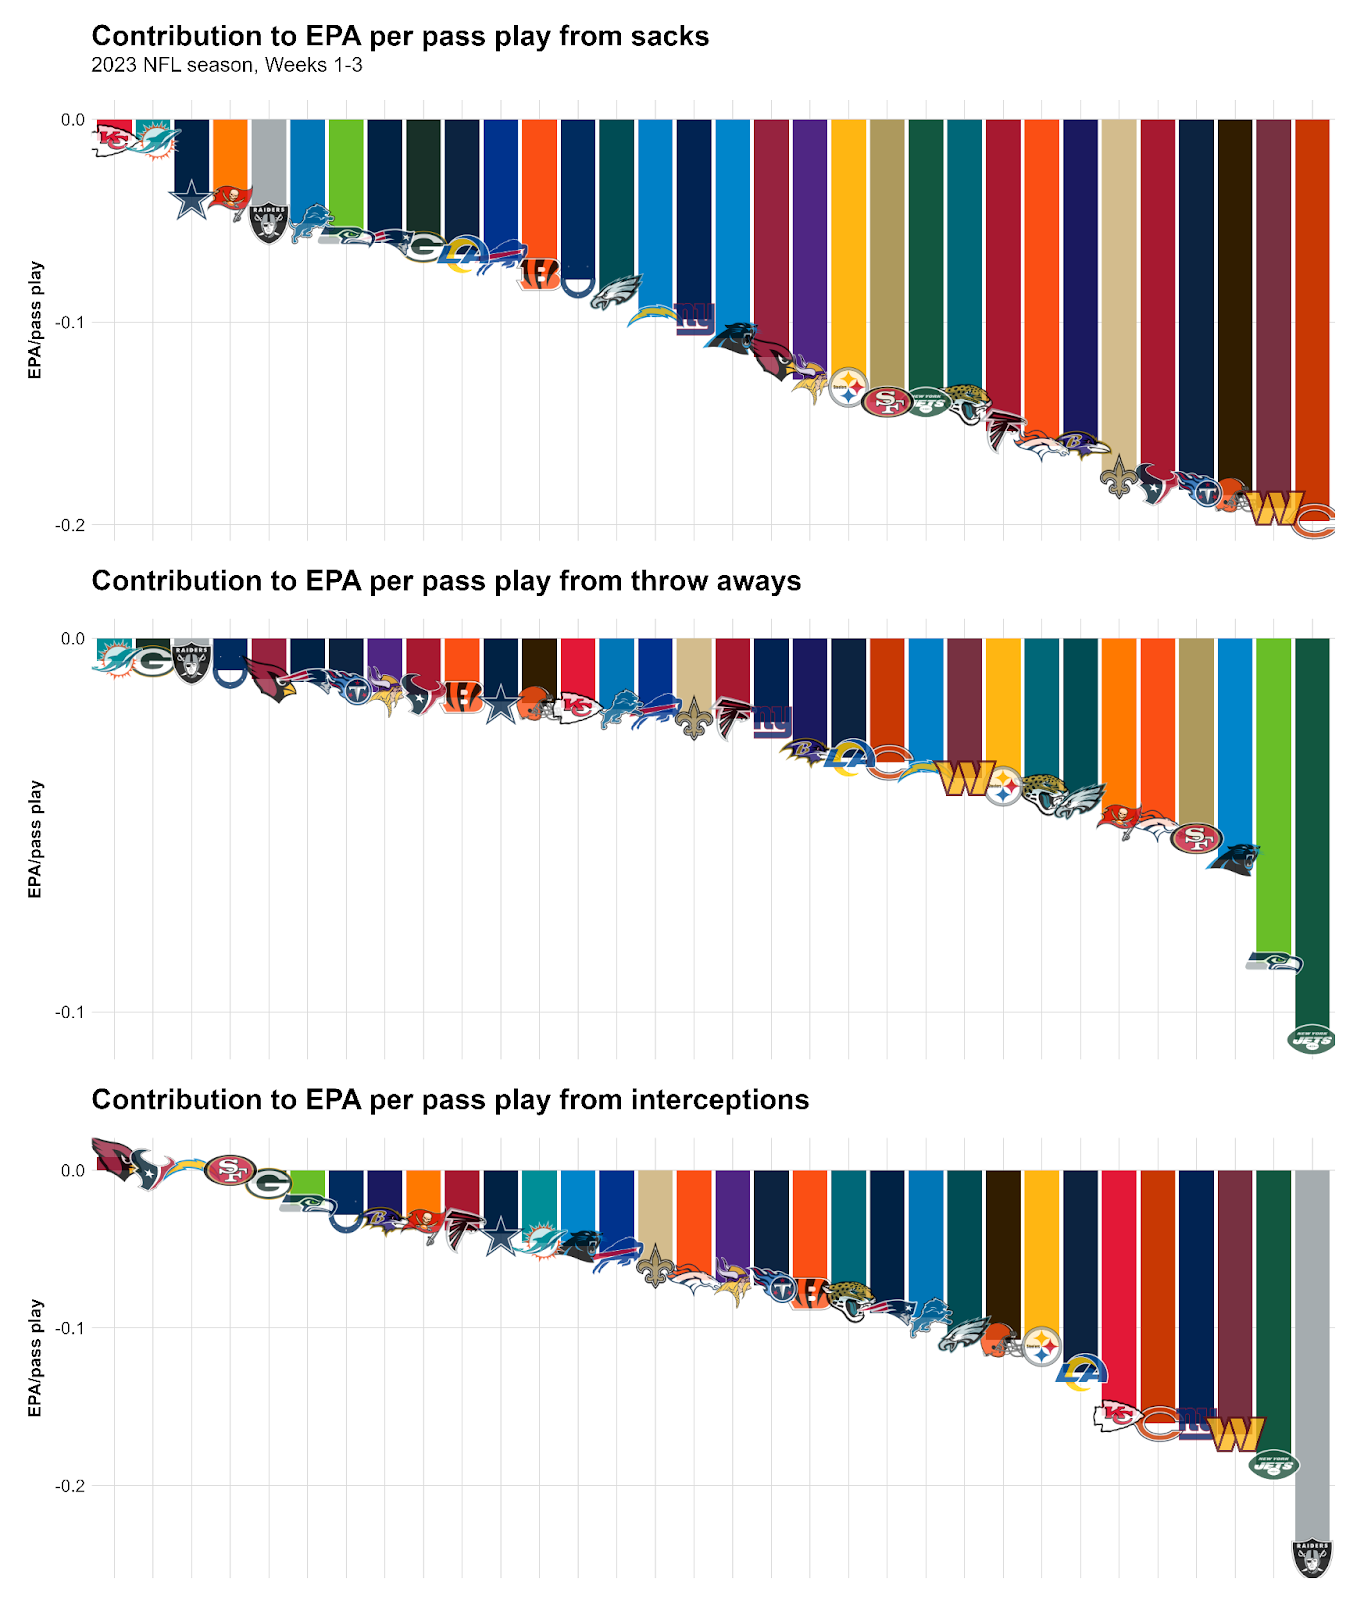
We also want to look at the contribution of each dropback outcome to the overall passing efficiency of each team.
Here is how much negative outcomes (sacks, throwaways and interceptions) contribute to each team’s total EPA per pass play numbers:
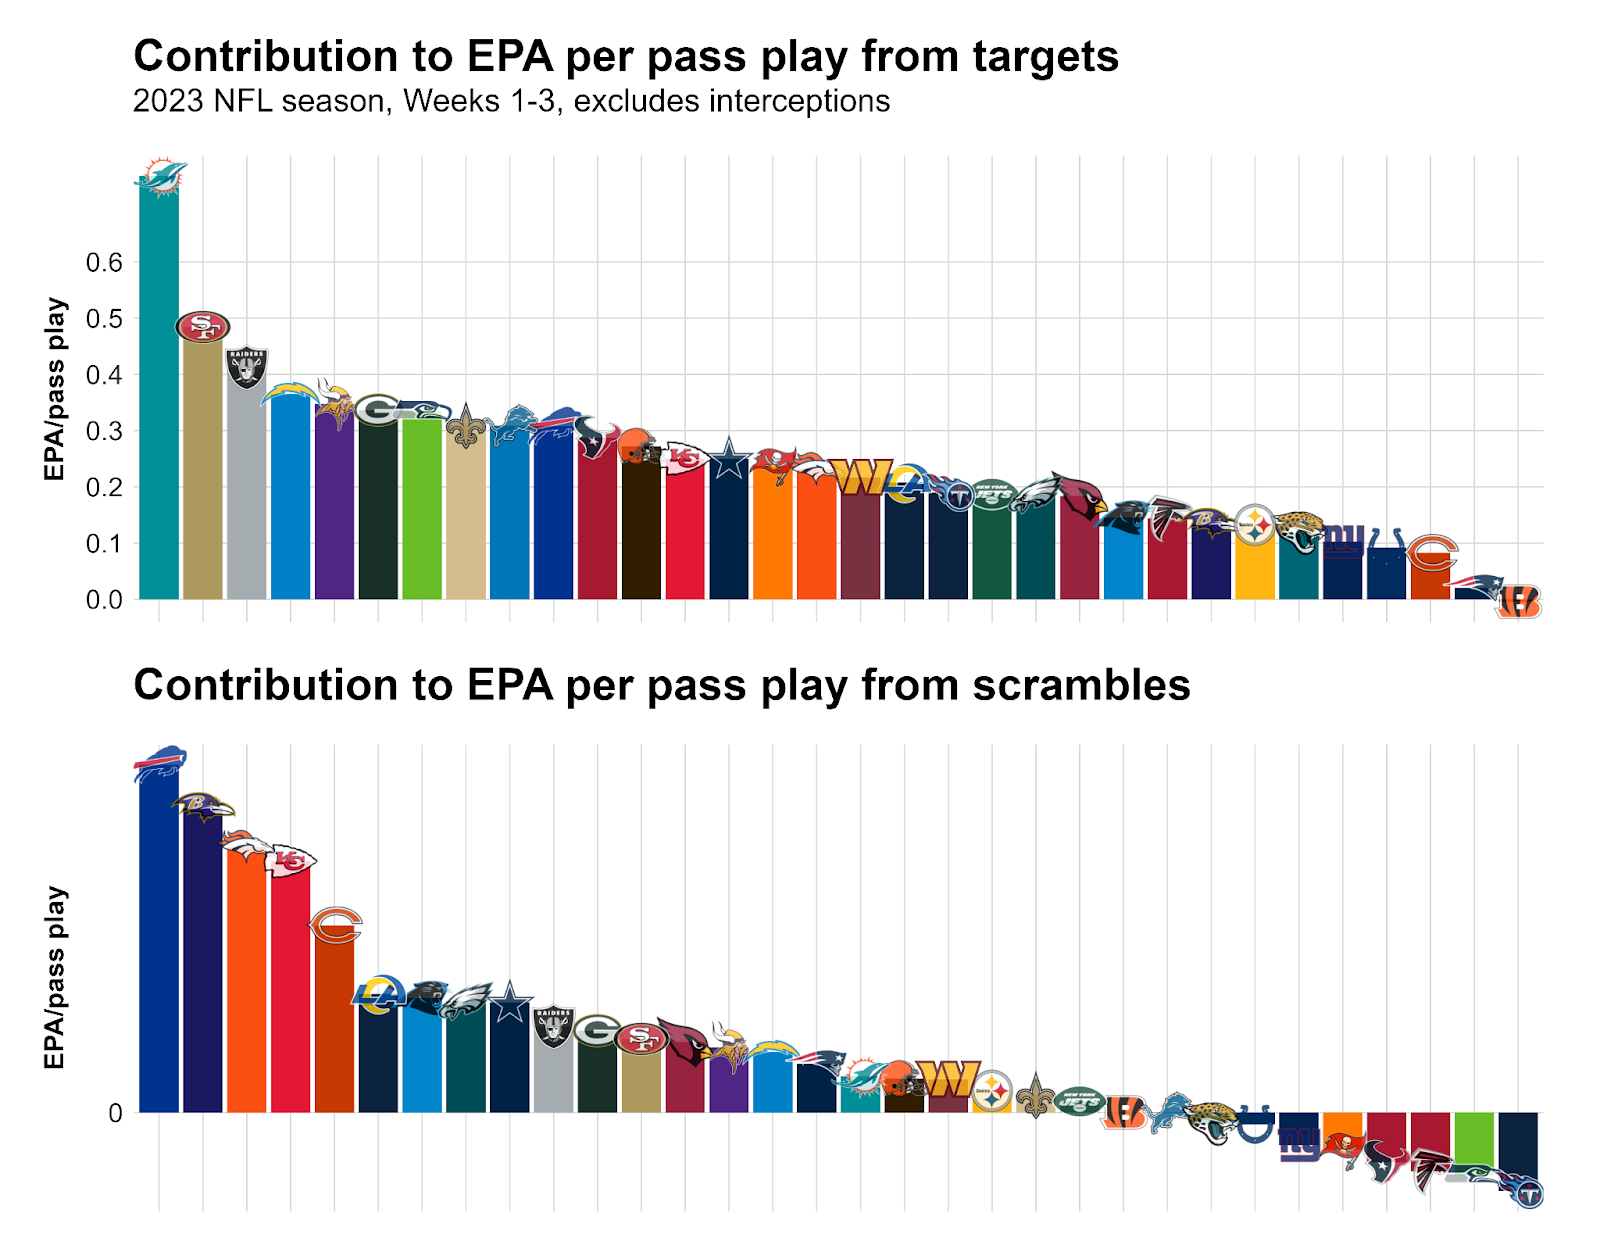
Here is how the mostly positive outcomes (targeted passes that aren’t intercepted and scrambles) contribute to each team’s passing efficiency:
As an overall summary, here is each NFL team's passing efficiency: