This article will be a weekly statistical review of all NFL teams during the 2023 season.
For more statistics, snap counts and PFF grades from the 2023 NFL season, check out PFF Premium Stats.

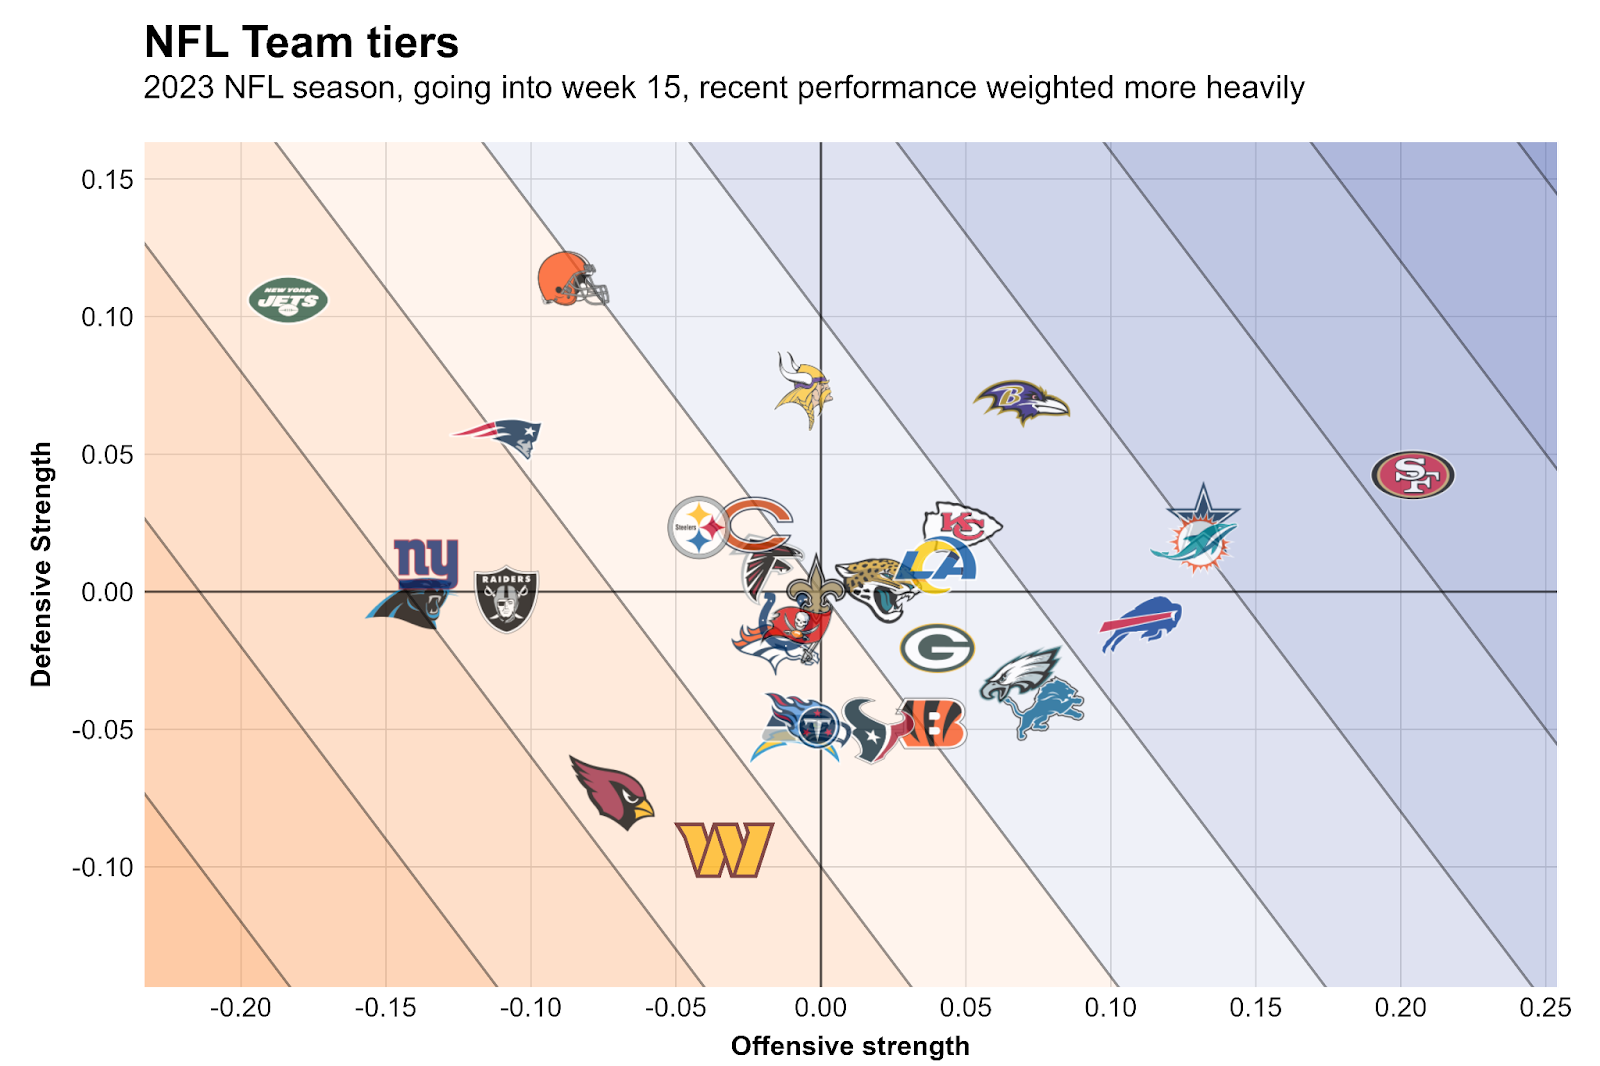
Team Strengths
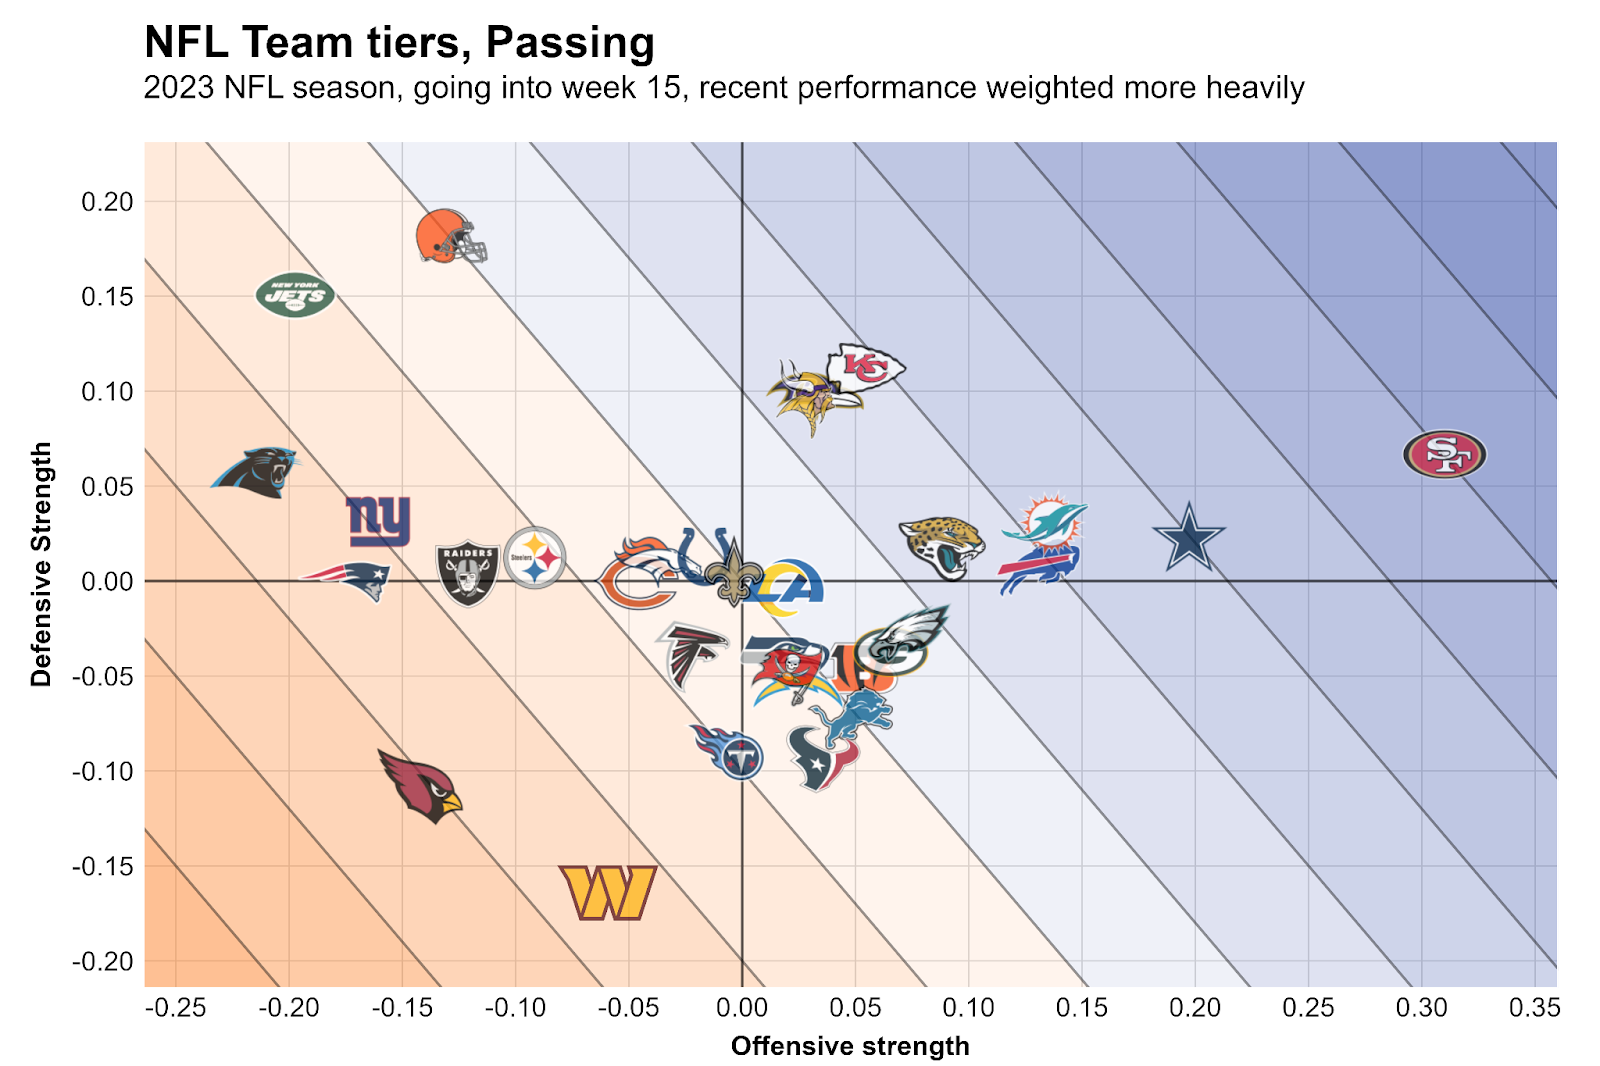
The following chart shows how well NFL teams have played this season in terms of expected points added per play. To improve predictive power, high-leverage plays such as turnovers and goal-line plays are down-weighted a bit. Additionally, the team strengths account for opponents faced. Recent performance counts more toward the estimated team strength than performance earlier in the season.
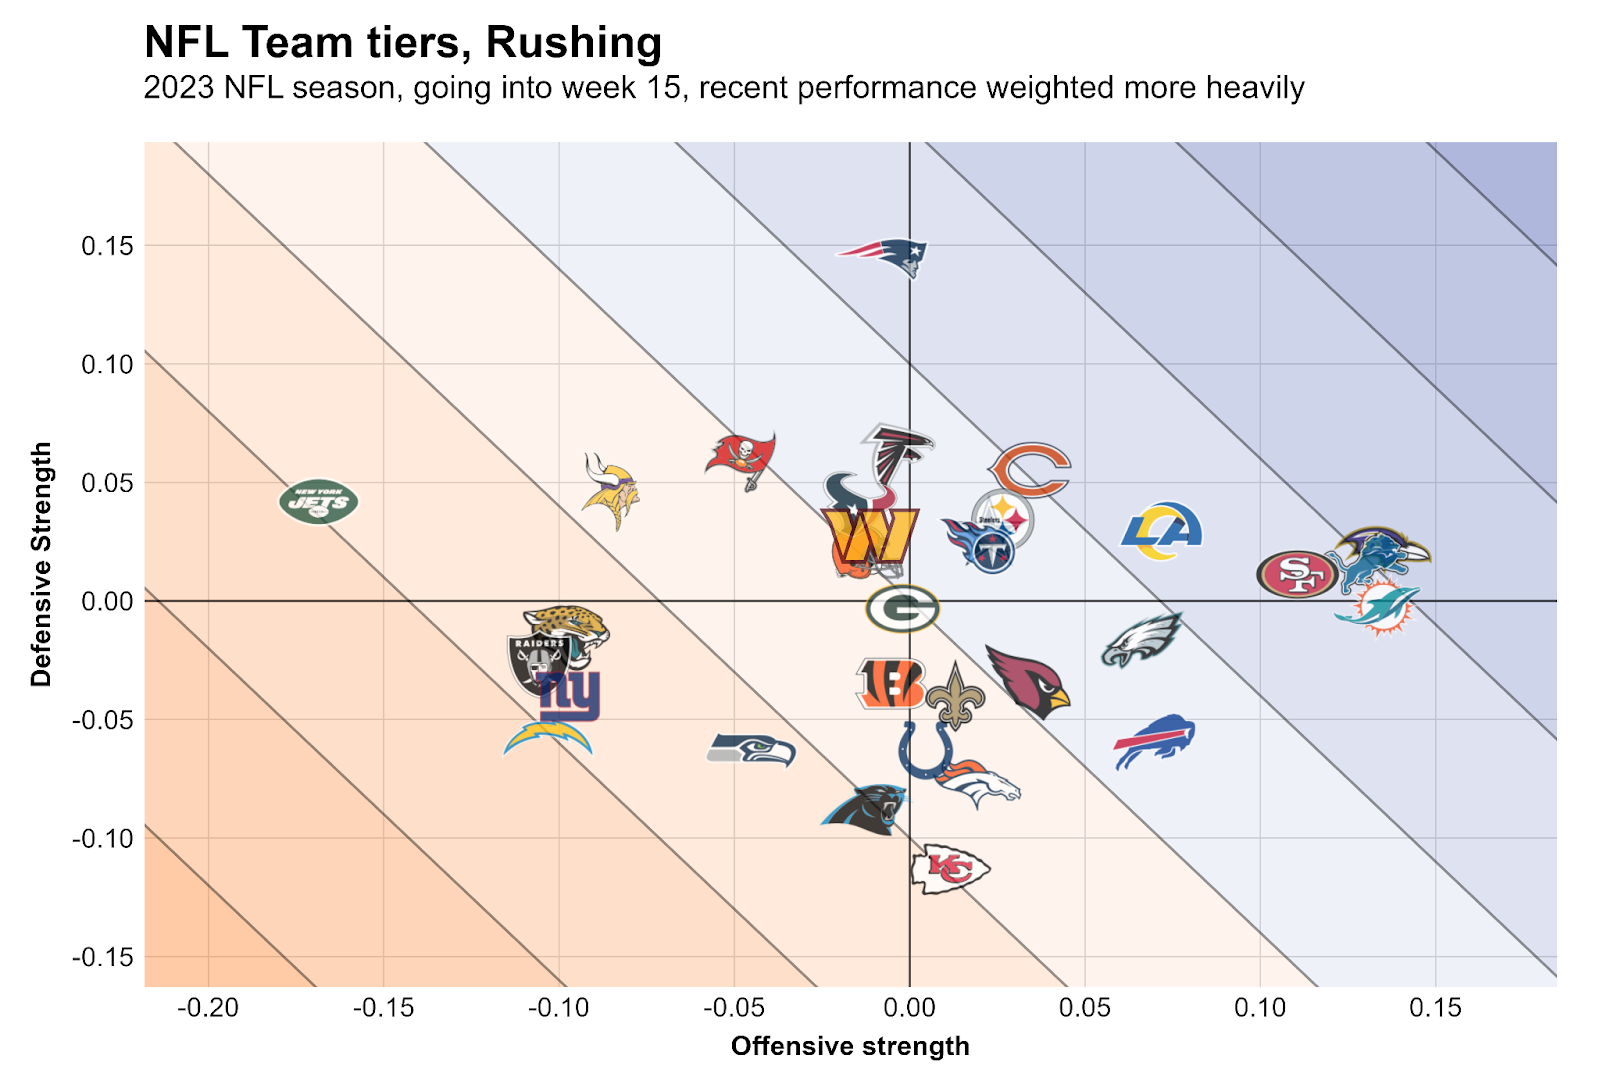
We will also separate the teams by rushing and passing efficiency. The following chart shows rushing efficiency:
Here is the passing efficiency of each team:
Strength of Schedule
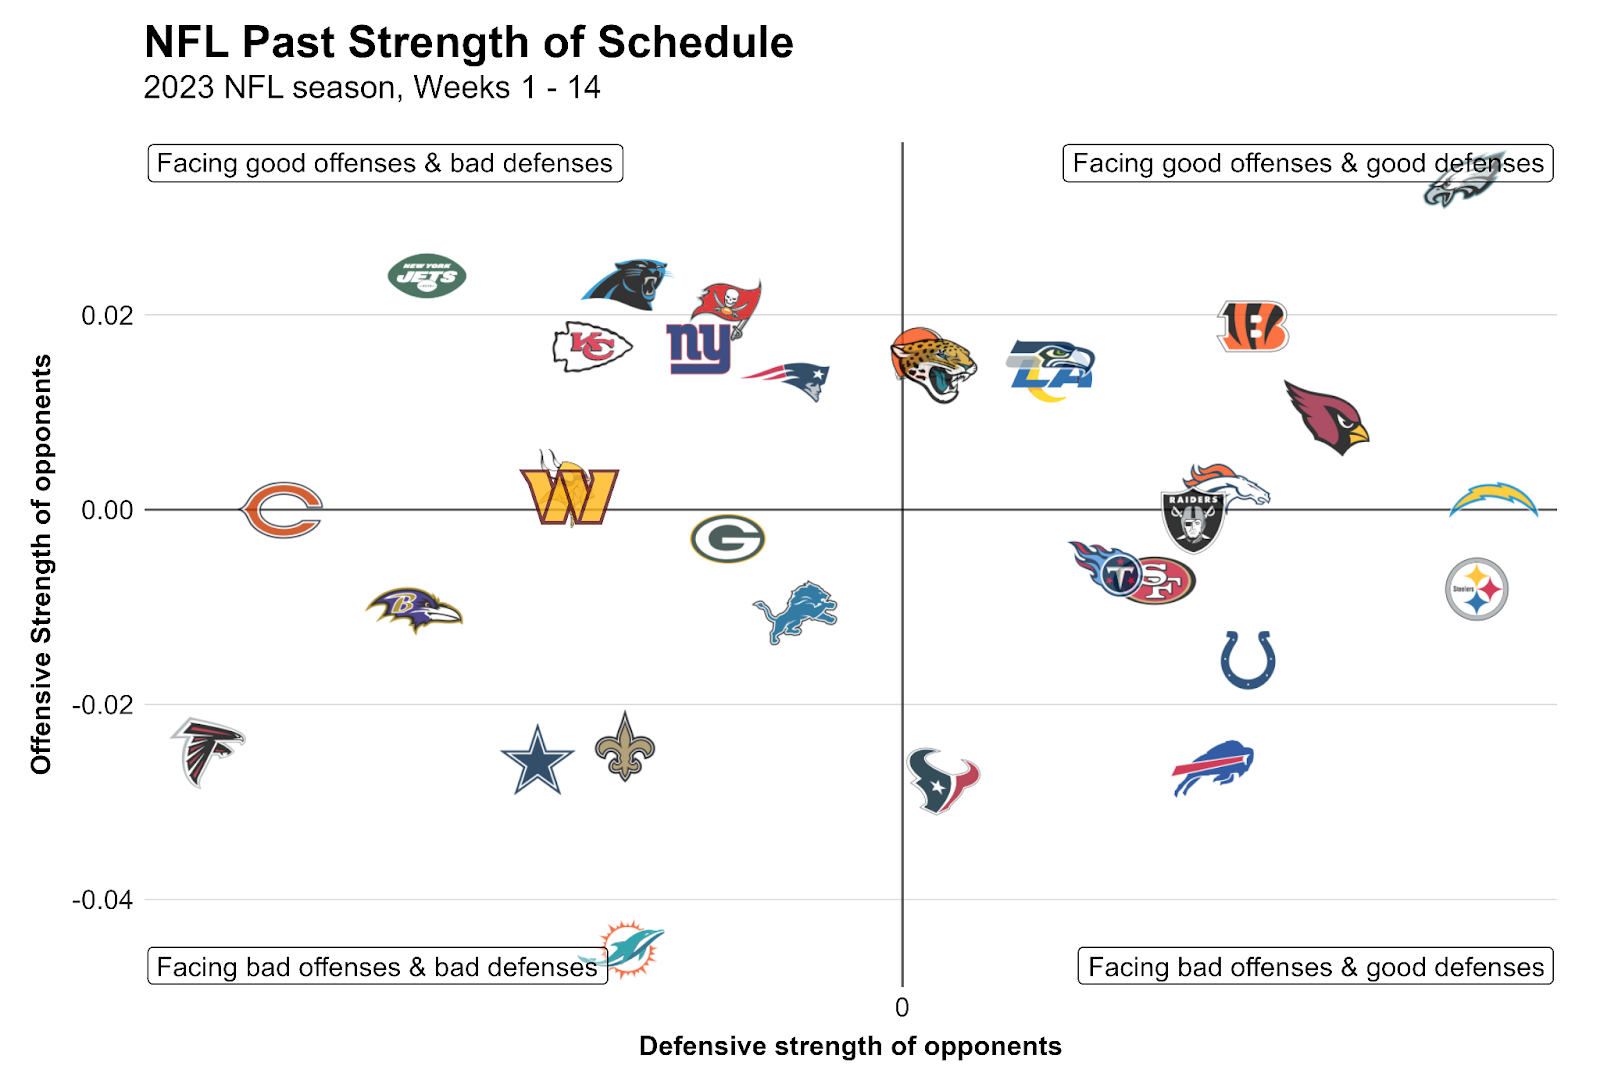
Based on the team strengths shown above, here is the past strength of schedule of all NFL teams:
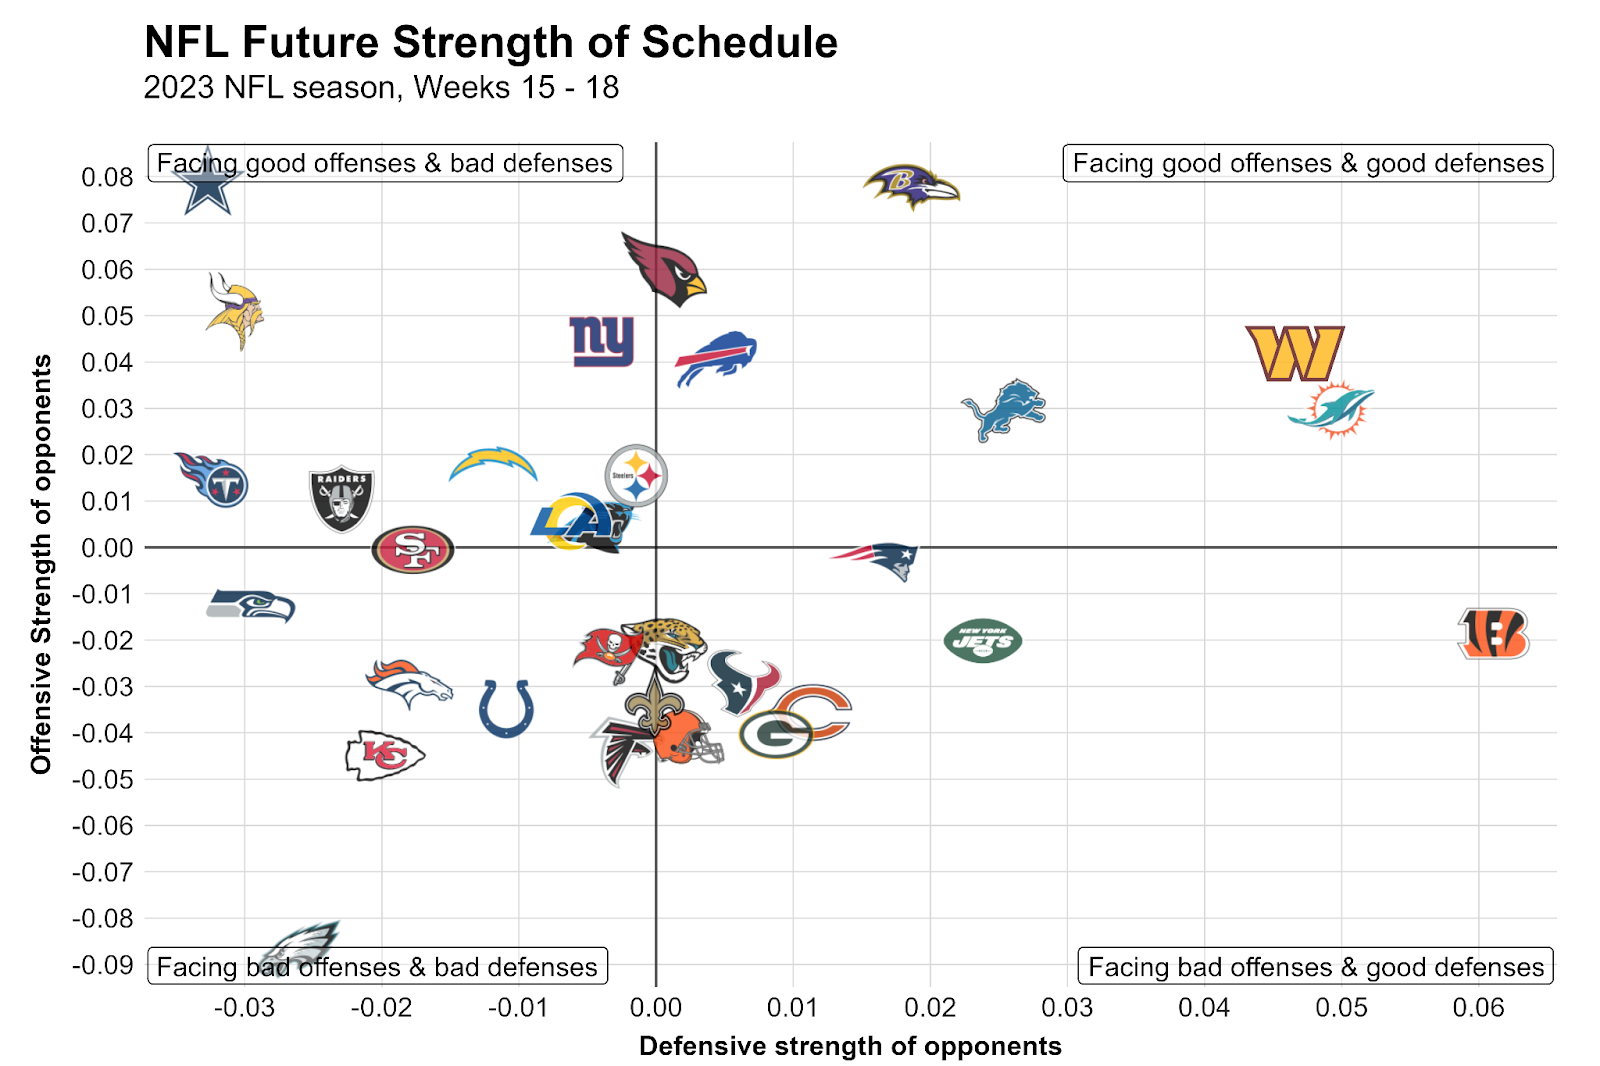
And here is the future strength of schedule:
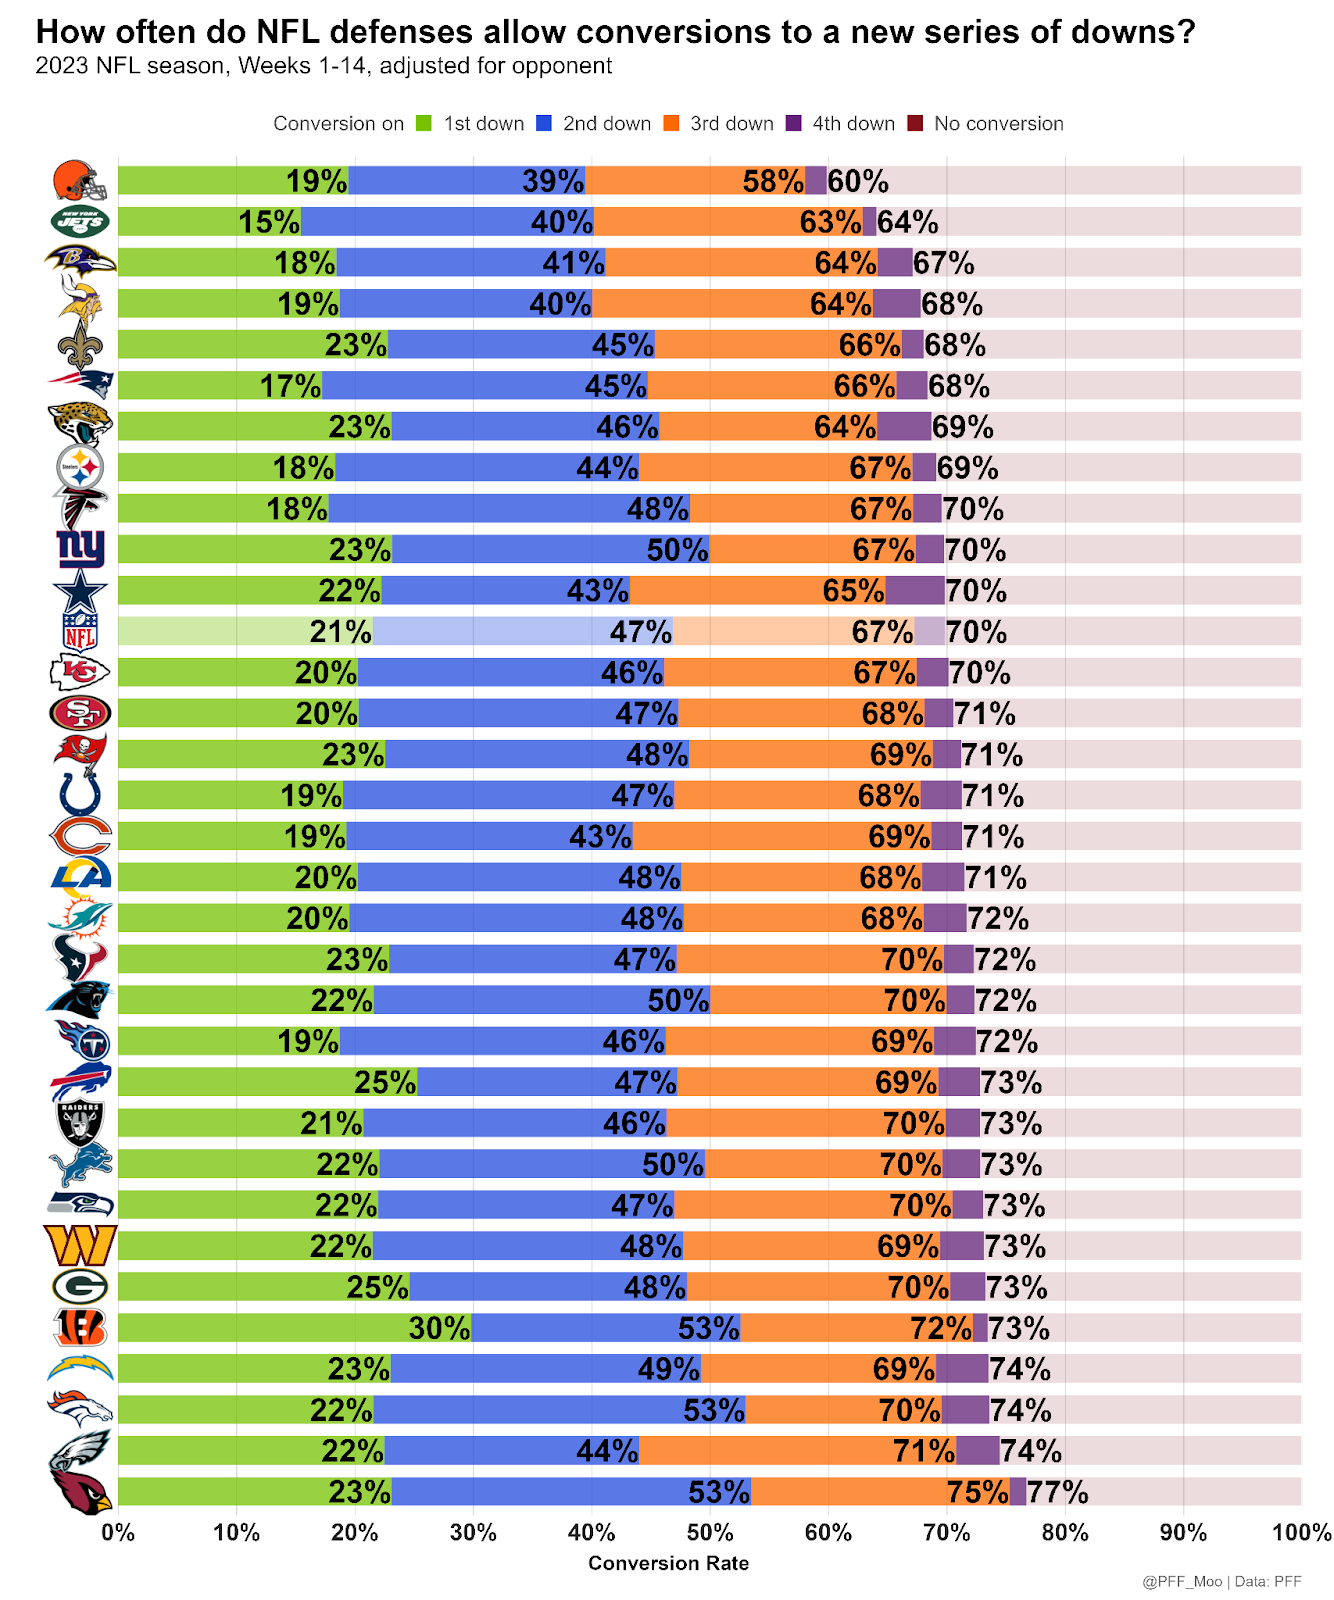
Moving the sticks
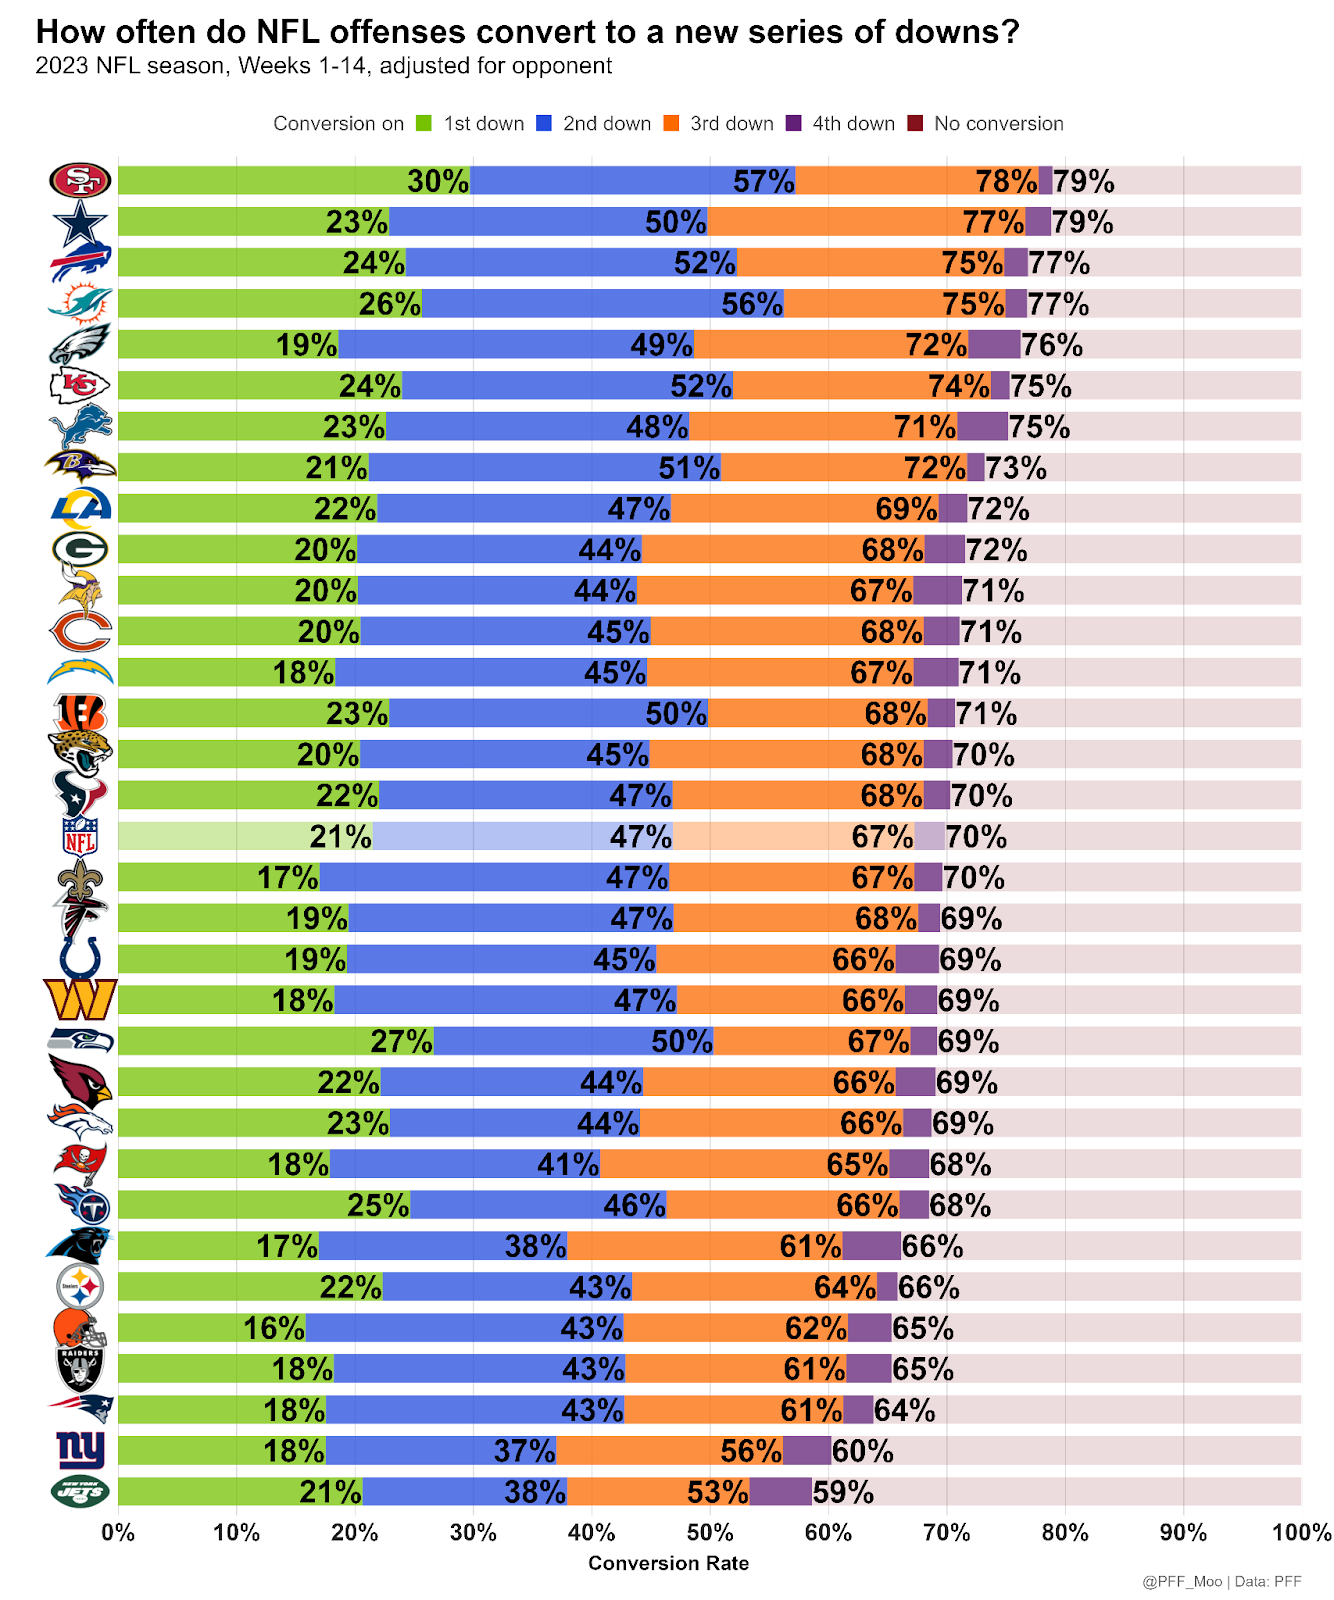
The following chart shows how often teams move the sticks — that is, convert a series of downs to a new series of downs. For example, the Miami Dolphins are moving the sticks on first down 26% of the time. They are moving the sticks on the first two downs 56% of the time. After three downs, they move the sticks 75% of the time. In total (using all four downs), they move the sticks 77% of the time.
Note that these numbers are adjusted for field position and opponent, so one could consider this to be the rate of moving the sticks when facing a league-average field position against an average defense:
Here is the same chart for the other side of the ball, which is also adjusted for field position and the opposing offenses faced:
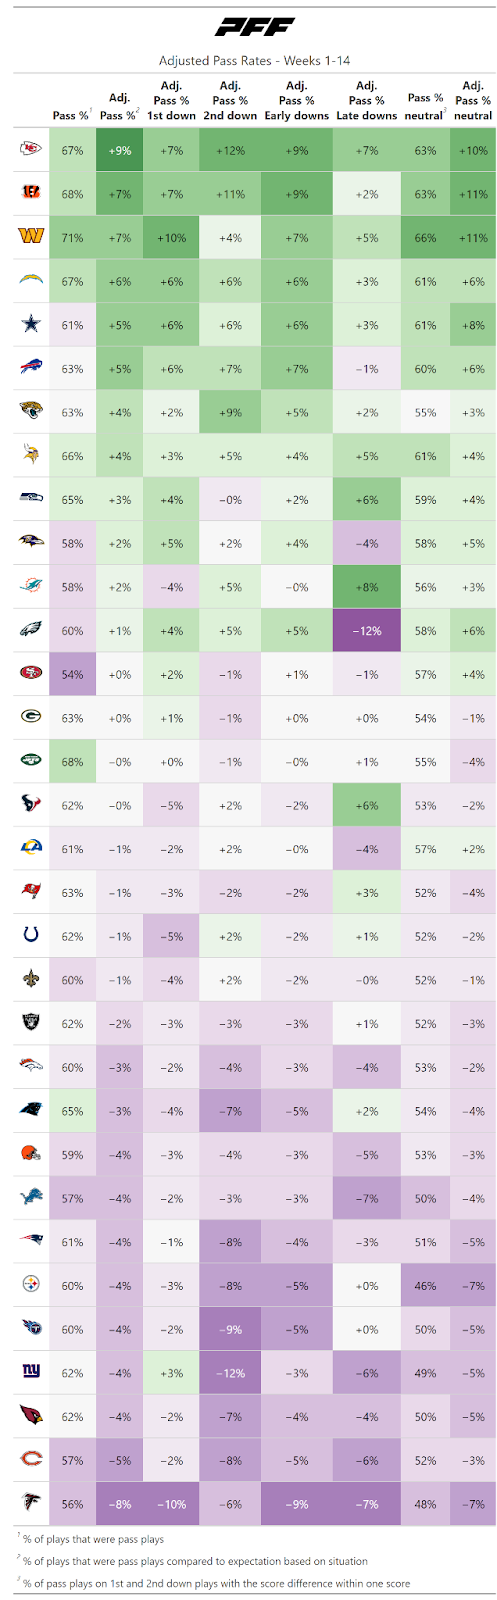
Pass rates
The following table shows how often teams drop back to pass, adjusted for down, distance and the current score:
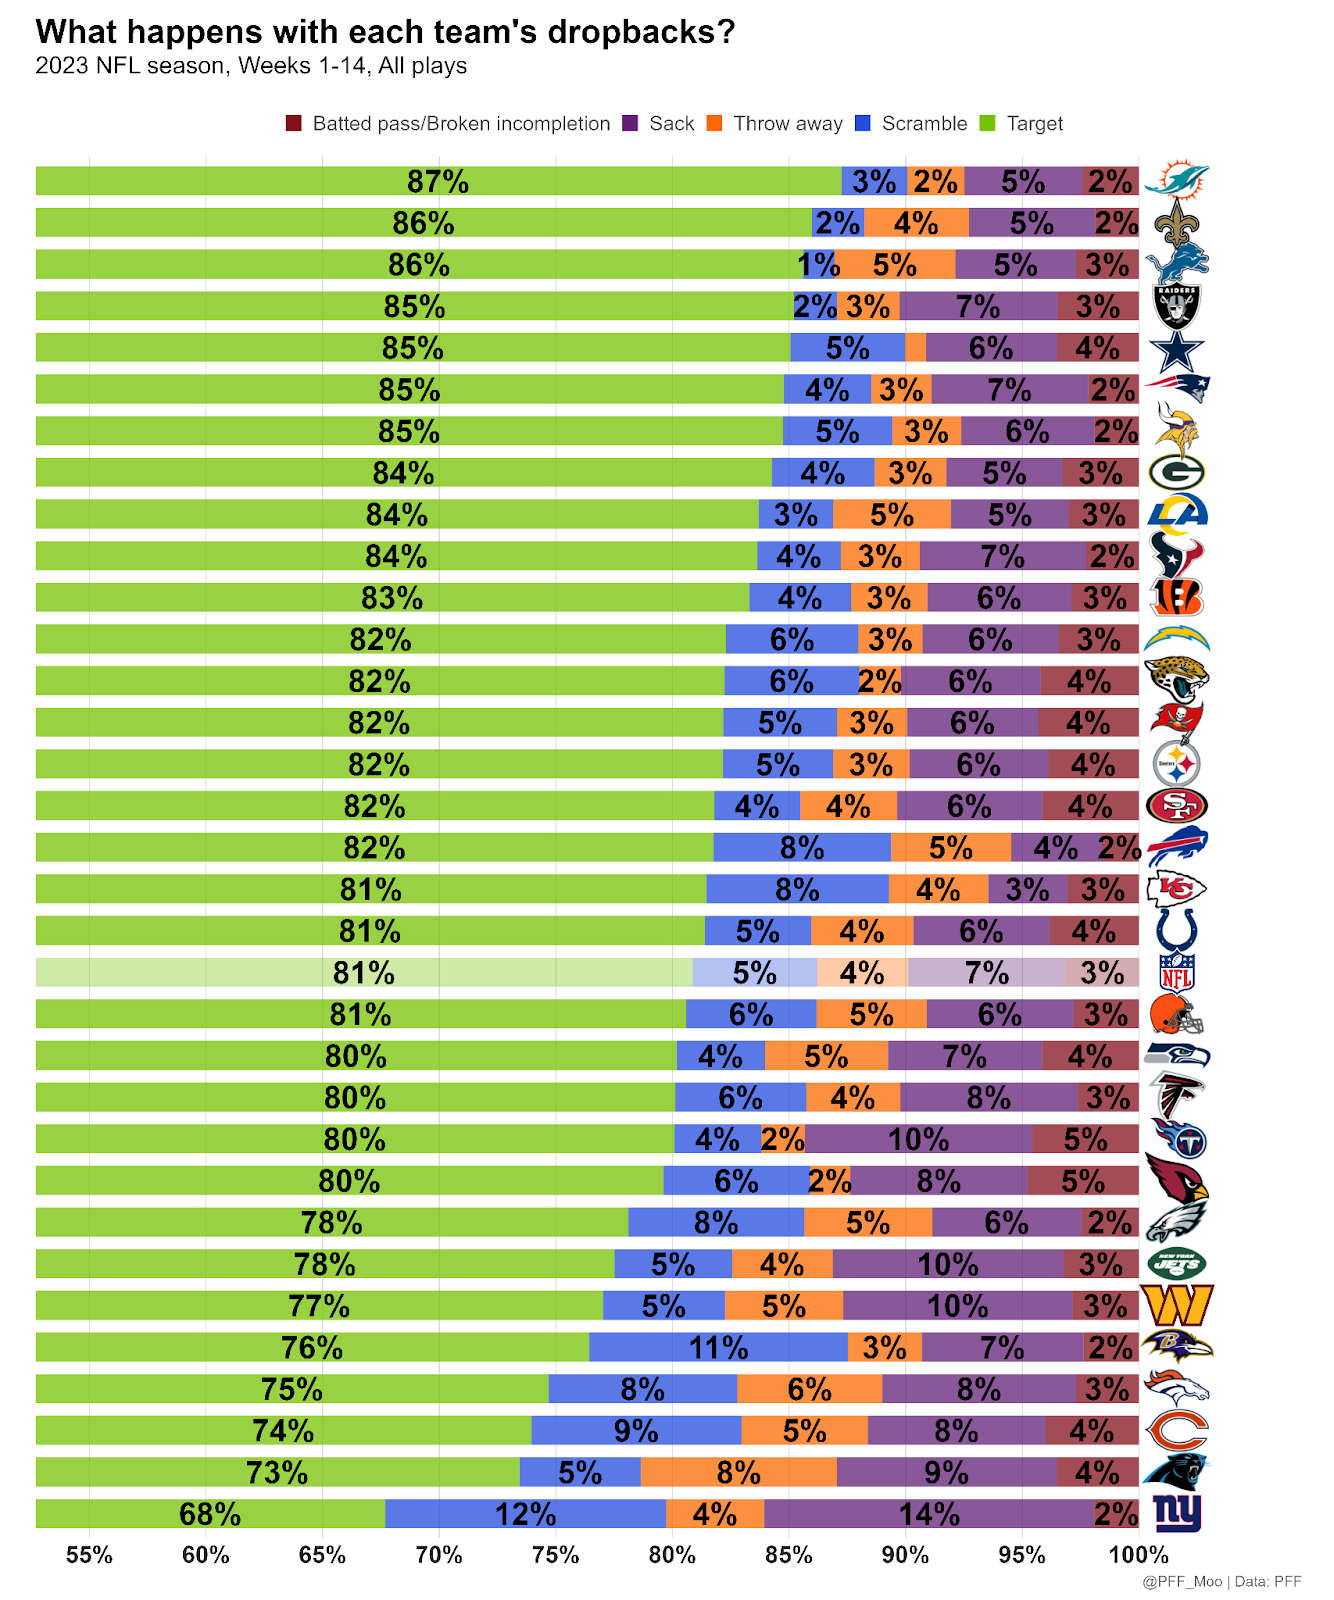
Dropback outcomes
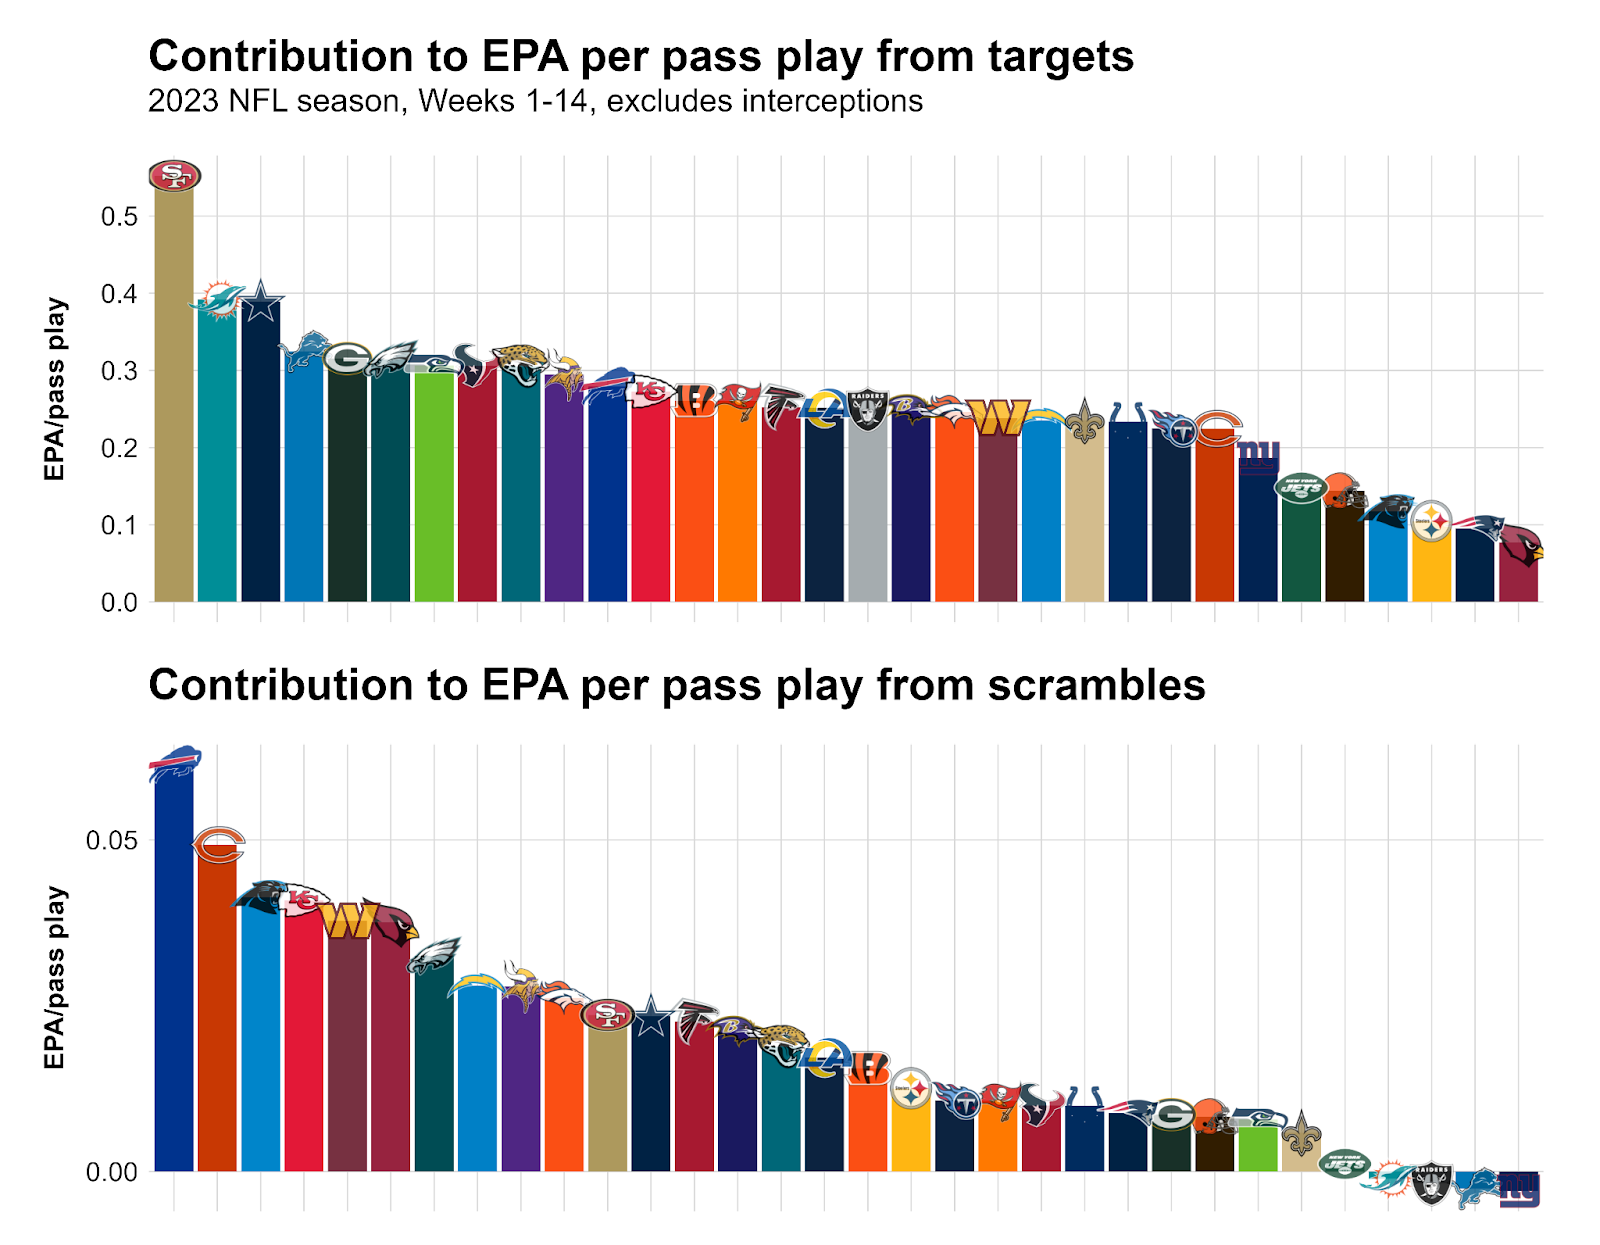
With passing targets being the most efficient outcome of a dropback on average, just throwing more often than other teams can already be an important indicator of a good offense. There are notable exceptions for teams with mobile quarterbacks, but teams mostly want to have a large green bar (targets) and a small purple bar (sacks) in the chart below:
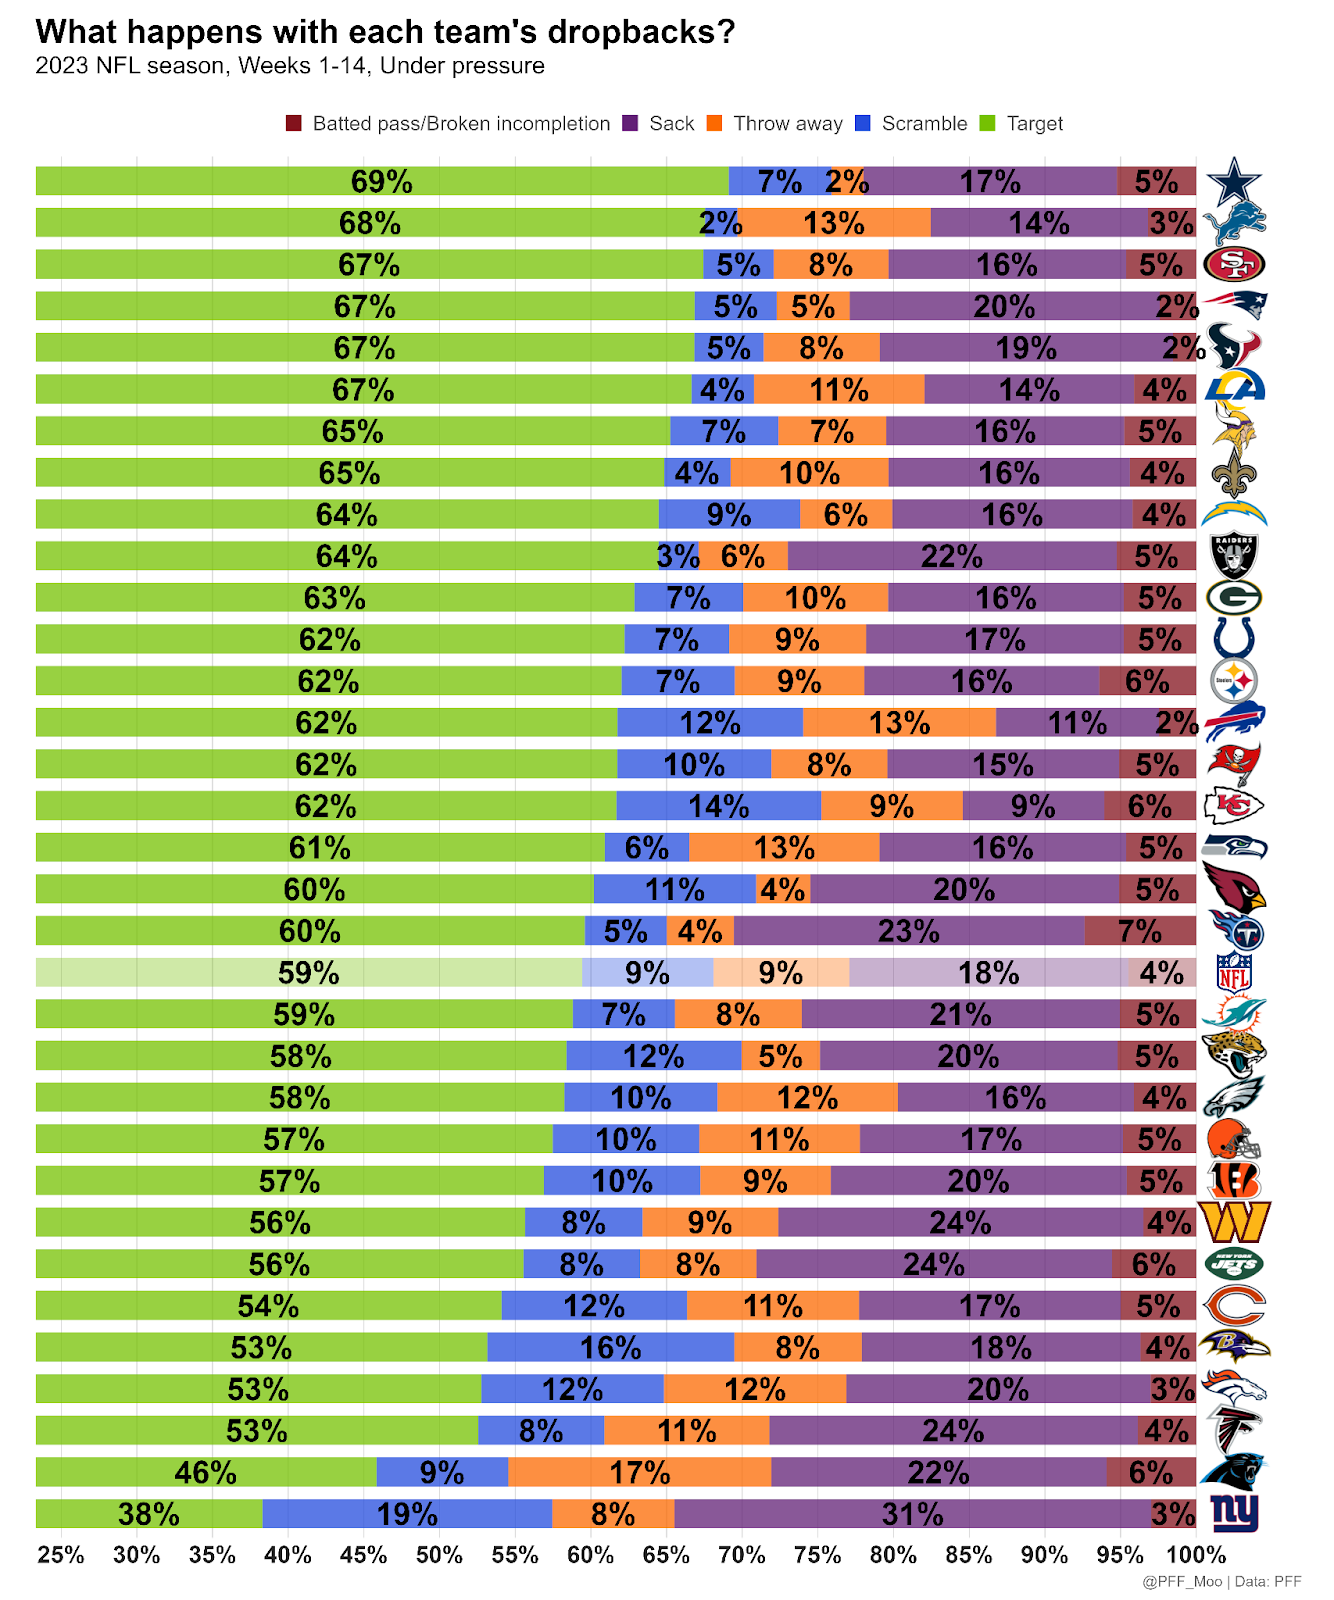
Here is the same chart for when the quarterback is under pressure:
We also want to look at the contribution of each dropback outcome to the overall passing efficiency of each team.
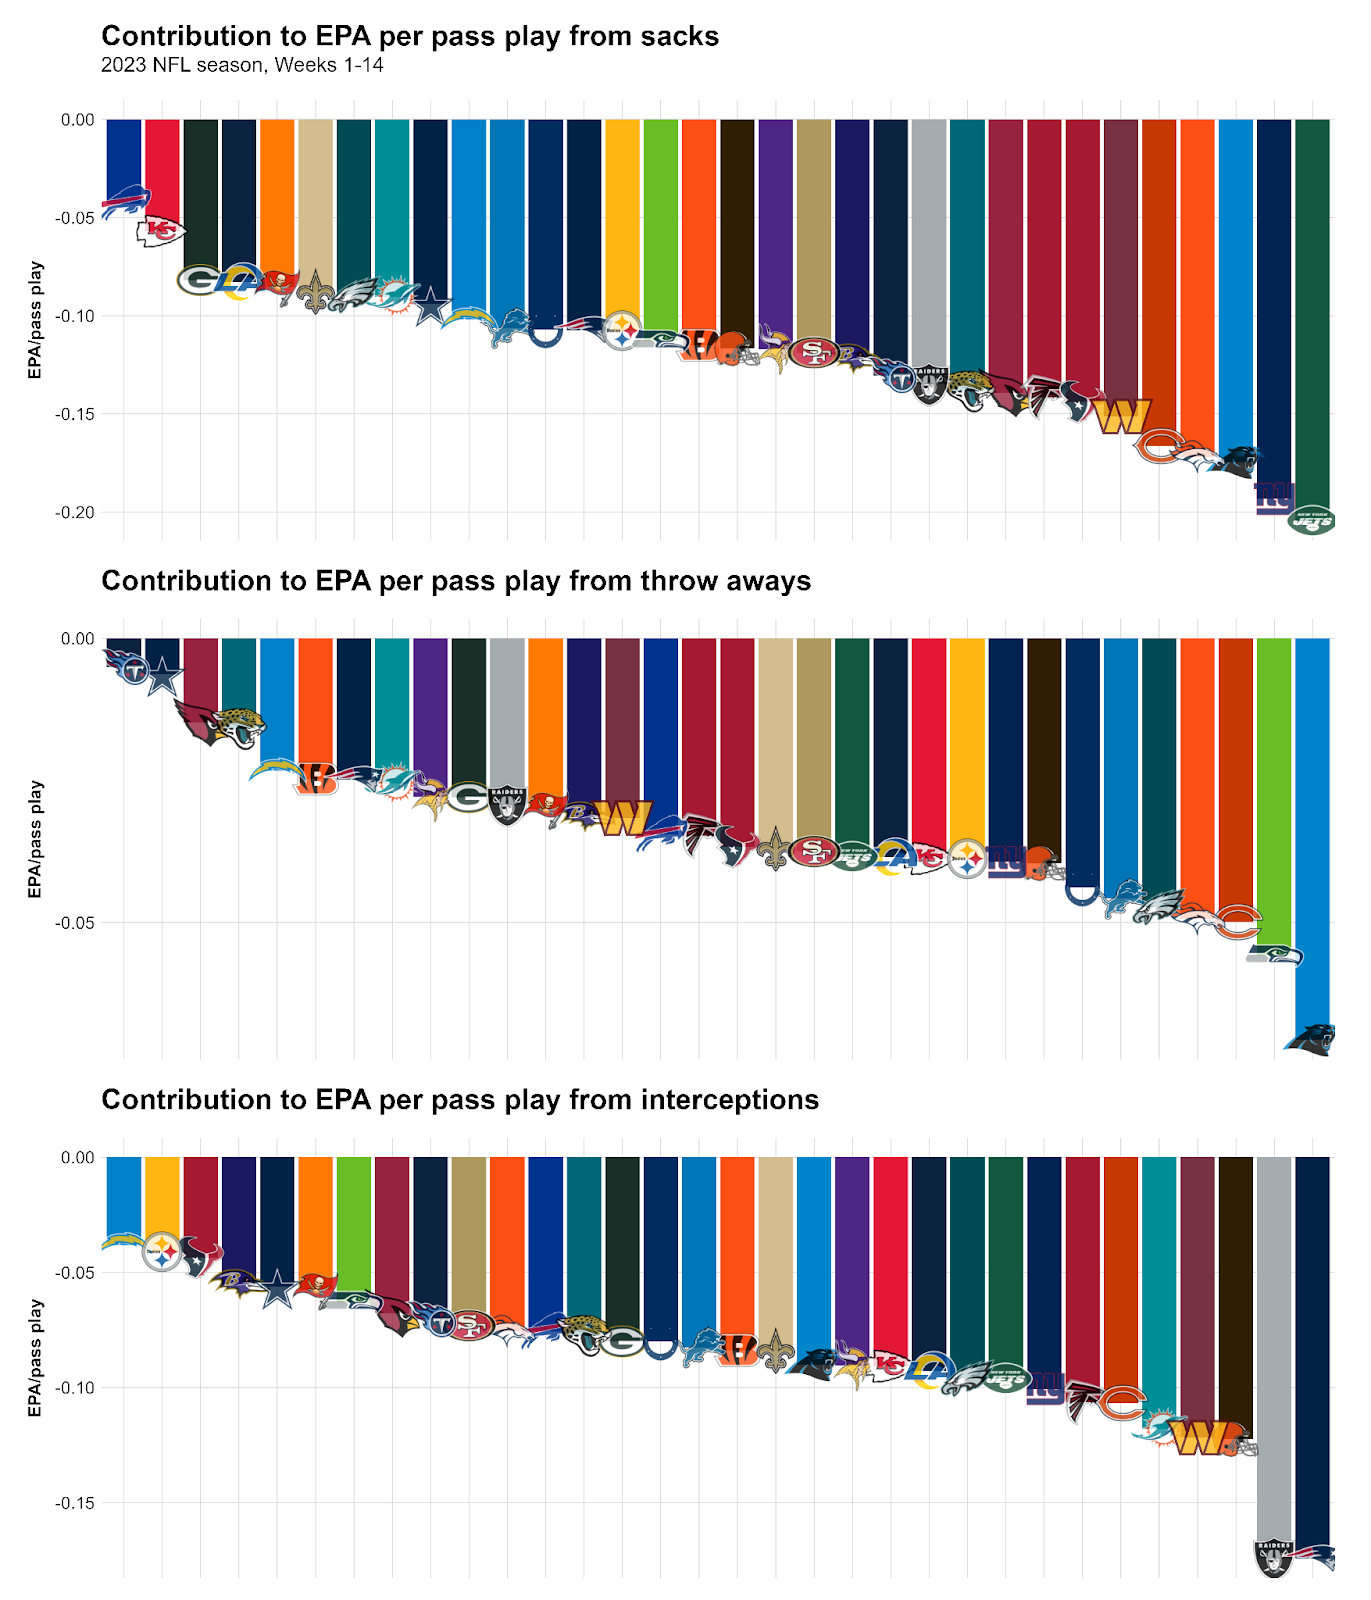
Here is how much the negative outcomes (sacks, throwaways and interceptions) contribute to each team’s total EPA per pass play numbers:
Here is how the mostly positive outcomes (targeted passes that aren’t intercepted and scrambles) contribute to each team’s passing efficiency:
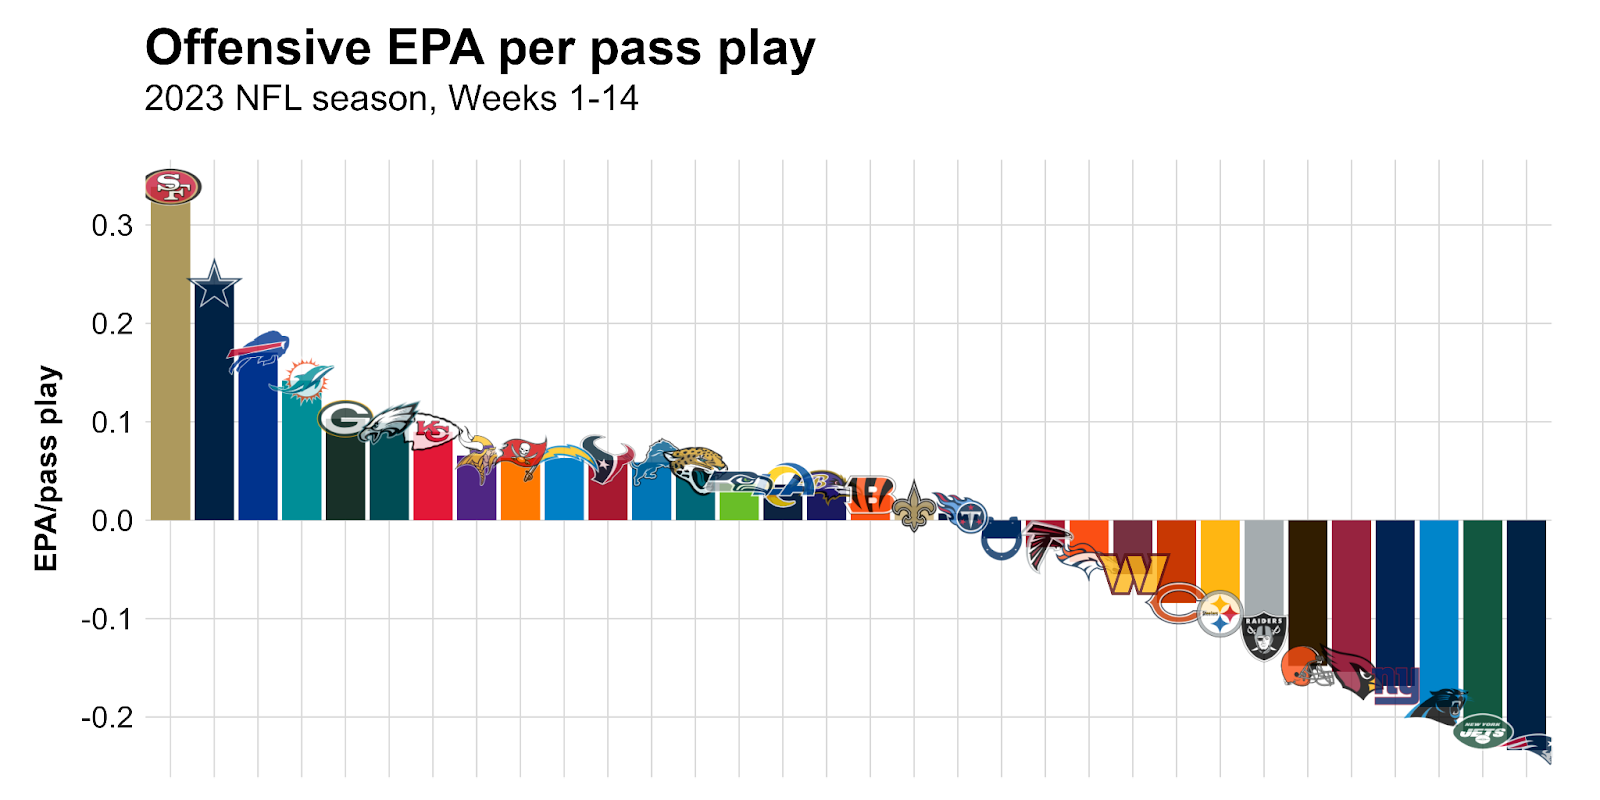
As an overall summary, here is each NFL team's passing efficiency:
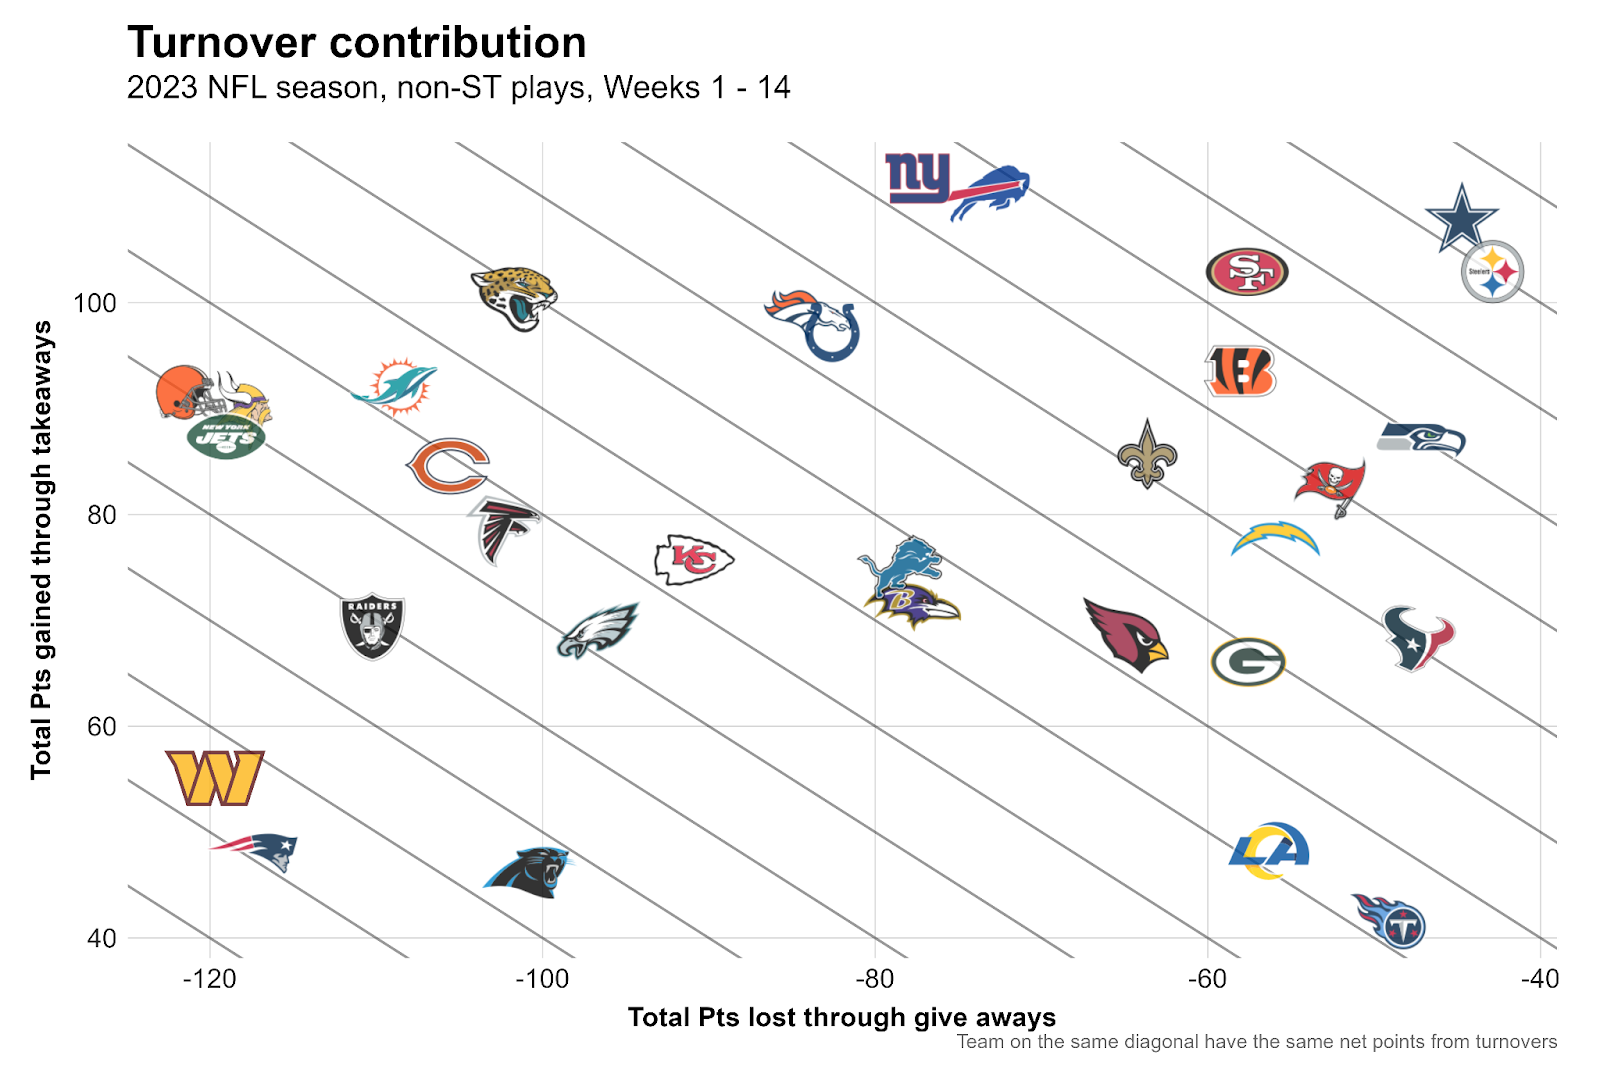
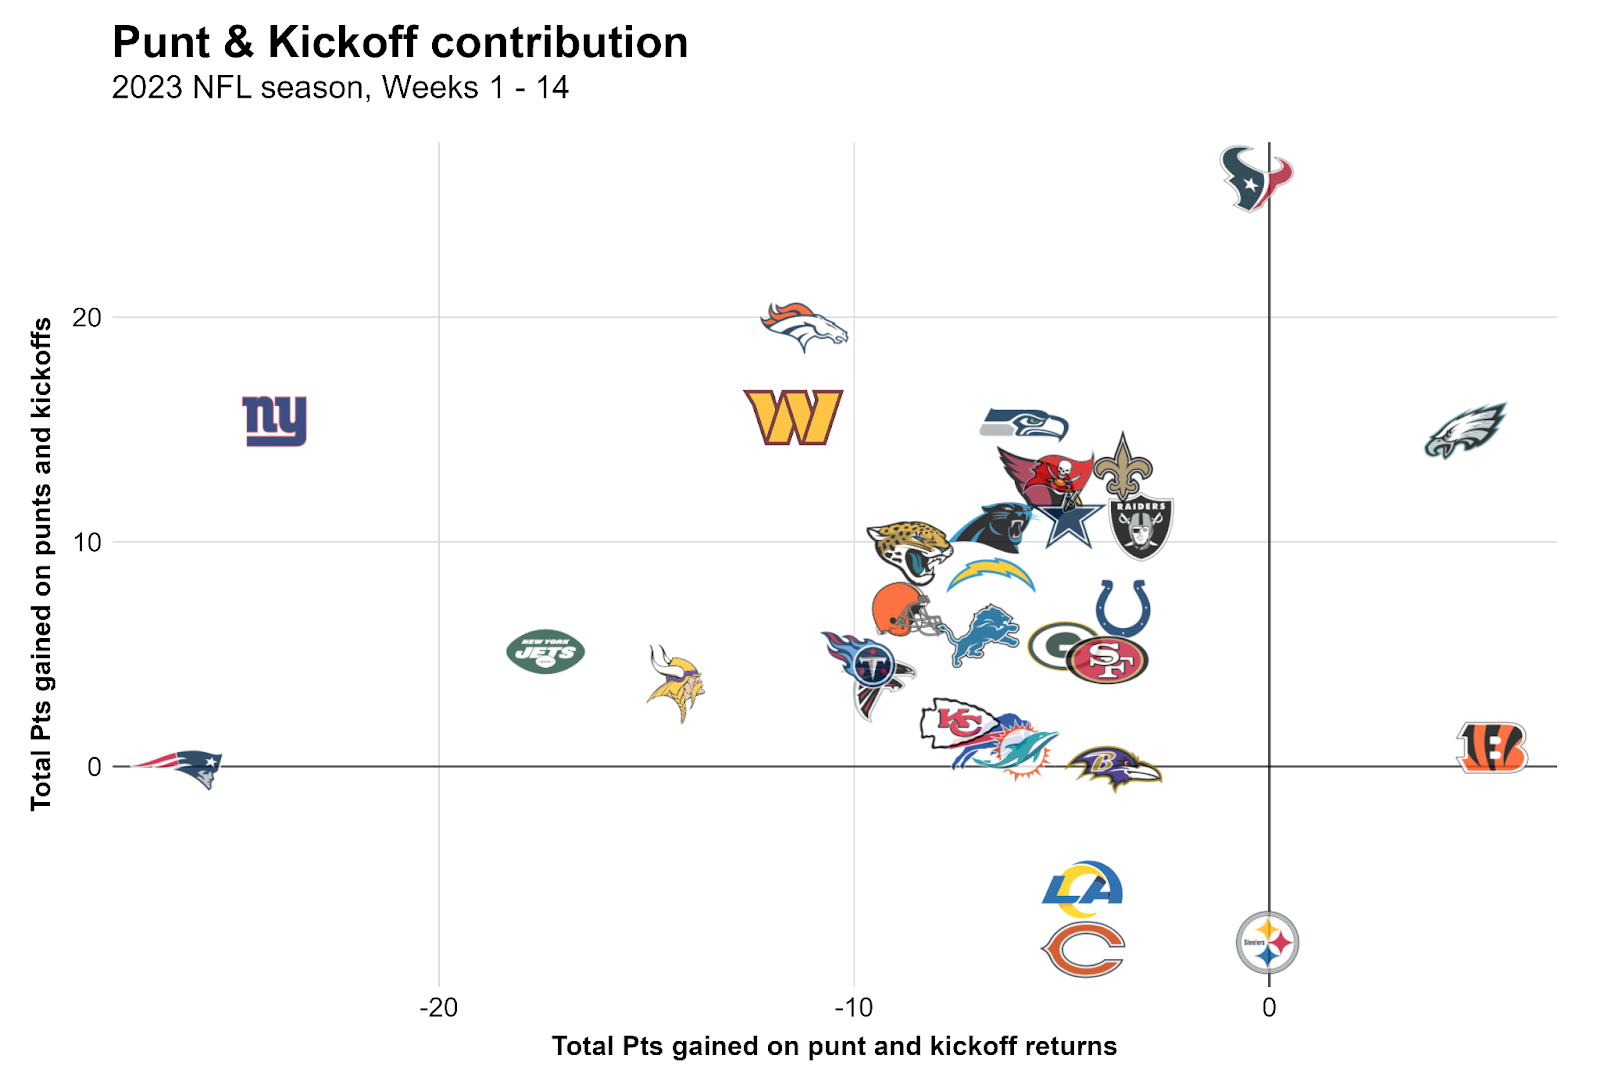
Special Teams & Turnovers
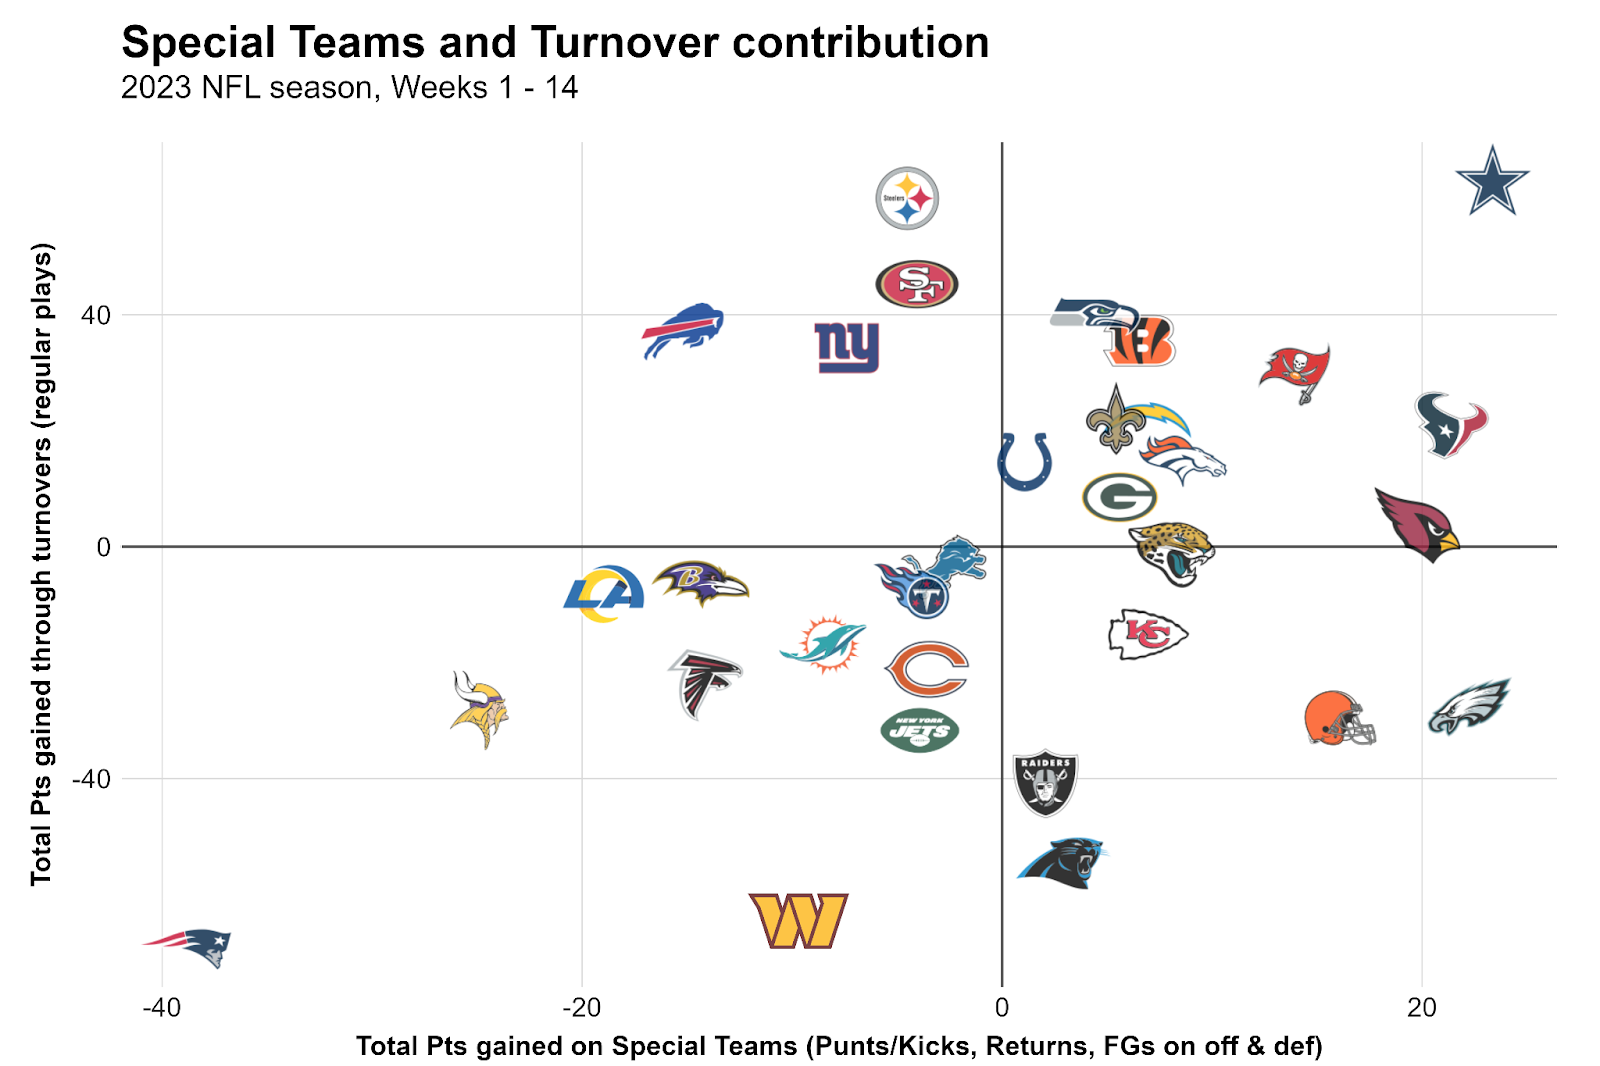
The following chart shows how many net points each team has gained through turnovers (gaining points through takeaways and losing points through giveaways) and special teams (all phases):
The following chart looks at points gained and lost through takeaways and giveaways, respectively:
This chart looks at punts and kickoffs, displaying how many net points teams gained through receiving them (X-axis) and kicking them (Y-axis):
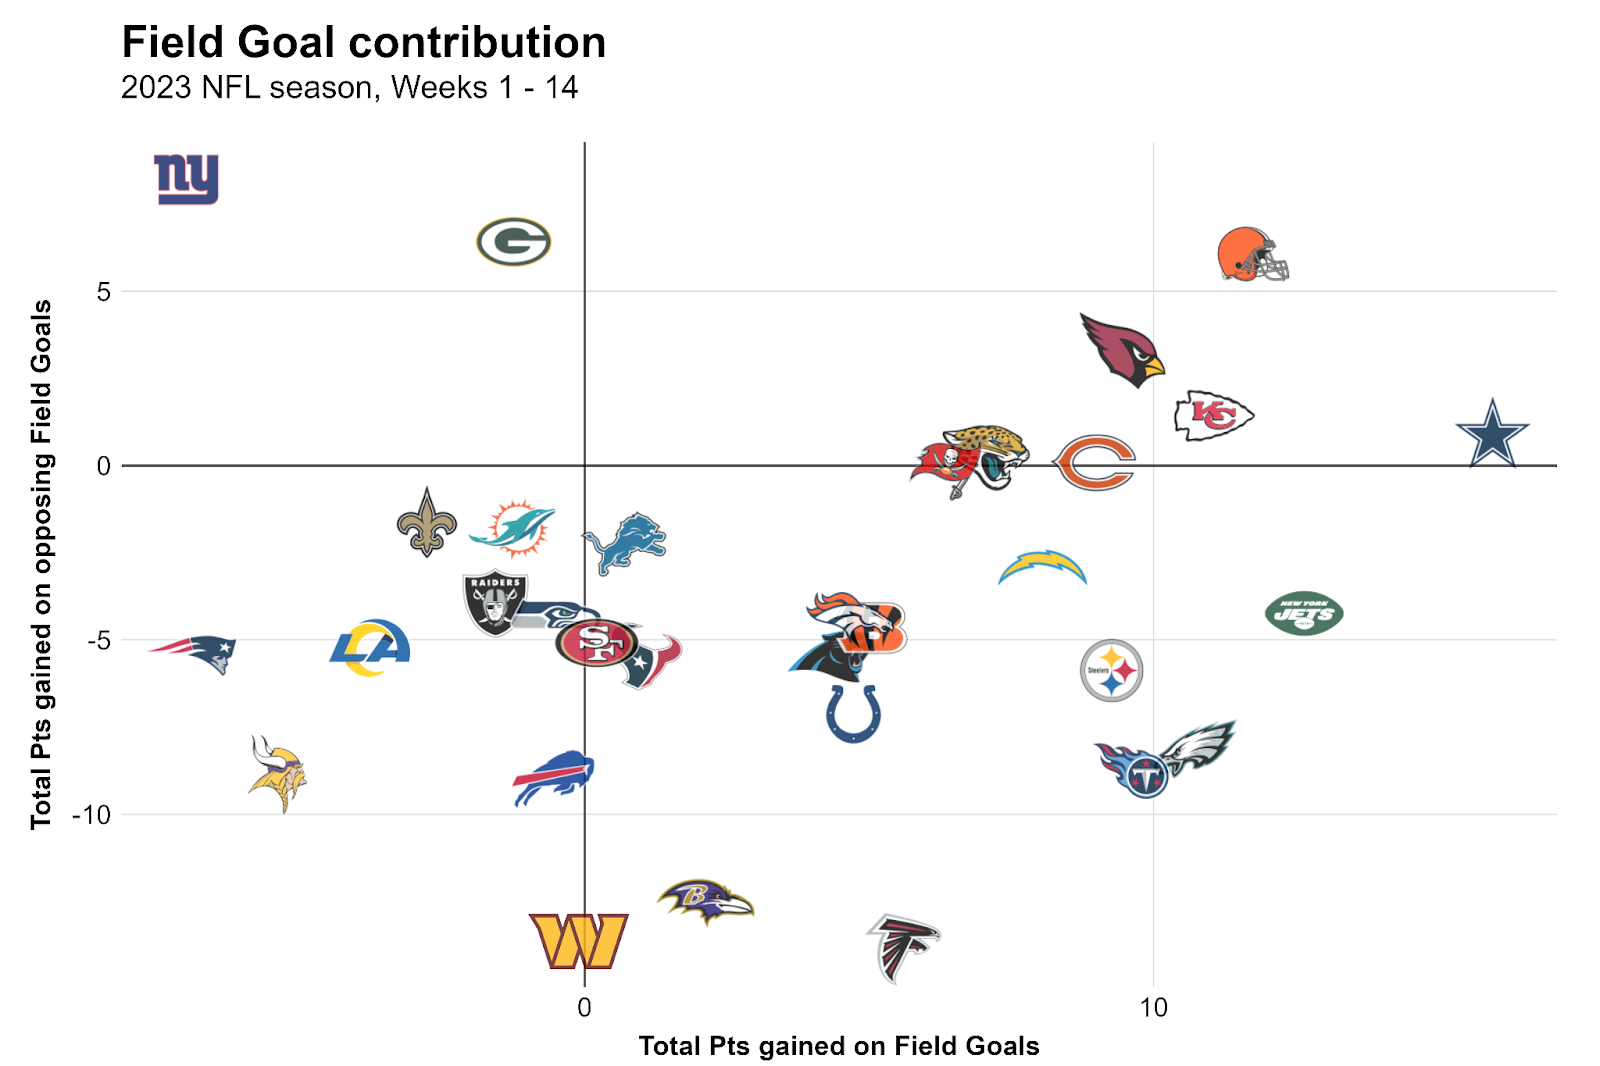
This chart looks at points over expectation (based on distance) on field goals. The X-axis describes kicking own field goals, while the Y-axis represents the opponent kicking field goals. This part is, of course, mostly luck-based, because most field goals are completely out of a defense's control.