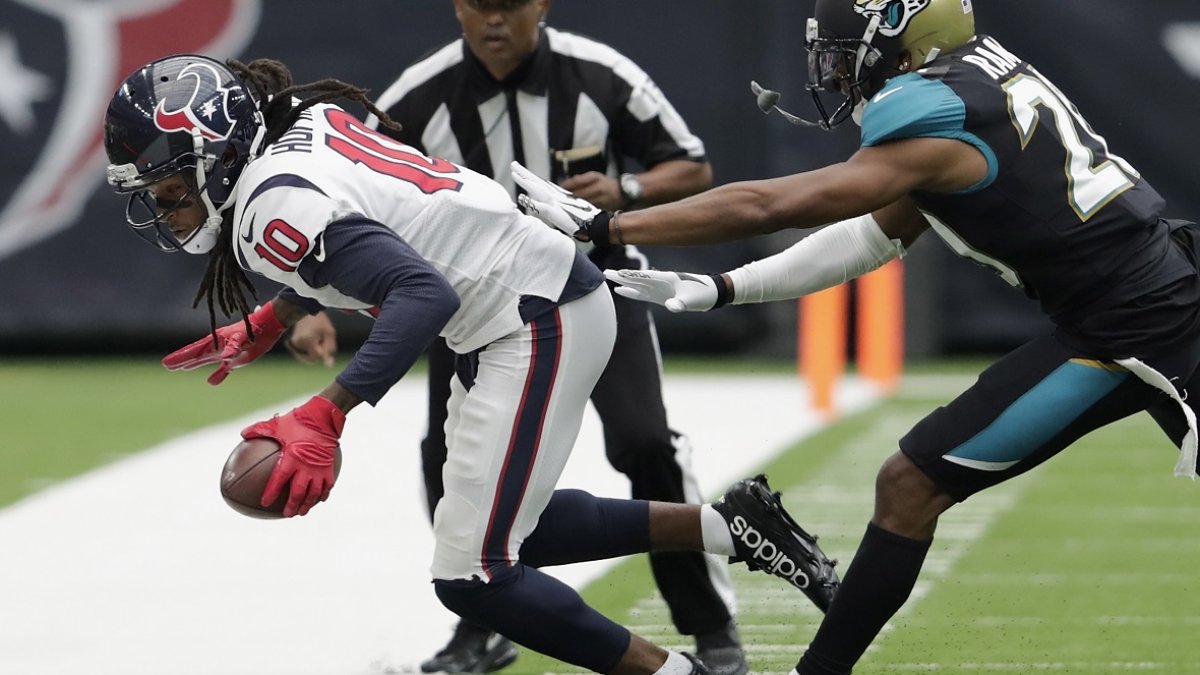
It must have been Week 1 of an NFL season, because while the Steelers and Falcons struggled to put away the presumably rebuilding Browns and Bears, the Jaguars and Rams easily dispatched their playoff-hopeful opponents, the Texans and Colts. OK, Scott Tolzien may have been a factor, but that’s part of this equation. Each week, I’ll be writing about the players who have benefited and been hurt the most by garbage time and CG (counter-garbage) time. I’ve defined those situations by win probability thresholds, which you can read more about here.
Tolzien illustrates an important aspect of garbage time that I did not cover in the preseason, which is that players show some consistency in their percentages of garbage and CG time over the course of a season. I ran split-half correlations for passers, rushers, and receivers from 2009-16 and found that all three had correlation coefficients in the 0.25 to 0.40 range.
| Garbage and CG Time Split-Half Correlations | ||
| Test | Garbage Time | CG Time |
| Passing | 0.29 | 0.29 |
| Rushing | 0.37 | 0.25 |
| Receiving | 0.29 | 0.25 |
To a certain extent, one can identify the good and bad teams that are more likely to find themselves in CG and garbage time situations. In addition, some players have roles that lend themselves to specific situations, in particular with running backs. That makes receiving backs like Theo Riddick more valuable when their teams are likely to be trailing and power backs like LeGarrette Blount more valuable when their teams are likely to be leading. Just don’t rely on those assumptions too heavily, because the correlations are not very strong.
Quarterbacks
