- Key to DFS success: Random combinations of historically similar matchups can identify counterintuitive and lower-cost DFS options with exceeding upside.
- Best relative DFS values: Aaron Rodgers at quarterback, Kenneth Walker at running back, Allen Lazard and Christian Kirk at wide receiver, Dawson Knox at tight end, Los Angeles Chargers at defense are the best values relative to their DFS price for Week 9.
Estimated reading time: 4 minutes
I publish analyses on the single-game DraftKings showdown slates that use the combination of current projections, historical game results and similarity algorithms to simulate an upcoming game by looking back at the most similar historical matchups. In this analysis, I’m taking the same outline and applying it instead to the DFS main slate by projecting the likelihood each individual quarterback, running back, wide receiver, tight end and D/ST option will be the highest scorer of the slate. In doing this, we can find the unlikely tournament plays who may not have been on your radar.

QUARTERBACKS
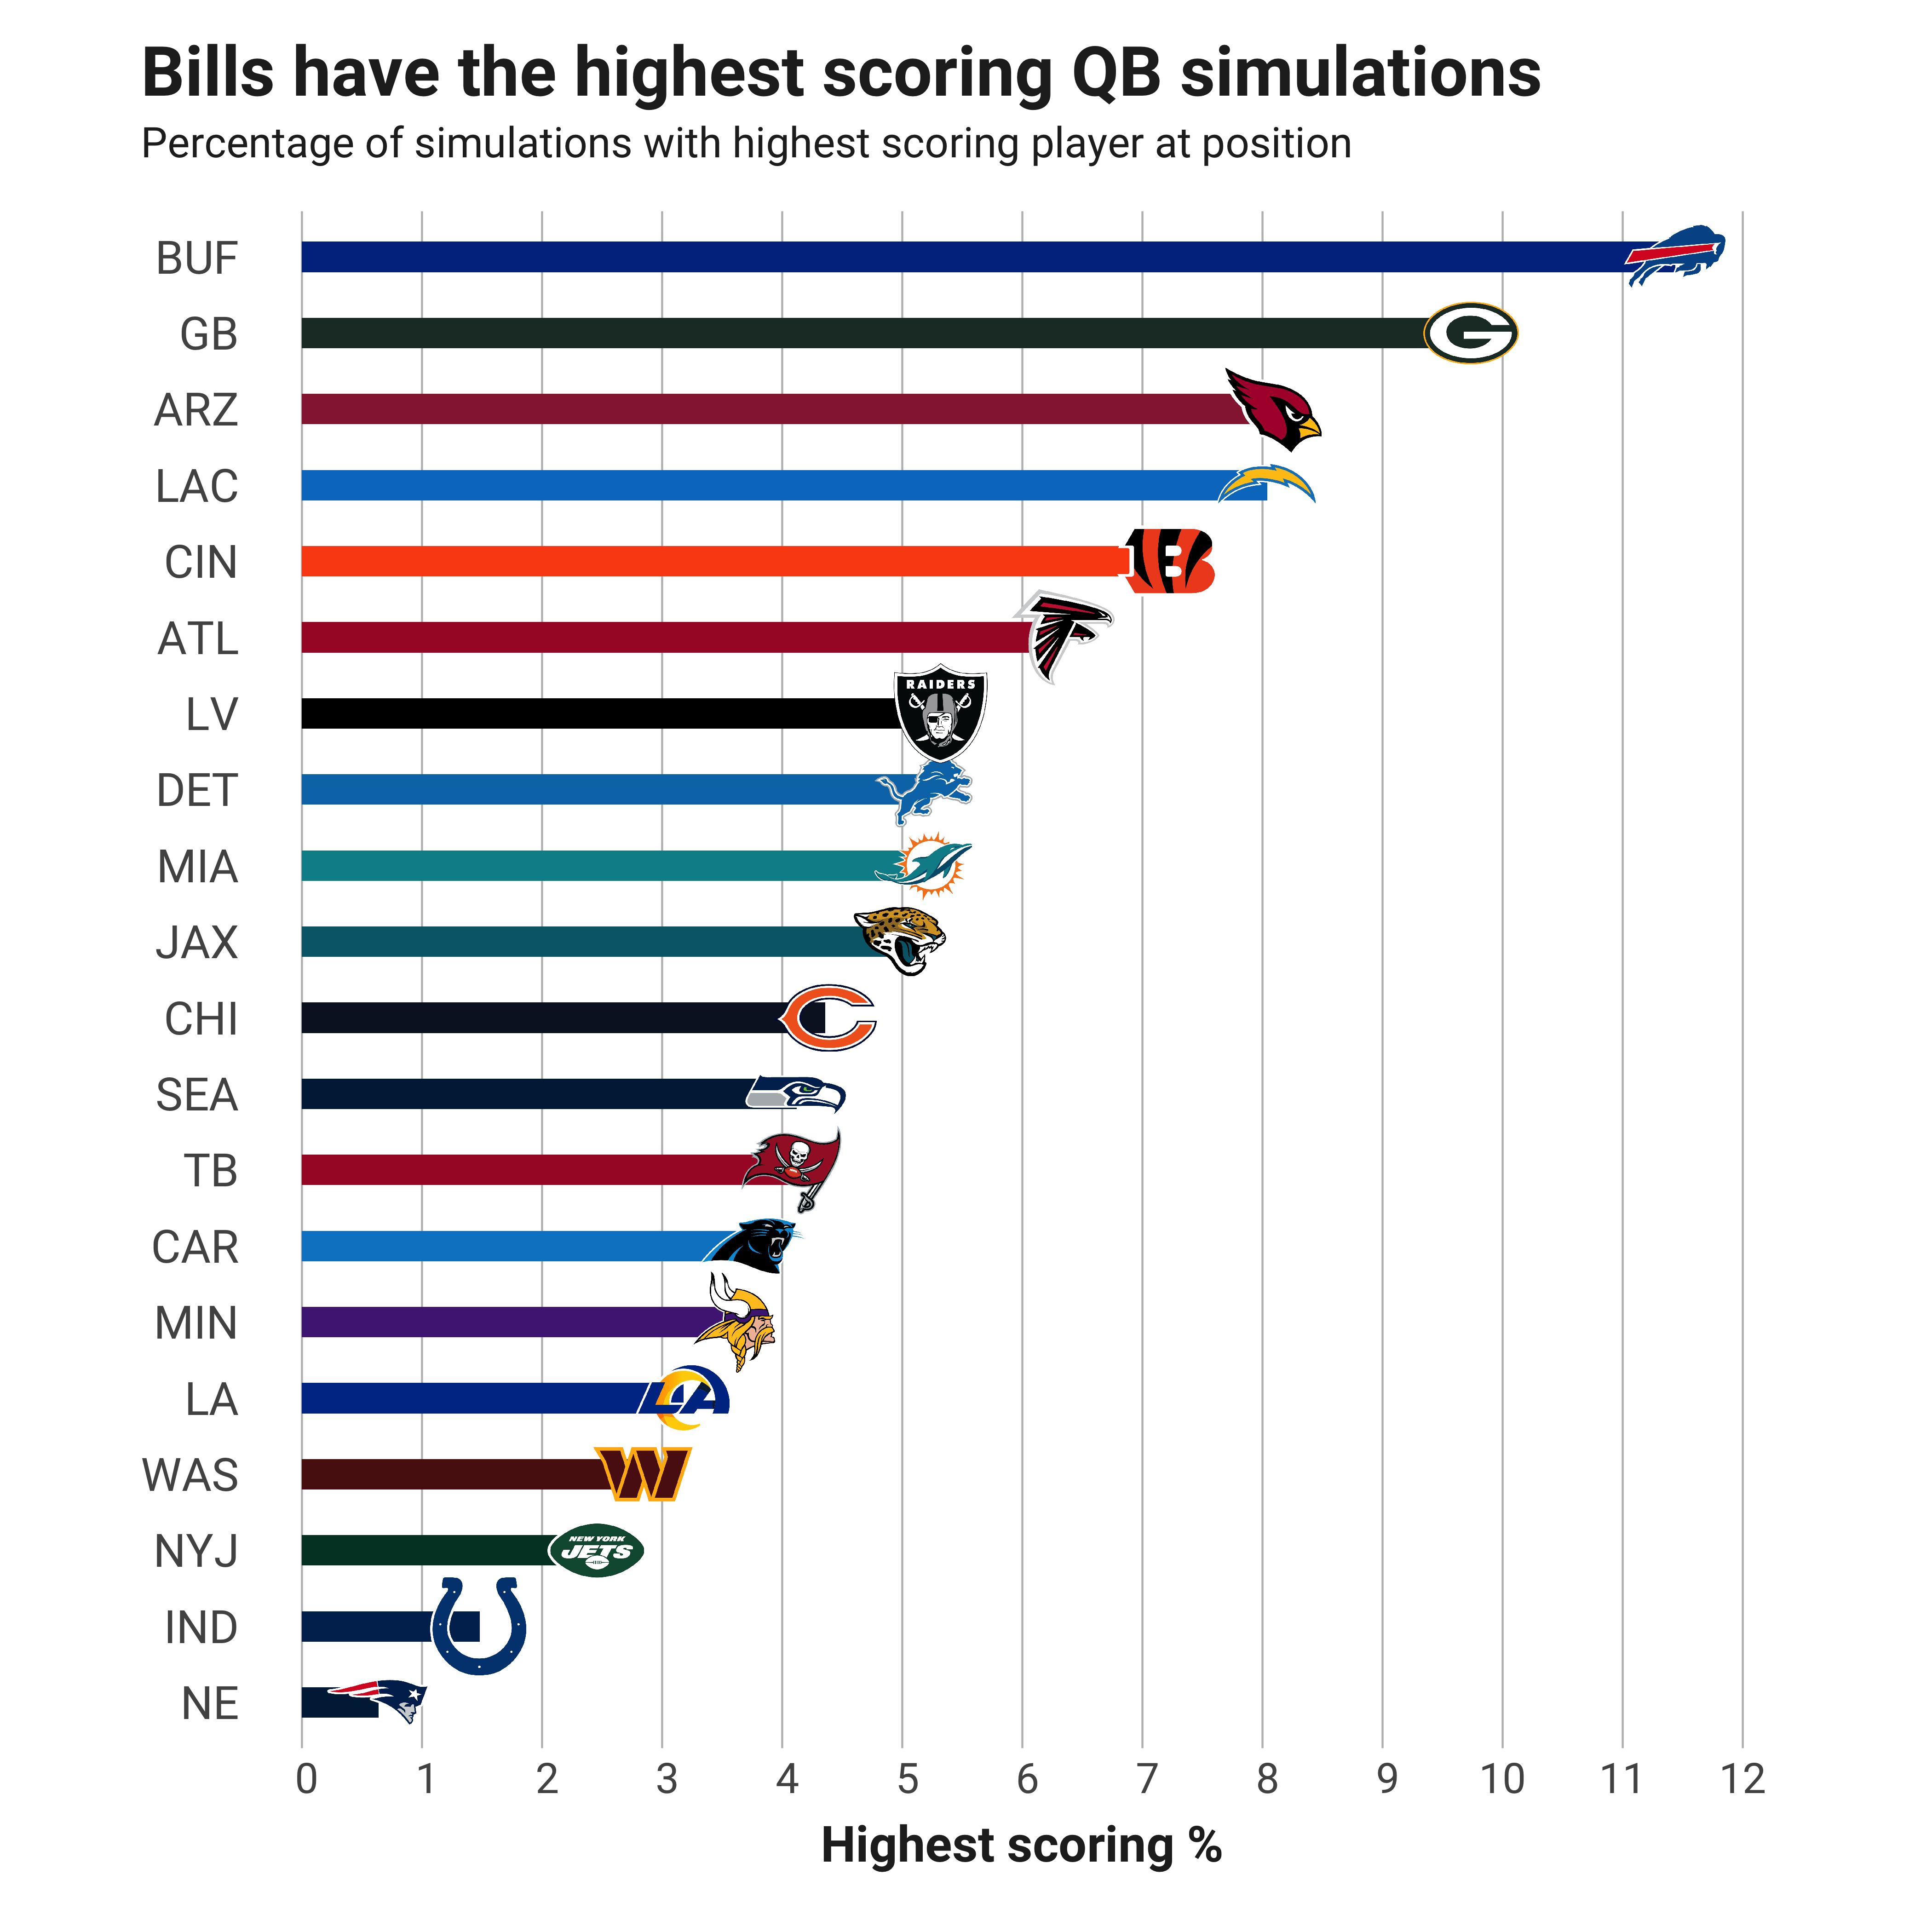
| Highest % | Player | Team | Opponent | DK Fpts | DK Salary | FD Fpts | FD Salary |
| 11.4 | Josh Allen | BUF | NYJ | 26.3 | 8,500 | 24.7 | 9,300 |
| 9.7 | Aaron Rodgers | GB | DET | 23.6 | 5,900 | 22.2 | 7,000 |
| 8.1 | Kyler Murray | ARZ | SEA | 22.8 | 7,400 | 21.5 | 8,200 |
| 8.0 | Justin Herbert | LAC | ATL | 22.6 | 7,200 | 21.2 | 7,800 |
| 7.2 | Joe Burrow | CIN | CAR | 22.8 | 6,600 | 21.3 | 8,500 |
| 6.3 | Marcus Mariota | ATL | LAC | 21.0 | 5,300 | 19.6 | 7,100 |
| 5.3 | Derek Carr | LV | JAX | 19.0 | 5,400 | 17.6 | 6,800 |
| 5.2 | Tua Tagovailoa | MIA | CHI | 21.8 | 6,700 | 20.3 | 8,000 |
| 5.2 | Jared Goff | DET | GB | 15.1 | 5,500 | 14.2 | 7,100 |
| 5.0 | Trevor Lawrence | JAX | LV | 17.9 | 5,200 | 16.6 | 6,800 |
| 4.4 | Justin Fields | CHI | MIA | 17.6 | 5,300 | 16.4 | 7,400 |
| 4.1 | Geno Smith | SEA | ARZ | 19.9 | 5,800 | 18.5 | 7,500 |
| 4.1 | Tom Brady | TB | LA | 22.0 | 6,000 | 20.2 | 6,900 |
| 3.8 | P.J. Walker | CAR | CIN | 15.4 | 5,200 | 14.3 | 6,500 |
| 3.6 | Kirk Cousins | MIN | WAS | 17.9 | 6,200 | 16.7 | 7,900 |
| 3.2 | Matthew Stafford | LA | TB | 18.2 | 5,600 | 16.9 | 6,700 |
| 2.8 | Taylor Heinicke | WAS | MIN | 16.9 | 5,400 | 15.9 | 7,200 |
| 2.5 | Zach Wilson | NYJ | BUF | 14.8 | 5,100 | 14.0 | 6,600 |
| 1.5 | Sam Ehlinger | IND | NE | 15.9 | 5,000 | 15.0 | 6,300 |
| 0.6 | Mac Jones | NE | IND | 17.1 | 5,100 | 16.1 | 6,400 |
RUNNING BACKS
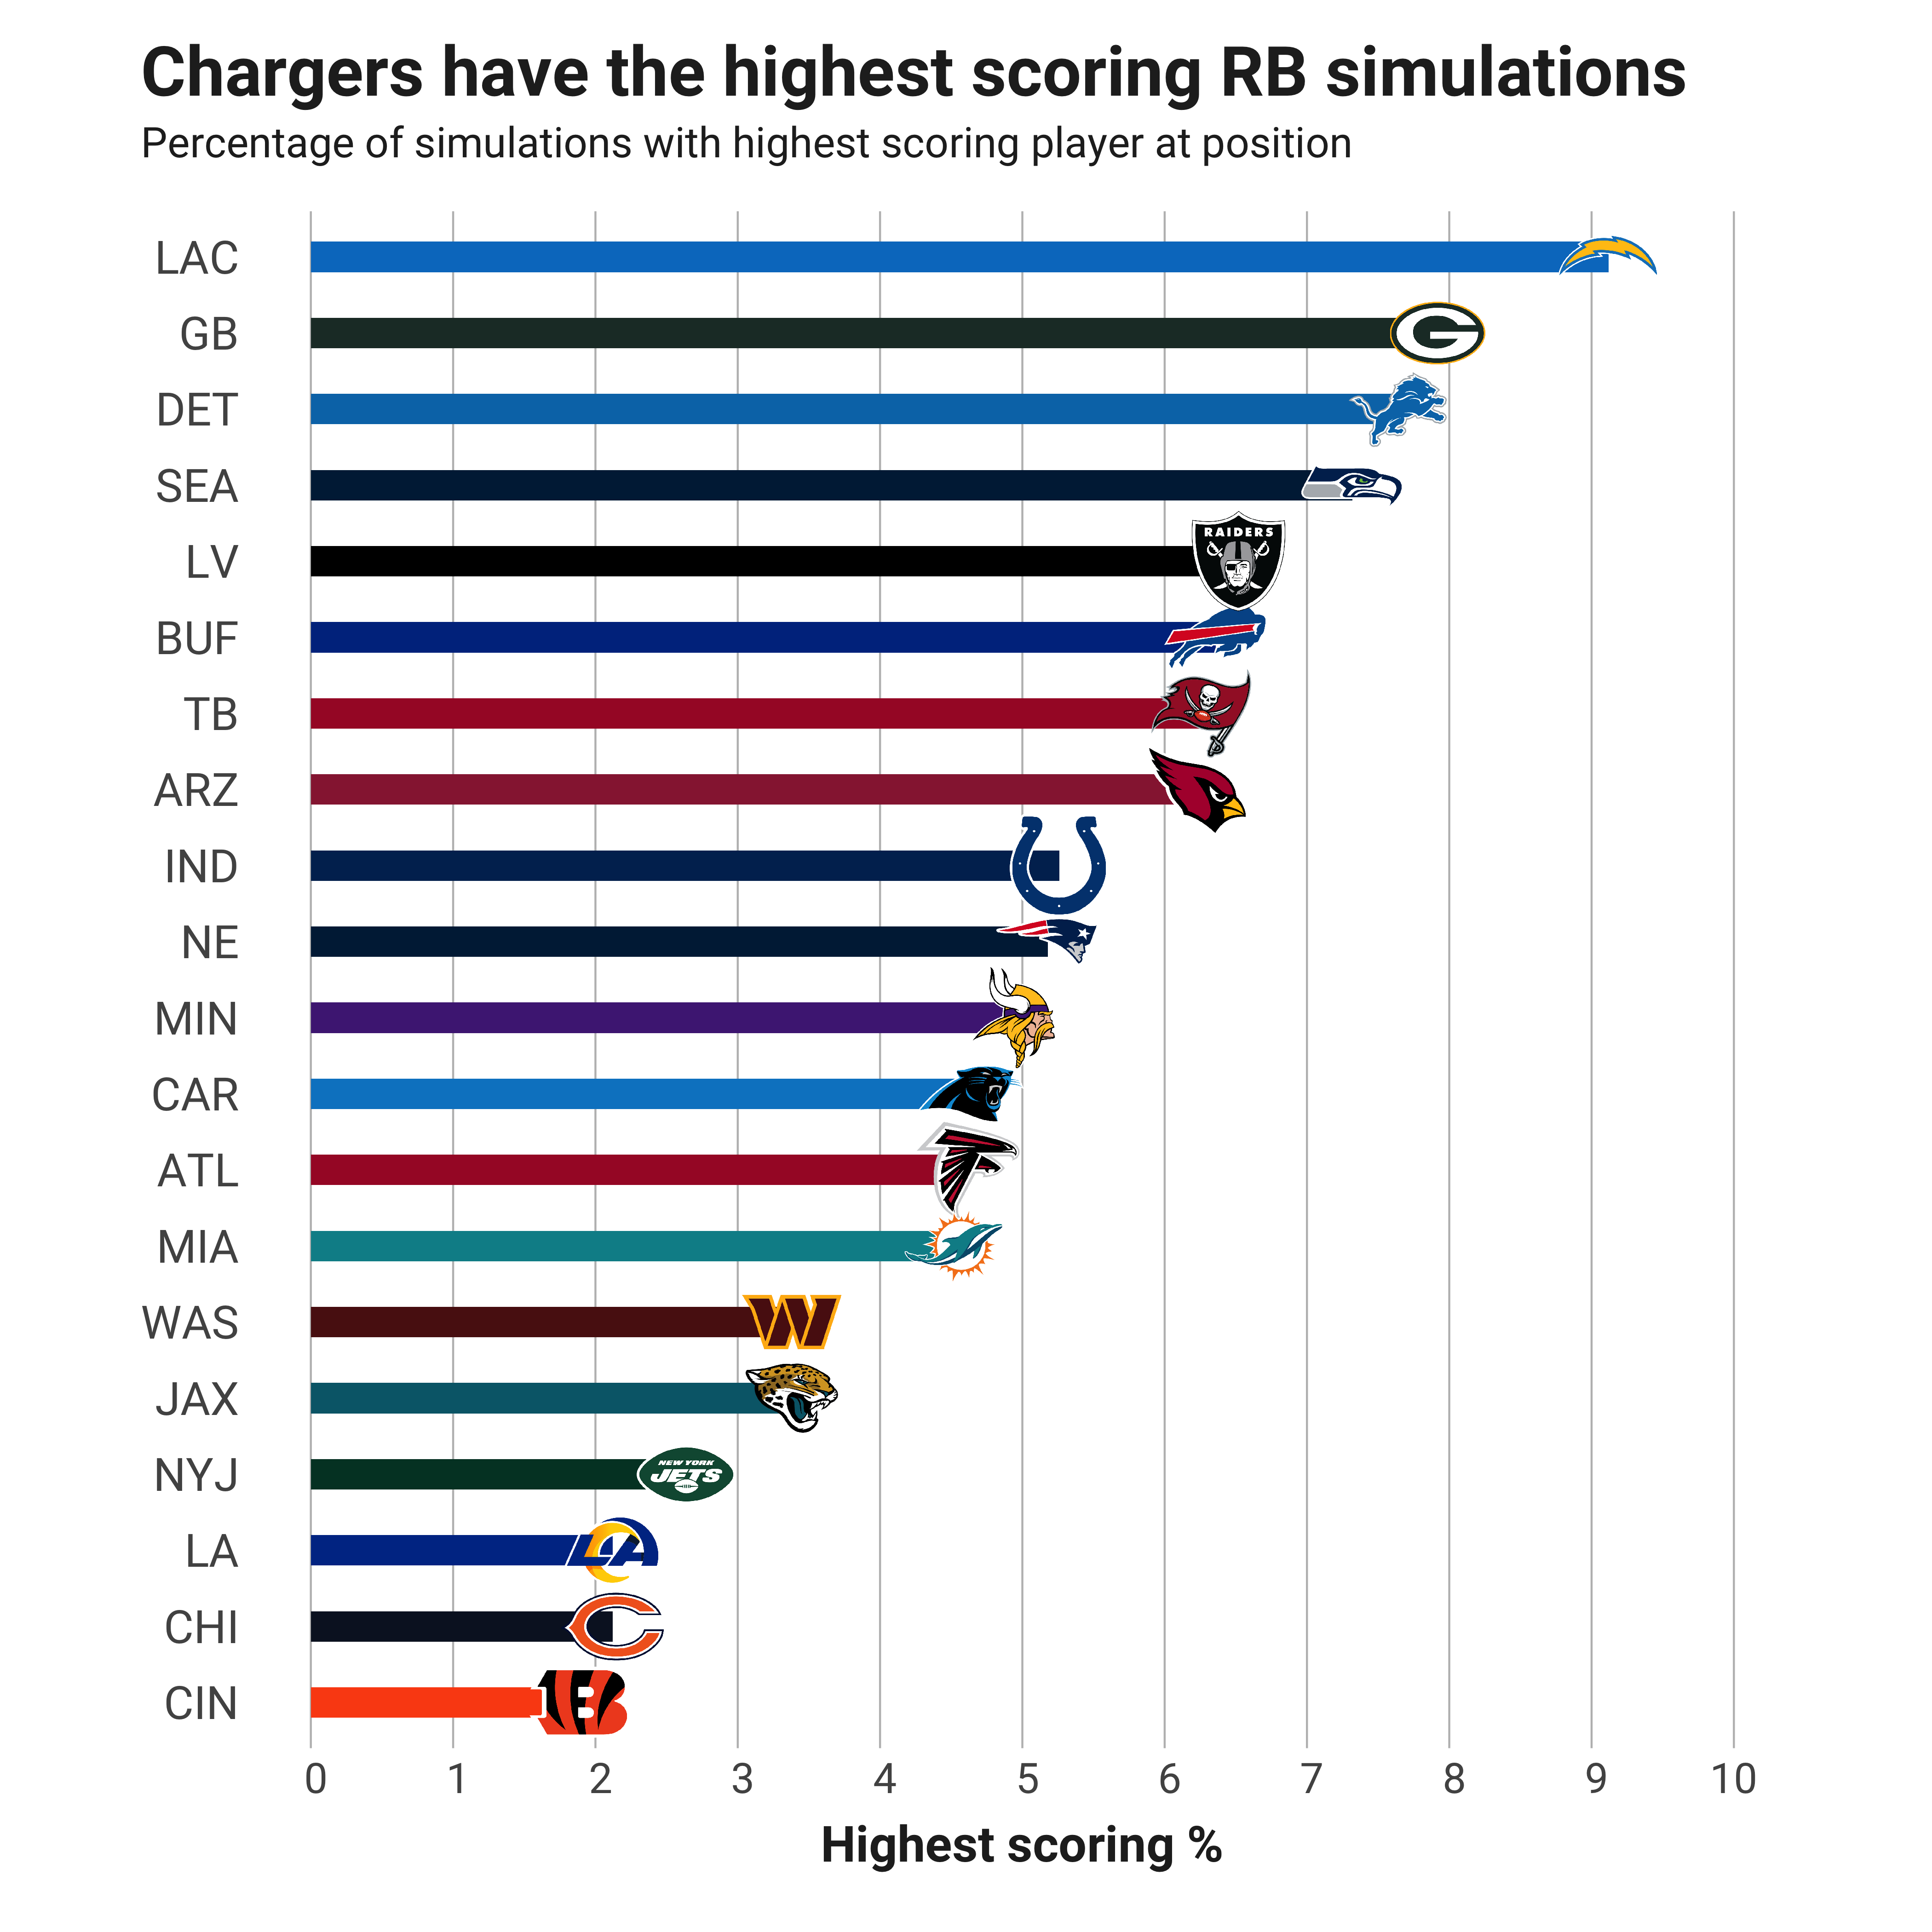
| Highest % | Player | Team | Opponent | DK Fpts | DK Salary | FD Fpts | FD Salary |
| 9.1 | Austin Ekeler | LAC | ATL | 18.5 | 8,800 | 15.6 | 9,400 |
| 7.9 | Aaron Jones | GB | DET | 16.0 | 7,400 | 14.0 | 7,800 |
| 7.6 | D'Andre Swift | DET | GB | 14.3 | 6,400 | 12.1 | 7,500 |
| 7.3 | Kenneth Walker III | SEA | ARZ | 16.4 | 6,200 | 14.4 | 8,300 |
| 6.5 | Josh Jacobs | LV | JAX | 16.4 | 7,300 | 14.4 | 8,800 |
| 6.4 | Devin Singletary | BUF | NYJ | 9.5 | 5,700 | 8.5 | 6,000 |
| 6.3 | Leonard Fournette | TB | LA | 12.7 | 6,600 | 11.1 | 7,100 |
| 6.2 | James Conner | ARZ | SEA | 11.1 | 5,800 | 9.8 | 6,600 |
| 5.3 | Jonathan Taylor | IND | NE | 16.7 | 7,700 | 14.5 | 6,800 |
| 5.2 | Rhamondre Stevenson | NE | IND | 14.0 | 6,200 | 12.4 | 8,000 |
| 4.9 | Dalvin Cook | MIN | WAS | 18.4 | 7,800 | 15.8 | 8,500 |
| 4.6 | D'Onta Foreman | CAR | CIN | 10.4 | 6,000 | 9.3 | 7,300 |
| 4.6 | Tyler Allgeier | ATL | LAC | 9.9 | 5,400 | 8.9 | 6,400 |
| 4.5 | Raheem Mostert | MIA | CHI | 14.4 | 6,100 | 12.6 | 6,500 |
| 3.4 | Travis Etienne | JAX | LV | 15.3 | 6,300 | 13.3 | 7,600 |
| 3.4 | Antonio Gibson | WAS | MIN | 10.7 | 5,500 | 9.3 | 6,100 |
| 2.6 | James Robinson | NYJ | BUF | 8.0 | 5,400 | 7.1 | 6,000 |
| 2.1 | David Montgomery | CHI | MIA | 10.1 | 6,000 | 9.0 | 7,000 |
| 2.1 | Darrell Henderson | LA | TB | 12.0 | 5,100 | 10.7 | 5,700 |
| 1.9 | Joe Mixon | CIN | CAR | 17.6 | 6,500 | 15.2 | 8,100 |
WIDE RECEIVERS
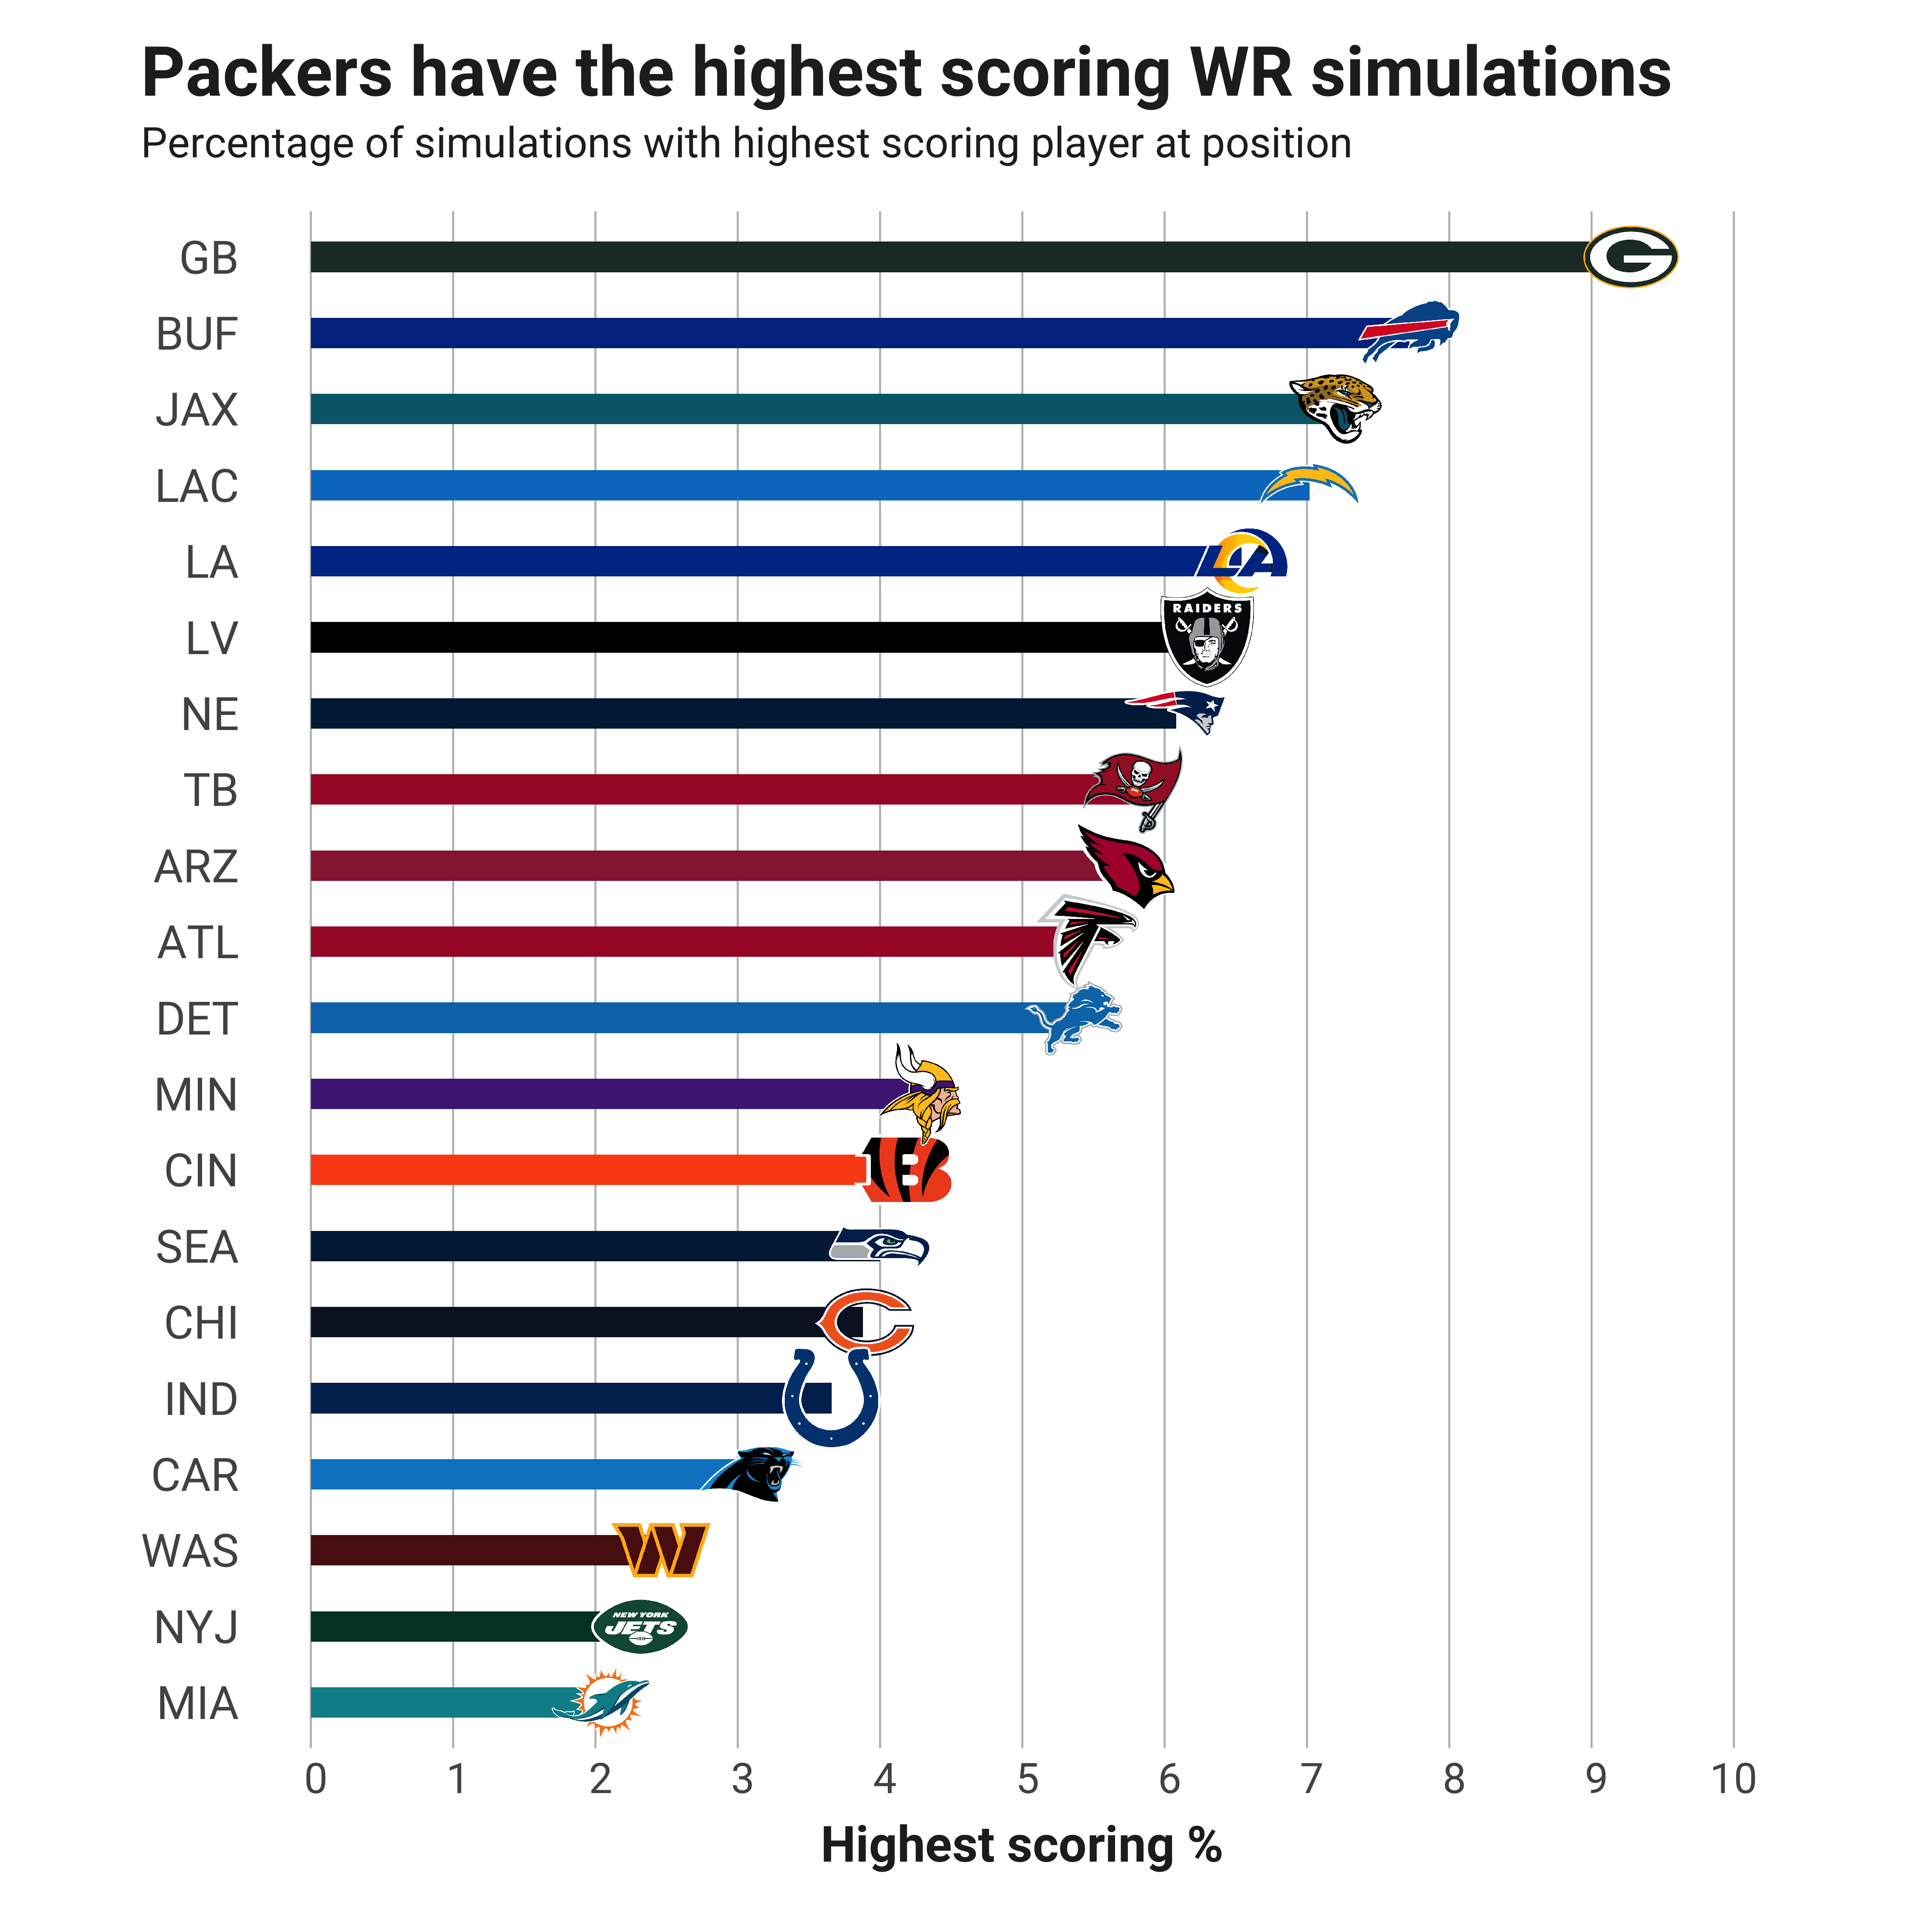
| Highest % | Player | Team | Opponent | DK Fpts | DK Salary | FD Fpts | FD Salary |
| 9.3 | Allen Lazard | GB | DET | 13.6 | 6,000 | 11.1 | 6,500 |
| 7.7 | Stefon Diggs | BUF | NYJ | 17.8 | 8,400 | 14.0 | 8,900 |
| 7.2 | Christian Kirk | JAX | LV | 13.7 | 5,500 | 10.9 | 6,300 |
| 7.0 | Josh Palmer | LAC | ATL | 12.5 | 5,100 | 9.9 | 6,200 |
| 6.5 | Cooper Kupp | LA | TB | 21.1 | 8,900 | 16.3 | 9,000 |
| 6.3 | Davante Adams | LV | JAX | 17.9 | 8,100 | 14.0 | 8,100 |
| 6.1 | Jakobi Meyers | NE | IND | 13.2 | 5,400 | 10.3 | 6,800 |
| 5.8 | Mike Evans | TB | LA | 19.2 | 7,200 | 15.2 | 7,700 |
| 5.7 | DeAndre Hopkins | ARZ | SEA | 19.5 | 7,900 | 15.2 | 8,600 |
| 5.5 | Drake London | ATL | LAC | 15.9 | 4,900 | 12.5 | 5,600 |
| 5.4 | Amon-Ra St. Brown | DET | GB | 14.7 | 6,600 | 11.2 | 7,100 |
| 4.3 | Justin Jefferson | MIN | WAS | 18.8 | 8,600 | 14.8 | 9,000 |
| 4.2 | Tee Higgins | CIN | CAR | 19.7 | 7,300 | 15.7 | 8,000 |
| 4.0 | D.K. Metcalf | SEA | ARZ | 15.7 | 6,400 | 12.6 | 7,400 |
| 3.9 | Darnell Mooney | CHI | MIA | 11.2 | 4,700 | 8.9 | 6,100 |
| 3.7 | Michael Pittman Jr. | IND | NE | 12.6 | 6,800 | 9.8 | 6,400 |
| 3.1 | D.J. Moore | CAR | CIN | 18.1 | 5,800 | 14.0 | 7,000 |
| 2.5 | Terry McLaurin | WAS | MIN | 13.5 | 5,900 | 10.6 | 7,200 |
| 2.3 | Garrett Wilson | NYJ | BUF | 12.9 | 4,800 | 10.2 | 5,800 |
| 2.0 | Tyreek Hill | MIA | CHI | 23.2 | 8,500 | 18.1 | 8,700 |
TIGHT ENDS
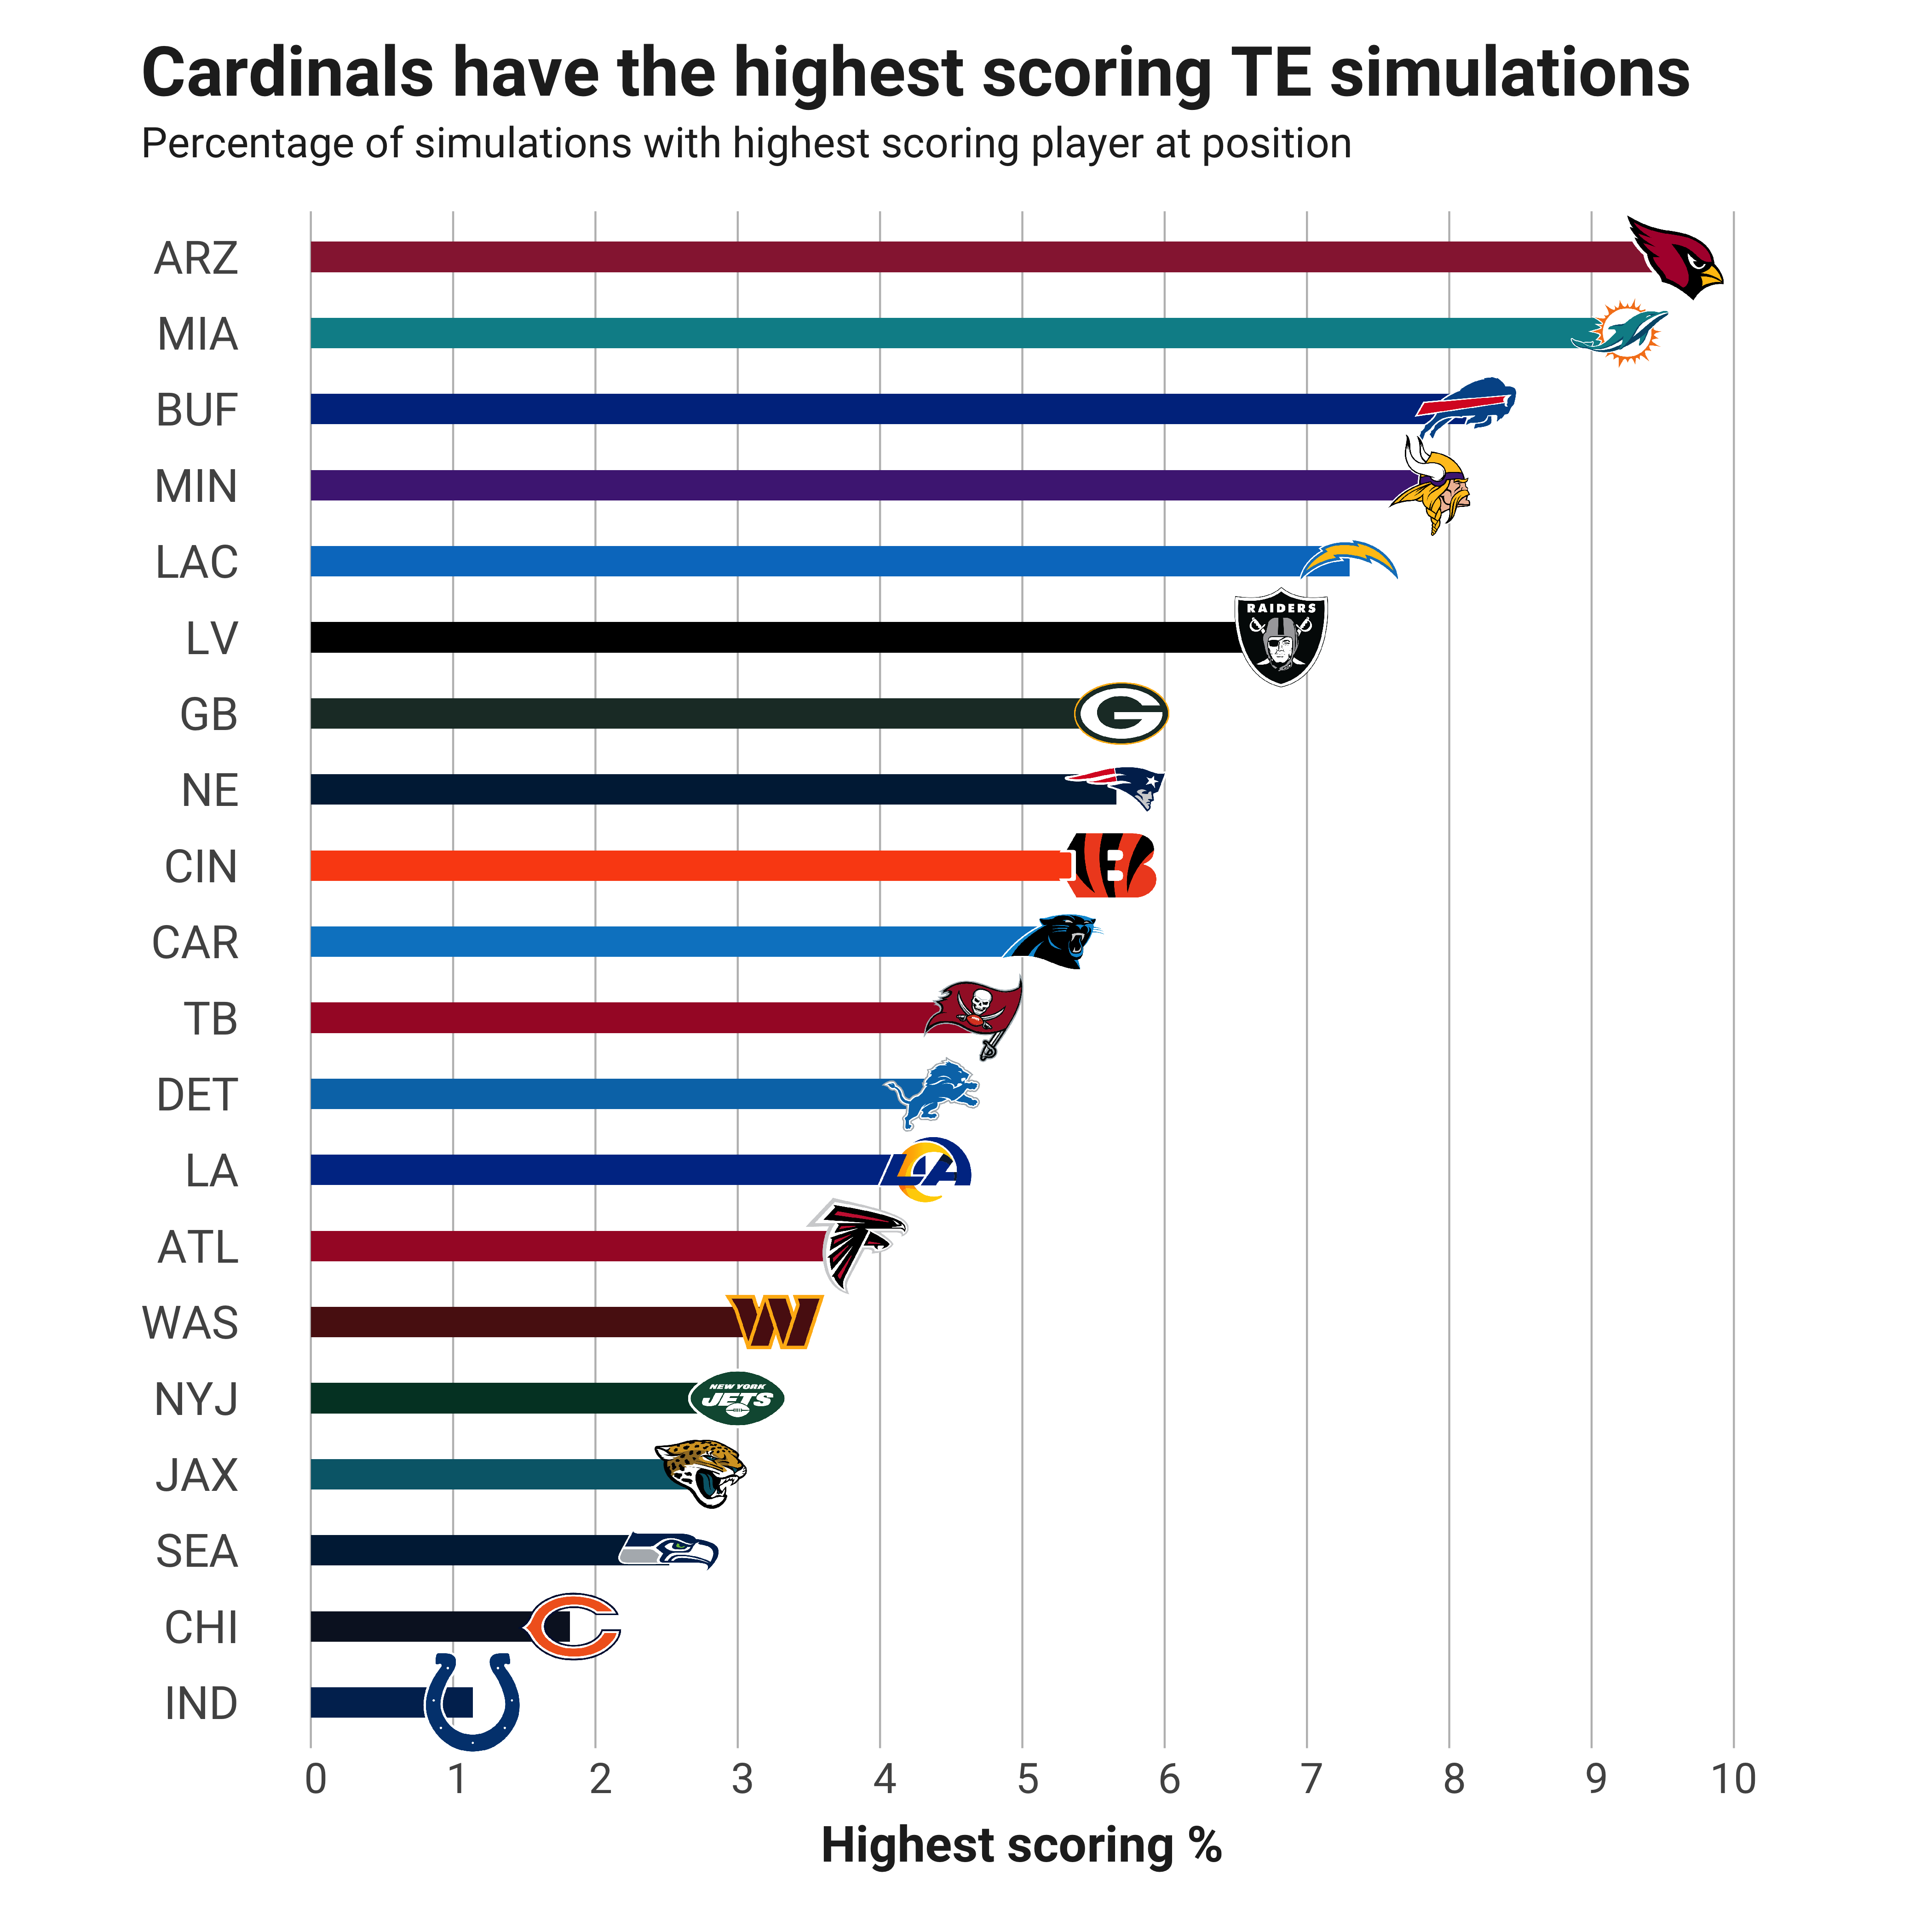
| Highest % | Player | Team | Opponent | DK Fpts | DK Salary | FD Fpts | FD Salary |
| 9.6 | Zach Ertz | ARZ | SEA | 10.6 | 5,100 | 8.3 | 6,600 |
| 9.2 | Mike Gesicki | MIA | CHI | 8.0 | 4,000 | 6.5 | 5,500 |
| 8.1 | Dawson Knox | BUF | NYJ | 10.2 | 3,500 | 8.2 | 5,100 |
| 7.9 | T.J. Hockenson | MIN | WAS | 9.5 | 5,000 | 7.6 | 6,200 |
| 7.3 | Gerald Everett | LAC | ATL | 12.4 | 4,800 | 9.8 | 5,800 |
| 6.8 | Darren Waller | LV | JAX | 10.0 | 4,900 | 7.9 | 6,000 |
| 5.7 | Robert Tonyan | GB | DET | 11.3 | 3,800 | 9.0 | 5,000 |
| 5.7 | Hunter Henry | NE | IND | 8.0 | 3,000 | 6.4 | 4,700 |
| 5.6 | Hayden Hurst | CIN | CAR | 9.6 | 3,600 | 7.6 | 5,300 |
| 5.2 | Tommy Tremble | CAR | CIN | 5.3 | 2,700 | 4.2 | 4,500 |
| 4.7 | Cade Otton | TB | LA | 7.5 | 3,100 | 6.0 | 4,800 |
| 4.4 | Brock Wright | DET | GB | 8.8 | 2,500 | 6.9 | 4,400 |
| 4.3 | Tyler Higbee | LA | TB | 11.3 | 3,700 | 8.7 | 6,100 |
| 3.8 | Kyle Pitts | ATL | LAC | 13.0 | 4,500 | 10.4 | 6,300 |
| 3.3 | Logan Thomas | WAS | MIN | 6.3 | 2,900 | 5.0 | 5,000 |
| 3.0 | Tyler Conklin | NYJ | BUF | 6.8 | 3,200 | 5.2 | 5,200 |
| 2.7 | Evan Engram | JAX | LV | 9.0 | 3,300 | 7.0 | 5,200 |
| 2.5 | Noah Fant | SEA | ARZ | 7.9 | 2,900 | 6.2 | 4,800 |
| 1.8 | Cole Kmet | CHI | MIA | 7.6 | 3,000 | 5.9 | 4,700 |
| 1.1 | Kylen Granson | IND | NE | 3.2 | 2,700 | 2.5 | 4,400 |
DEFENSE/SPECIAL TEAMS

| Highest % | Player | Team | Opponent | DK Fpts | DK Salary | FD Fpts | FD Salary |
| 8.9 | Bengals | CIN | CAR | 10.6 | 4,000 | 10.6 | 4,400 |
| 8.8 | Chargers | LAC | ATL | 6.5 | 3,400 | 6.5 | 3,900 |
| 8.4 | Patriots | NE | IND | 7.7 | 4,100 | 7.7 | 4,900 |
| 8.2 | Bills | BUF | NYJ | 8.8 | 4,300 | 8.8 | 5,000 |
| 8.0 | Vikings | MIN | WAS | 7.6 | 3,500 | 7.6 | 4,500 |
| 7.7 | Dolphins | MIA | CHI | 9.6 | 3,800 | 9.6 | 3,600 |
| 7.1 | Buccaneers | TB | LA | 6.8 | 3,000 | 6.8 | 4,700 |
| 7.0 | Raiders | LV | JAX | 6.7 | 3,200 | 6.7 | 3,500 |
| 5.9 | Packers | GB | DET | 7.1 | 3,700 | 7.1 | 4,100 |
| 5.9 | Cardinals | ARZ | SEA | 7.3 | 2,900 | 7.3 | 4,000 |
| 5.3 | Falcons | ATL | LAC | 5.4 | 2,800 | 5.4 | 3,100 |
| 4.9 | Seahawks | SEA | ARZ | 6.2 | 2,500 | 6.2 | 4,100 |
| 4.7 | Jets | NYJ | BUF | 5.2 | 2,000 | 5.2 | 3,400 |
| 4.2 | Colts | IND | NE | 6.7 | 2,700 | 6.7 | 4,200 |
| 3.9 | Jaguars | JAX | LV | 5.7 | 3,100 | 5.7 | 3,800 |
| 3.8 | Rams | LA | TB | 4.3 | 3,300 | 4.3 | 4,300 |
| 3.5 | Lions | DET | GB | 3.5 | 2,600 | 3.5 | 3,200 |
| 3.4 | Panthers | CAR | CIN | 5.4 | 2,300 | 5.4 | 3,300 |
| 3.3 | Commanders | WAS | MIN | 5.8 | 2,400 | 5.8 | 3,700 |
| 1.6 | Bears | CHI | MIA | 5.6 | 2,500 | 5.6 | 3,000 |
METHODOLOGY
For each game on the DFS Sunday main slate, I looked through thousands of NFL matchups from 2014-2022 and found the closest analogies according to the following parameters: betting spread, over/under and average fantasy points scoring for the top-ranked positional players of both rosters (QB1, RB1, WR1, TE1).
Once I find the 75 most similar matchups for each upcoming game, I simulate the main slate 10,000 times by randomly choosing one of the 75 matchups for each game. Then, I find the highest-scoring quarterback, running back, wide receiver, tight end and D/ST on the entire slate.
The last step is totaling the number of times a particular team shows up as the top option for the slate at each position and dividing by the total simulations. That number is what I call the “highest-scoring %” in the team-labeled bar charts below. Below the charts, I join the highest-projected player on that team for the position, then list their projected fantasy points and salaries for DraftKings and FanDuel.
