One of the advantages of being a “data scientist” is that everyone assumes you know what you’re talking about. While that has its privileges, more important to the craft is the ability to leverage statistical programming packages like R and Python and apply them to almost any questions that can be answered through data.
Recently I started publishing analyses on the single-game DraftKings showdown slates that use the combination of current projections, historical game results and similarity algorithms to simulate an upcoming game by looking back at the most similar historical matchups. In this analysis I’m taking the same outline and applying it instead to the DFS main slate by projecting the likelihood each individual QB, RB, WR, TE, and DST option will be the highest-scoring of the slate. In doing this, we can find the unlikely tournament plays who may not have been on your radar.
British statistician George E.P. Box once said, “All models are wrong, but some are useful,” and that’s the mindframe you should bring to this analysis. The numbers below are not “right” in the traditional sense of maximizing accuracy, which would only mimic the recommendations you’ll find throughout the DFS toutersphere. The numbers below are harnessing the unexpected connections and reactions between players that have actually happened over the past several years, and thereby points to under/overvalued players that won’t be identified through traditional projections and logical deduction.
Methodology
For each game on the DFS Sunday main slate, I looked through thousands of NFL matchups from 2012-2018 and found the closest analogies according to the following parameters: Betting spread, over/under, average fantasy points scoring for the top-ranked positional players of both rosters (QB1, RB1, WR1, TE1).
Once I find the 75 most similar matchups for each upcoming game, I then simulate the main slate 10K times by randomly choosing one of the 75 matchups for each game and then find the highest-scoring QB, RB, WR, TE and DST on the entire slate.
Every match of historical and current games is not perfect, but by matching 75 different matchups to each game and simulating 10K times we can smooth out the bumps and get a strong picture of how a slate of similar games would have played out.
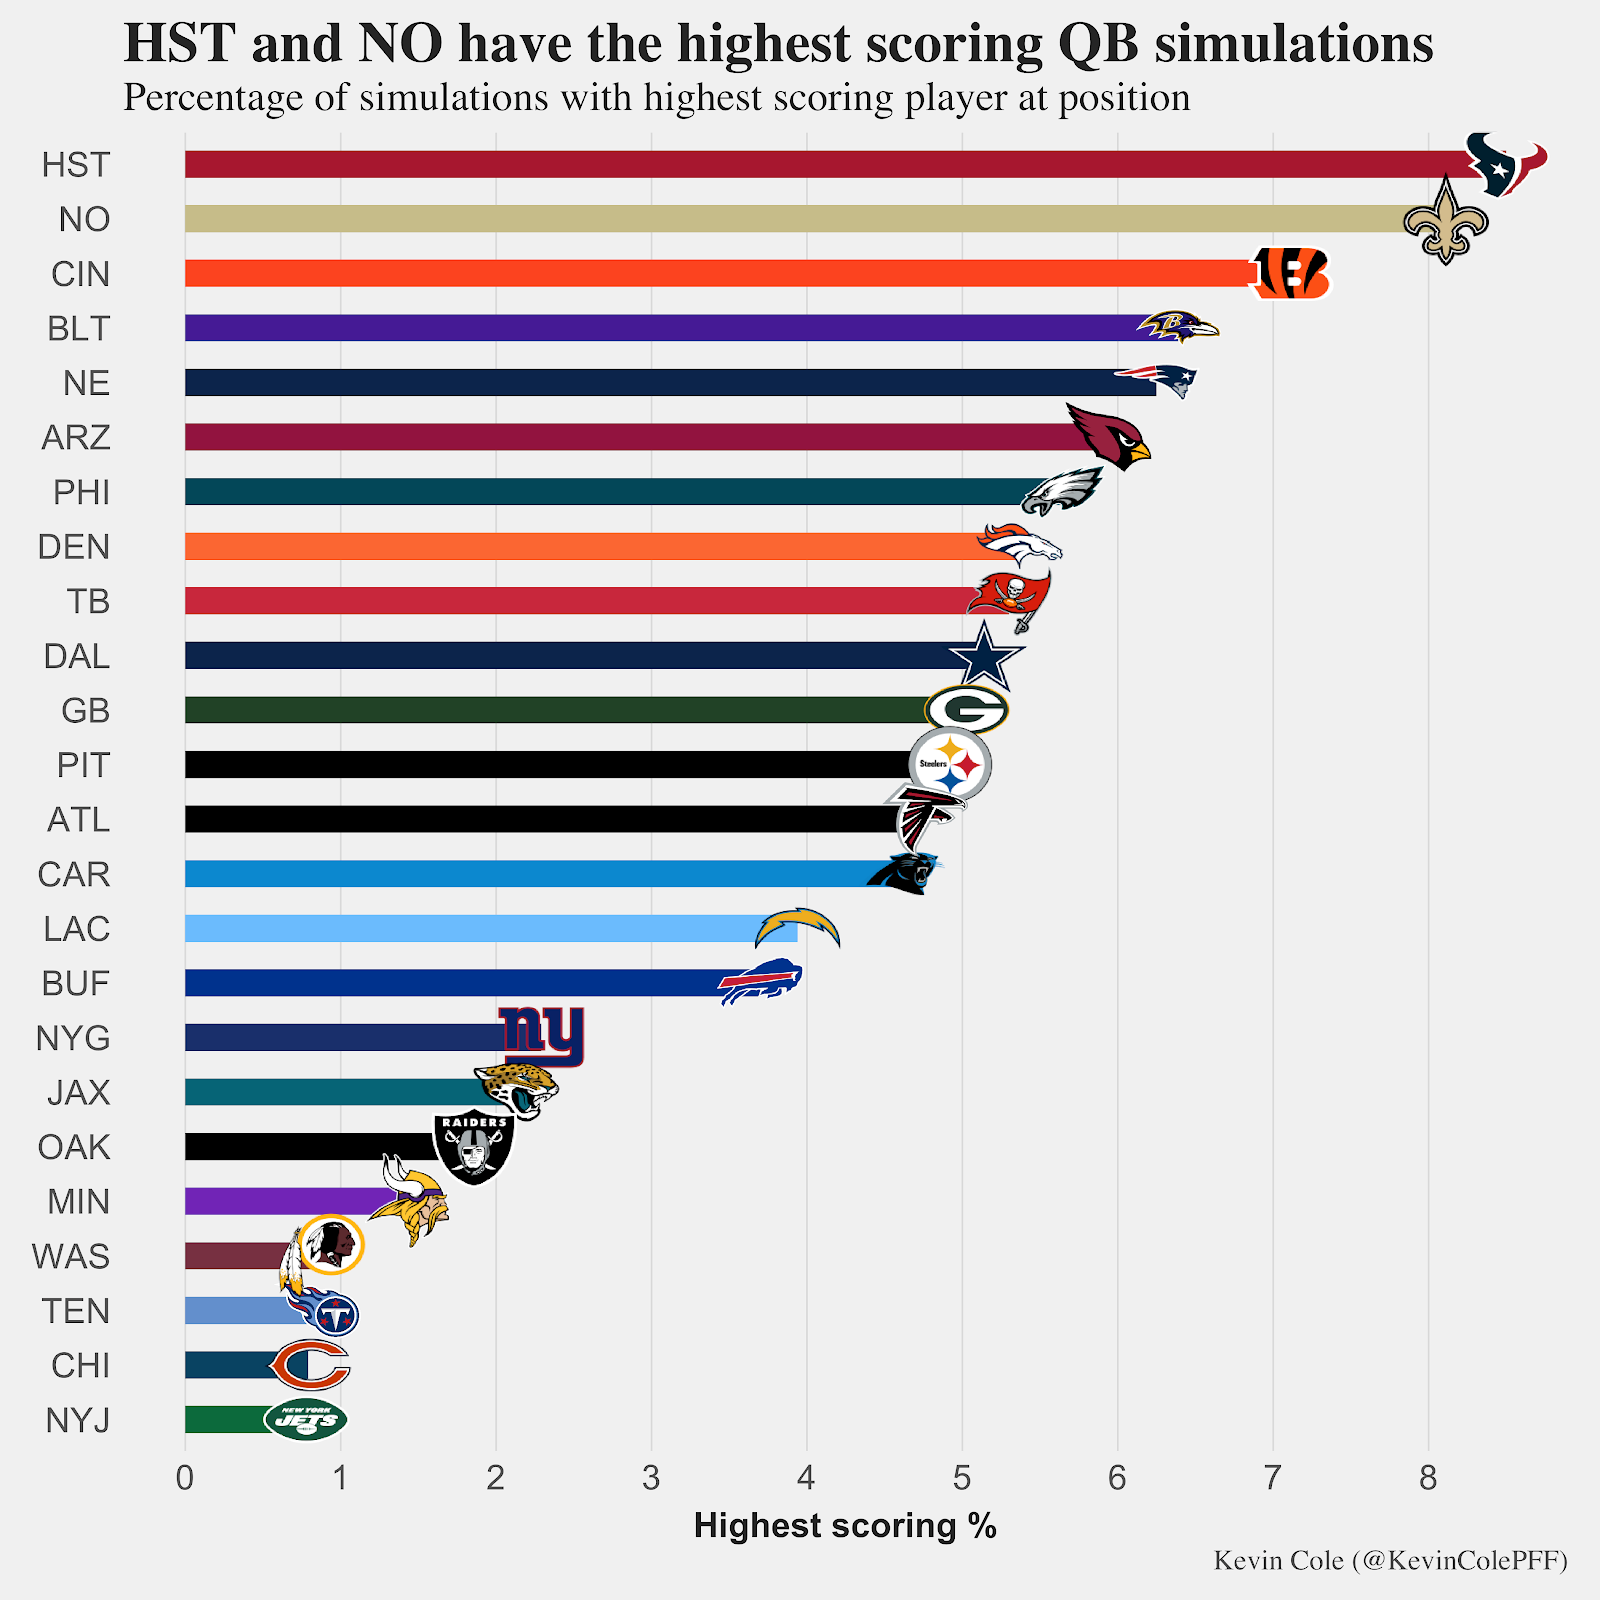
The last step is totaling up the number of times that a particular team shows up as the top option for the slate at each position and divide by the total simulations. That number is what I call “highest-scoring %” in the bar charts below labeled by team. Below the bar charts by team, I join the highest projected player on that team for the position and list his projected fantasy points and salaries for DraftKings and FanDuel.
Quarterbacks
| Pos | Highest % | Player | Team | DK Fpts | DK Salary | FD Fpts | FD Salary |
| QB | 8.50 | Deshaun Watson | HST | 23.1 | 6,700 | 21.7 | 8,000 |
| QB | 8.11 | Teddy Bridgewater | NO | 16.4 | 5,200 | 15.4 | 7,200 |
| QB | 7.11 | Andy Dalton | CIN | 19.9 | 5,700 | 18.7 | 7,500 |
| QB | 6.39 | Lamar Jackson | BLT | 21.6 | 7,100 | 20.4 | 8,300 |
| QB | 6.25 | Tom Brady | NE | 20.4 | 6,500 | 18.9 | 7,600 |
| QB | 5.94 | Kyler Murray | ARZ | 17.4 | 6,300 | 16.7 | 7,400 |
| QB | 5.65 | Carson Wentz | PHI | 21.0 | 6,100 | 19.4 | 7,800 |
| QB | 5.37 | Joe Flacco | DEN | 14.7 | 4,700 | 13.7 | 6,600 |
| QB | 5.30 | Jameis Winston | TB | 21.2 | 6,200 | 19.3 | 7,600 |
| QB | 5.14 | Dak Prescott | DAL | 20.7 | 6,000 | 19.6 | 8,200 |
| QB | 5.03 | Aaron Rodgers | GB | 18.0 | 6,000 | 17.0 | 7,800 |
| QB | 4.92 | Mason Rudolph | PIT | 16.0 | 5,100 | 15.2 | 6,500 |
| QB | 4.76 | Matt Ryan | ATL | 19.7 | 5,900 | 18.2 | 7,700 |
| QB | 4.61 | Kyle Allen | CAR | 17.8 | 5,100 | 16.9 | 6,500 |
| QB | 3.94 | Philip Rivers | LAC | 19.9 | 5,800 | 18.6 | 7,700 |
| QB | 3.70 | Matt Barkley | BUF | 13.7 | 4,600 | 13.0 | 6,300 |
| QB | 2.29 | Daniel Jones | NYG | 16.2 | 5,600 | 15.3 | 7,000 |
| QB | 2.13 | Gardner Minshew | JAX | 14.7 | 5,300 | 14.1 | 6,600 |
| QB | 1.86 | Derek Carr | OAK | 16.6 | 5,000 | 15.4 | 6,600 |
| QB | 1.43 | Kirk Cousins | MIN | 18.8 | 5,300 | 17.6 | 6,800 |
| QB | 0.88 | Case Keenum | WAS | 14.1 | 4,600 | 13.1 | 6,400 |
| QB | 0.85 | Marcus Mariota | TEN | 17.3 | 4,900 | 16.5 | 6,900 |
| QB | 0.79 | Chase Daniel | CHI | 18.3 | 4,800 | 17.3 | 6,500 |
| QB | 0.78 | Sam Darnold | NYJ | 14.3 | 5,400 | 13.7 | 6,700 |
