Offensive line play is one of the more interesting aspects of football to study, and while not as important or glamorous as what a quarterback or receiver does, a good offensive line can take an offense to the next level.
At PFF, we are as prepared as anyone to study the trenches, with our play-by-play data going back to 2006 for the NFL and 2014 for FBS. Preliminary studies show that our grades and underlying data do a good job of projecting offensive linemen from the collegiate level to the pro level, which is good news for a league that has seen a downswing in offensive line play for the better part of the last decade.
However, context matters, and as we approach draft and free agency, it’s important to know where and when to look for insights when it comes to evaluating linemen. In pass protection, there are a number of things that can skew data. Does an offense throw an outsized number of quick passes or screens (think Andre Dillard from Washington State)? Did the player you’re scouting play in a conference that rushes fewer players than the national average (think Big 12)?
Today, we want to look at what constitutes a “true pass set” — a set of play features for which evaluation is the most stable and predictive. While a robust analysis (and one we use in our internal models for projecting pass protectors from college to pro) would let a model sort out the thresholds and the weighting of each feature, there is some value in having quick and dirty heuristics by which to go. We build a set of these here.
All Plays
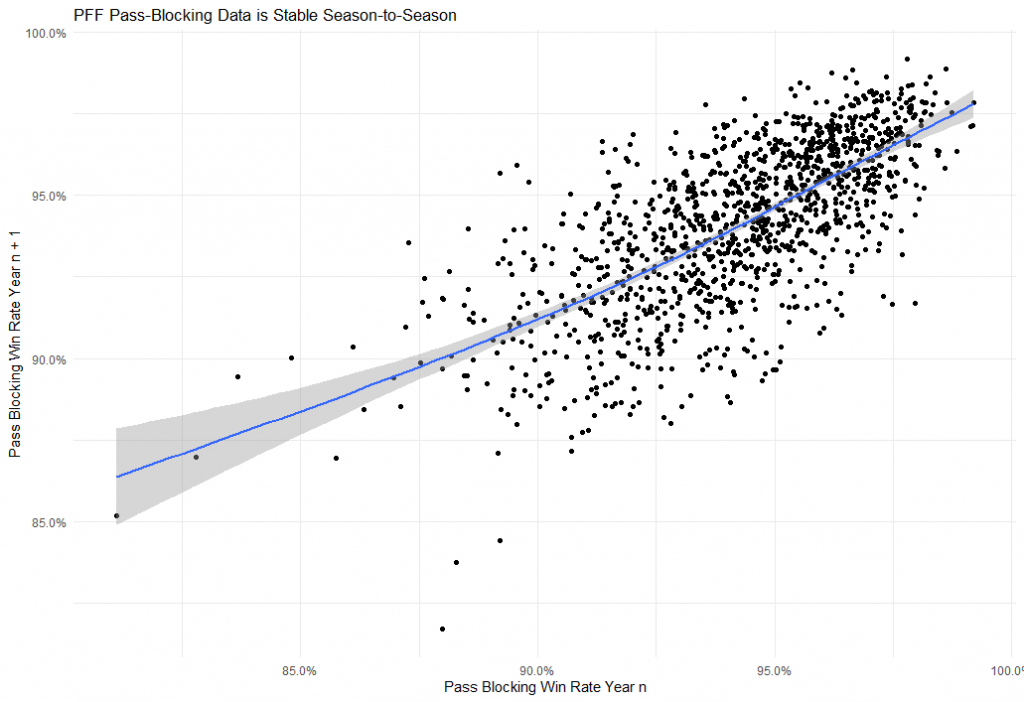
First off, our pass-blocking data is about as stable and predictive as it gets when it comes to player evaluation — even without omitting the noisy plays.
| Pressure Allowed/Play | Sack/Play | Grade/Play | Win Rate |
| 0.66 | 0.40 | 0.69 | 0.70 |
Correlation coefficients for various pass-blocking metrics. Minimum 400 pass-blocking snaps from 2006-2019. Offensive linemen (LT-RT) only. N = 1255 player seasons.
Firstly, it’s encouraging that while all of these numbers are high, they are not the same (so, they measure slightly different things). There are plays where an offensive lineman doesn’t “win” but also doesn’t allow pressure, and vice versa. Sacks allowed, while not a disastrous or unstable statistic, is significantly less stable than the process that generates sacks (pressure).
Some of our play-level data only exists for certain seasons, though. For example, time to throw data is not available from 2008-2010 (we graded 2006 and 2007 retroactively). Dropback-related data is only available from 2012 and onwards.
| Pressure Allowed/Play | Sack/Play | Grade/Play | Win Rate |
| 0.61 | 0.33 | 0.67 | 0.67 |
Correlation coefficients for various pass-blocking metrics. Minimum 400 pass-blocking snaps from 2012-2019. Offensive linemen (LT-RT) only. N = 666 player seasons.
Throwing Out Screens
Screen plays are more like running plays than passing plays, so proficiency in the screen game is likely not going to project to proficiency in pass protection, and that’s what we see.
| Pressure Allowed/Play | Sack/Play | Grade/Play | Win Rate |
| 0.67 | 0.33 | 0.67 | 0.68 |
Correlation coefficients for various pass-blocking metrics, with screens not included. Minimum 365 non-screen pass-blocking snaps from 2012-2019. Offensive linemen (LT-RT), only. N = 667.
Throwing Out Play-Action Plays
Play-action pass plays have been shown to lead to less stable statistics for quarterbacks, what about offensive linemen?
| Pressure Allowed/Play | Sack/Play | Grade/Play | Win Rate |
| 0.59 | 0.33 | 0.65 | 0.65 |
Correlation coefficients for various pass-blocking metrics, with play-action passes not included. Minimum 310 non-play-action pass-blocking snaps from 2012-2019. Offensive linemen (LT-RT) only. N = 666.
Throwing Out Rollout Plays
Rollouts, while requiring pass protection, change the game for offensive linemen to a degree to which past performances on such plays may not be indicative of future performance.
| Pressure Allowed/Play | Sack/Play | Grade/Play | Win Rate |
| 0.60 | 0.35 | 0.67 | 0.66 |
Correlation coefficients for various pass-blocking metrics, with rollouts not included. Minimum 370 non-roll out pass-blocking snaps from 2012-2019. Offensive linemen (LT-RT), only. N = 666.
Exploring Time to Throw
One of the biggest issues with evaluating offensive linemen is the time required for them to sustain blocks. My colleague, Timo Riske, has done some great work looking at survival curves for offensive lines. One of his key findings is that survival rates for offensive lines are stable between two and four seconds. Thus, it makes sense to throw out plays where time to throw is outside of this interval.
| Pressure Allowed/Play | Sack/Play | Grade/Play | Win Rate |
| 0.57 | 0.31 | 0.64 | 0.63 |
Correlation coefficients for various pass-blocking metrics, with extremely quick and extremely slow passes omitted. Minimum 260 admissible pass-blocking snaps from 2012-2019. Offensive linemen (LT-RT) only. N = 656.
Exploring the Number of Pass-Rushing Players
Fewer pass-rushers means more help, and more help yields fewer true one-on-one matchups from which we can evaluate players. Here, we throw out plays where there were fewer than four pass-rushers.
| Pressure Allowed/Play | Sack/Play | Grade/Play | Win Rate |
| 0.60 | 0.31 | 0.66 | 0.65 |
Correlation coefficients for various pass-blocking metrics, with plays involving fewer than three pass rushers omitted. Minimum 370 admissible pass-blocking snaps from 2012-2019. Offensive linemen (LT-RT) only. N = 667.
The interesting dynamic for all of these subsets is that the process of subsetting yields a data set that is smaller than the original, and in general, more data is better than less data. If the snap threshold was maintained at 400 for both seasons, there would be fewer players, muddying the waters but increasing the reliability of the remaining data in all of the above circumstances. Part of this is due to the fact that the smaller the sample of the players, the higher the likelihood that the players in the sample are more “known commodities” than players who would leave a sample due to snap-size issues.
Nevertheless, it’s telling that the stability in player performance is hardly changed by throwing out screens, play-action passes, rollouts, extreme times to throw and plays with hardly any pass-rushers. Thus, when looking to evaluate pass blockers, a good rule of thumb is to look at plays:
- Without play action
- Without a screen
- Without a rollout
- With time to throw between two and four seconds
- With more than a three-man rush
Additionally, if a team is saddled with an offensive line that is devoid of talent, they should run play-action, make use of screens and rollouts and get rid of the ball quickly.
Are All of These Plays a Waste of Time and Data?
No. Through the power of statistics, we control for these variables and properly weigh these pass-blocking snaps. Doing so, we can create a win rate above expectation, which is the average of the play-by-differences between pass-blocking outcome (1 for a win, 0 for a loss) and expected pass-blocking success (e.g., 0.96). With the Senior Bowl starting next week, here are the top players from that game when viewing pass-blocking from this lense:
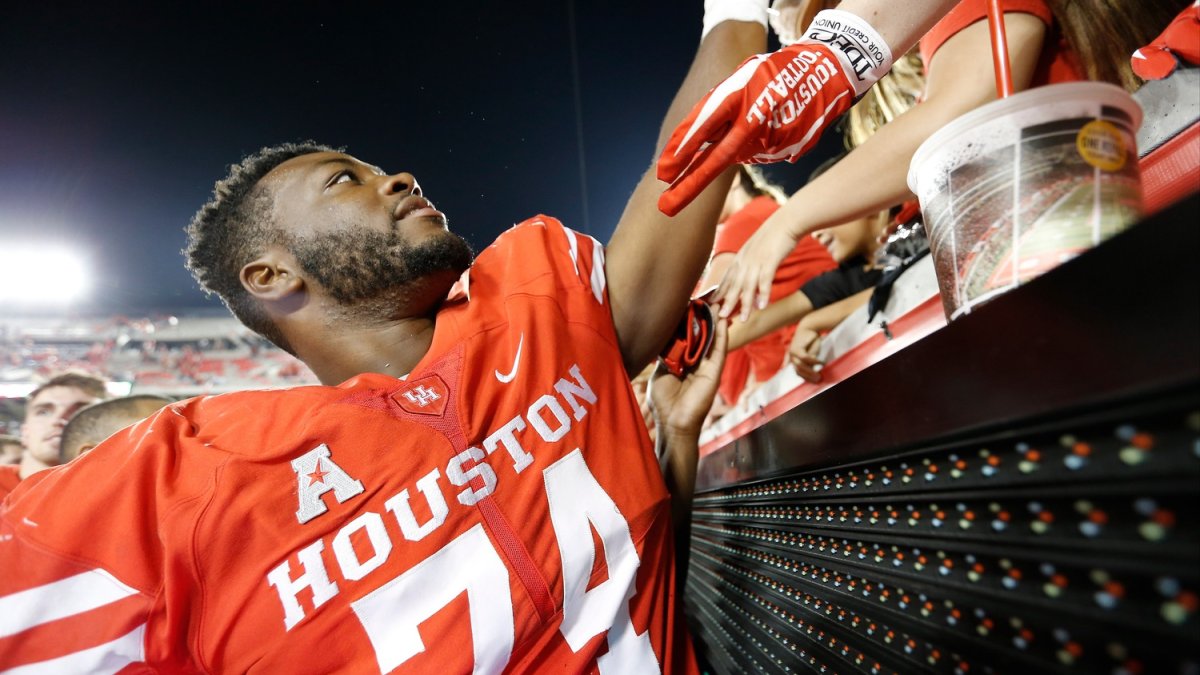
| Player | School | Win Rate Above | Actual Win Rate |
| Josh Jones | Houston | 2.9% | 96.0% |
| Matt Peart | UConn | 2.7% | 95.3% |
| Colton McKivitz | West Virginia | 2.3% | 94.8% |
| Keith Ismael | San Diego State | 2.0% | 96.4% |
| Jonah Jackson | Ohio State | 2.0% | 96.4% |