[Editor's Note: This article was originally published on February 4, 2020 and was republished in light of the New England Patriots signing Cam Newton on June 28, 2020.]
The PFF play-by-play grading system does a great job of isolating each player’s role in production, and when it comes to quarterback play, we believe it isolates their contribution on each play as well as any metric.
While the overall grade is both descriptive and predictive, the beauty of the PFF system is using the entire database to pair the grade with the best pieces of data to better predict future performance. Based on the excellent work done by PFF’s R&D team in the QB Annual, we are better able to isolate the parts of a quarterback’s performance that are most stable from year to year and that are difficult to sustain.
[Editor's Note: Subscribe to PFF's EDGE or ELITE subscription to dive into PFF's 2020 QB Annual. Download your copy of PFF's 2020 QB Annual here if you're already a subscriber.]
We have seen that a quarterback’s negatively graded throws are more stable than their positives, meaning those positives may fluctuate greatly from year to year. Not only is this information useful in predicting future outcomes, but it helps us look back to find outlier seasons through the years. It’s a difficult concept for many fans to grasp, as these outlier seasons are often viewed as natural growth for a quarterback or perhaps a turning point, but more often than not, they are merely a one-off campaign in which everything came together for the quarterback. Let’s dive into what makes an outlier season and which ones stand out most from the past decade.
Finding outliers: Look at positively graded throws, play action and performance under pressure
This is one place where football intuition matches the data. If positively graded throws are less stable, that means they’re dependent on something, and that something is the play-calling and supporting cast. Receivers must get open, the offensive line must block well and play-callers must put those receivers in position to win. And how well an offense performs those tasks will dictate how many opportunities a quarterback has to make positive plays. Because a quarterback’s ecosystem is subject to change from year to year, the positively graded throws will change with it, and thus, the football intuition that a good supporting cast does influence a quarterback’s production is correct.
On the negative side, no matter who a quarterback is passing to, his ability to hit throws generally stays the same. The quarterback controls his negatives more than he controls his positives, and that’s why so many quarterbacks around the league can put up big seasons statistically in a good ecosystem — but it’s often difficult to sustain it. Two other unstable pieces of data are play action and performance under pressure. The play-action game is favorable for the quarterback in general, and given its relatively low usage (under 40%) and the wide range of outcomes, monster years are possible off play action alone. Performance under pressure is another smaller sample size that can lead to high-end outcomes, and many of the top outlier seasons featured incredible, yet unsustainable, seasons when facing pressure.
The common thread among outlier seasons is the increase in positively graded throws due to a more favorable situation combined with play action and pressure playing a key role.
Performance Outliers
Since 2010, the elite PFF passing seasons have been dominated by Tom Brady, Drew Brees, Aaron Rodgers, and Peyton Manning — they make up 50% of the top 50 seasons by PFF grade. When this list is expanded to the next tier of quarterbacks to include Ben Roethlisberger, Russell Wilson, Matt Ryan, Andrew Luck and Philip Rivers, those eight signal-callers make up 82.0% of the top 50. Perhaps Patrick Mahomes and Lamar Jackson are ready to join this list on an annual basis, but there’s been a clear line that separates the league’s best quarterbacks through the years. Here’s a look at the few seasons that bucked the trend and saw quarterbacks rank among the elite in one-off years.
NFL ranks in percentage of positively graded throws
| Eli Manning |
Robert Griffin III |
Cam Newton |
Carson Palmer |
Ryan Tannehill |
|
| 2010 | 4th | 8th | |||
| 2011 | 5th | 13th | 11th | ||
| 2012 | 6th | 2nd | 13th | 22nd | 21st |
| 2013 | 15th | 19th | 6th | 9th | 5th |
| 2014 | 5th | 35th | 2nd | 21st | 15th |
| 2015 | 21st | 1st | 2nd | 28th | |
| 2016 | 27th | 10th | 9th | 19th | |
| 2017 | 28th | 6th | 11th | ||
| 2018 | 30th | 12th | 35th | ||
| 2019 | 1st |
2011 Eli Manning, New York Giants
2011 Grade: 87.4
Second-best season: 81.1, 2012
As Manning embarks on his retirement journey, the Hall of Fame discussions have begun, and the 2011 season is the one to point to for the best performance of his career. It was his highest-ranking campaign in positively graded throws — and by far his best when facing pressure (80.2 grade) — and easily topped his next-best season grade of 70.6 in 2009. Not only did Manning perform well under pressure, he endured the third-highest pressure rate in the league that year and threw for 700 more yards than the next-closest quarterback when facing the heat, including the playoffs. Manning hung in behind a poor offensive line and made big-time throws all season.
| Passing Grade Under Pressure | |
| 2006 | 55.6 |
| 2007 | 44.6 |
| 2008 | 39.8 |
| 2009 | 70.6 |
| 2010 | 68.3 |
| 2011 | 80.2 |
| 2012 | 54.6 |
| 2013 | 52.0 |
| 2014 | 29.6 |
| 2015 | 40.5 |
| 2016 | 33.0 |
| 2017 | 42.2 |
| 2018 | 36.1 |
The other aspect of Manning’s career year was a versatile mix of playmakers, as the Giants had wide receivers Hakeem Nicks and Victor Cruz both grading around 80.0 overall, while Mario Manningham was an excellent No. 3 option. Tight end Jake Ballard emerged as a middle-of-the-field threat, and running back Ahmad Bradshaw added a nice backfield option. Manning’s 2011 season was more than just a Super Bowl run, it was the best season of his career and one of the biggest outliers we’ve seen.
2012 Robert Griffin III, Washington Redskins
2012 Grade: 81.4
Second-best season: 65.9, 2013
This is an obvious outlier season, but RG3’s 2012 campaign was so good, we were rethinking the Colts’ decision to draft Andrew Luck just ahead of him. Instead, we realize that Griffin’s year was a classic outlier of scheme-driven opportunities and a reliance on play action that is simply not sustainable. Griffin ranked second in the league in positively graded throws, a number he never came close to approaching in his only other years as a starter, while averaging a ridiculous 11.8 yards/attempt when using play action compared to just 5.8 with no play action. That stat should have been the biggest red flag for sustainability, as the six-yard difference was the biggest in the league that season. While Griffin’s skillset allowed for more open throws and a play-action heavy approach, his venture into more dropback passing looks did not work well in 2013, and his rookie season was clearly a well-schemed anomaly.
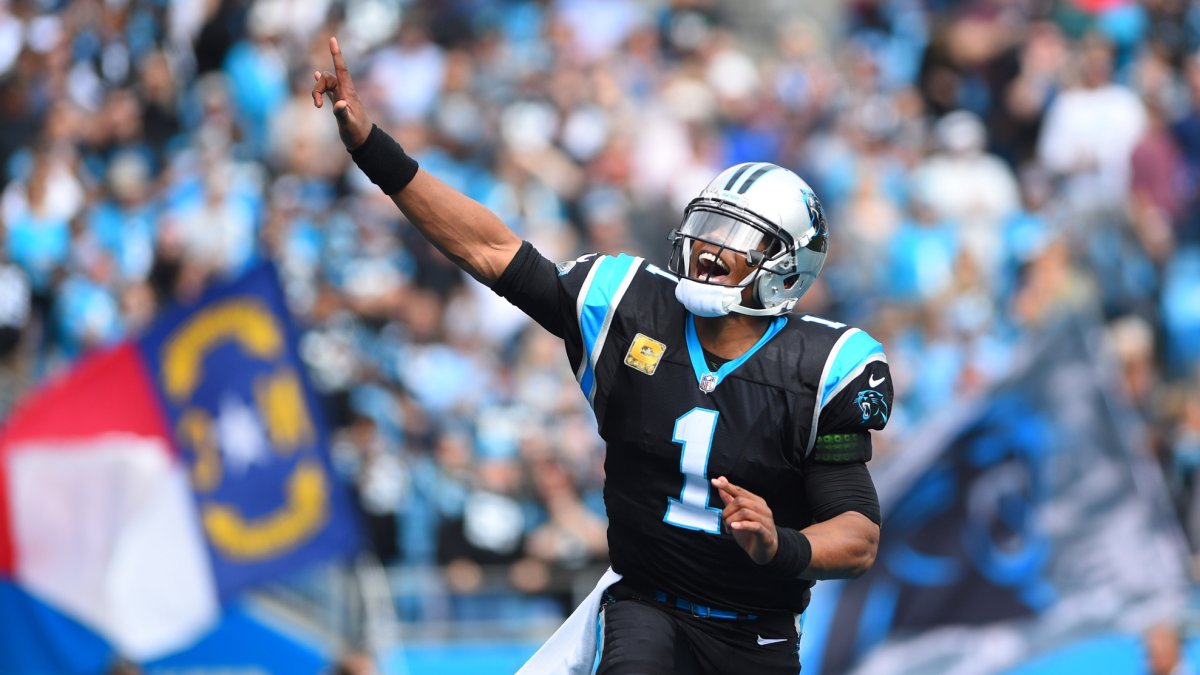
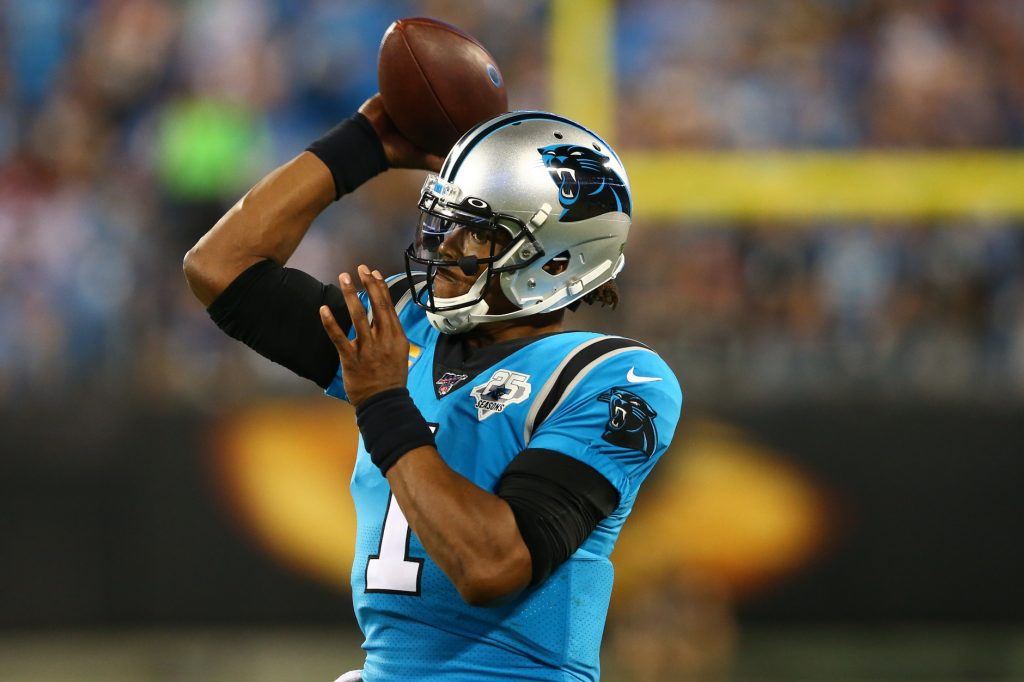
2015 Cam Newton, Carolina Panthers
2015 Grade: 86.5
Second-best season: 76.1, 2014
Newton’s 2015 season looks nothing like the rest of his career, though it showed off his potential as he put it all together for this one MVP campaign. After years of trying to get big-bodied receivers for Newton, this iteration of the Panthers' passing attack featured a healthier mix of size, speed and a versatile tight end in Greg Olsen. Newton had the highest percentage of positively graded throws in the league in 2015, and he’s finished in the top five just one other time in his career. This was a classic case of Newton not cutting down on his negatives, as he’s ranked between 22nd and 34th at avoiding negatives in every year of his career — 2015 was no different. The difference was Newton taking advantage of his increased opportunities down the field while also becoming an integral part of the designed run game. While Newton deserves credit for an incredible run during the 2015 season, it’s the only season in which he’s graded above 76.1 overall, highlighting that his career has been good, but not great or Hall-of-Fame worthy.
2015 Carson Palmer, Arizona Cardinals
2015 Grade: 88.8
Second-best season: 74.8, 2006
Palmer was right there with Newton in the MVP race in 2015, and he finished second in percentage of positively graded throws. It was Palmer’s only top-five finish in that department, as he took advantage of perhaps the most well-rounded receiving corps in the league. Palmer had a deep threat in John Brown, a possession slot receiver in Larry Fitzgerald and a combo wideout in Michael Floyd. The Cardinals’ playmakers posted the highest receiving grade in the league and running back David Johnson was just the icing on the cake with his work out of the backfield. Much like Manning’s 2011 outlier, Palmer went from a career of below-average play against pressure to a season of highlight-reel plays pressure with defenders in his face. Palmer’s 81.0 PFF passing grade under pressure during the regular season was higher than any overall passing grade of his career, showing just how improbable and unlikely it would be to sustain that success. The 2015 version of Palmer was an incredible watch as he fired accurate passes downfield at a high rate, but it was clearly a small sample size of awesome that could not be duplicated.
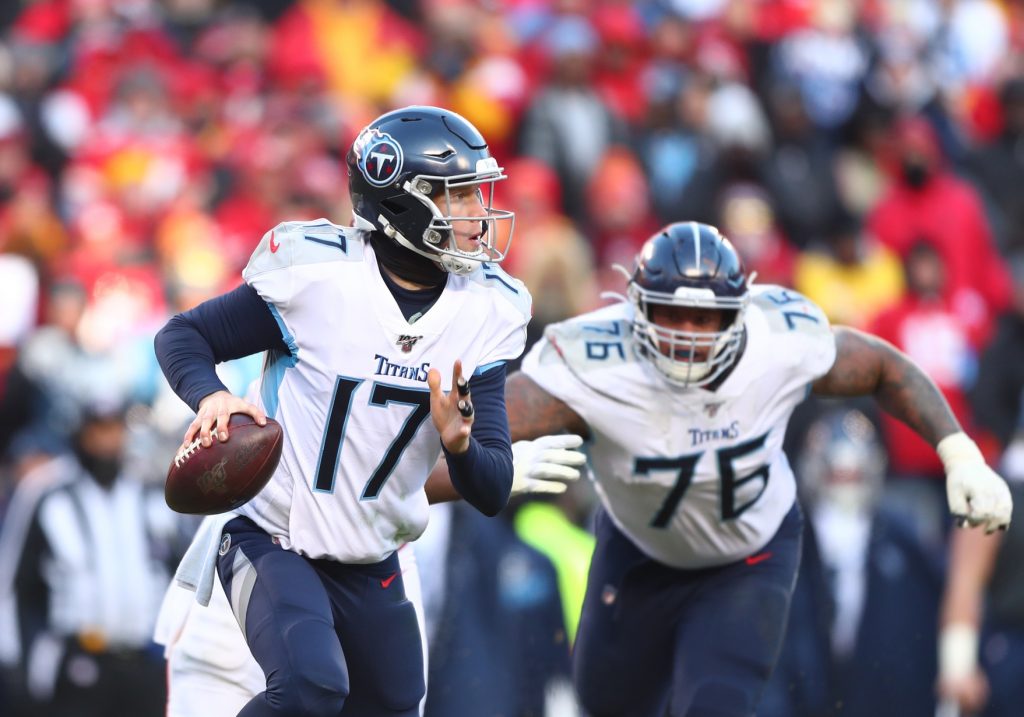
2019 Ryan Tannehill, Tennessee Titans
2019 Grade: 90.2
Second-best season: 80.4, 2013
Look no further than Tannehill from this past season as he turned a career of mediocrity into one of the best seasons in the league. After Tannehill took over as the starter in Week 7, the Titans looked different on offense. He was incredibly accurate down the field and was as good as any quarterback in the league on a throw-for-throw basis in his limited time. Like the others on this list, the unstable positively graded throws tell the story, as Tannehill more than doubled his percentage of positives from 2018 — a near-impossible task. Tannehill struggled in 2018 with the Dolphins, ranking last among quarterbacks in PFF grade despite a 92.5 passer rating that was inflated by playmaker-driven touchdowns and didn’t factor in his poor pocket presence and fumbles. The 2019 version of Tannehill was a precision passer who avoided turnover-worthy plays and added value as a runner. As the Titans look to decide on Tannehill’s future, let the buyer beware, as outlier seasons that are based on a perfect ecosystem of positively graded throws are very difficult to duplicate.
Production Outliers
A quick note about players whose on-field production has not matched their PFF grade:
There are players who elevate their performance, and there are players who have their performance elevated statistically. One of the best parts of the PFF system is the ability to separate performance from the stats, and players who put up better numbers than their grade would indicate are beneficiaries of good playmakers, play calling and some luck. Here are the biggest production outliers of the decade, those quarterbacks whose statistical output surpassed their throw-by-throw grading.
2013 Nick Foles, Philadelphia Eagles
Passer Rating: 119.2 (1st)
ANY/A: 9.18 (1st)
TD%: 8.5% (1st)
PFF Pass Grade: 81.9 (9th)
The famed season that featured 27 touchdowns and two interceptions saw Foles play well, but not to the level that those all-time stats would suggest. Foles was in a perfect storm of Chip Kelly’s new offense taking the league by storm and a downfield passing attack that put receivers behind the defense regularly while also picking up plenty of easy yards in the screen game. Foles has never come close to duplicating his 2013 production.
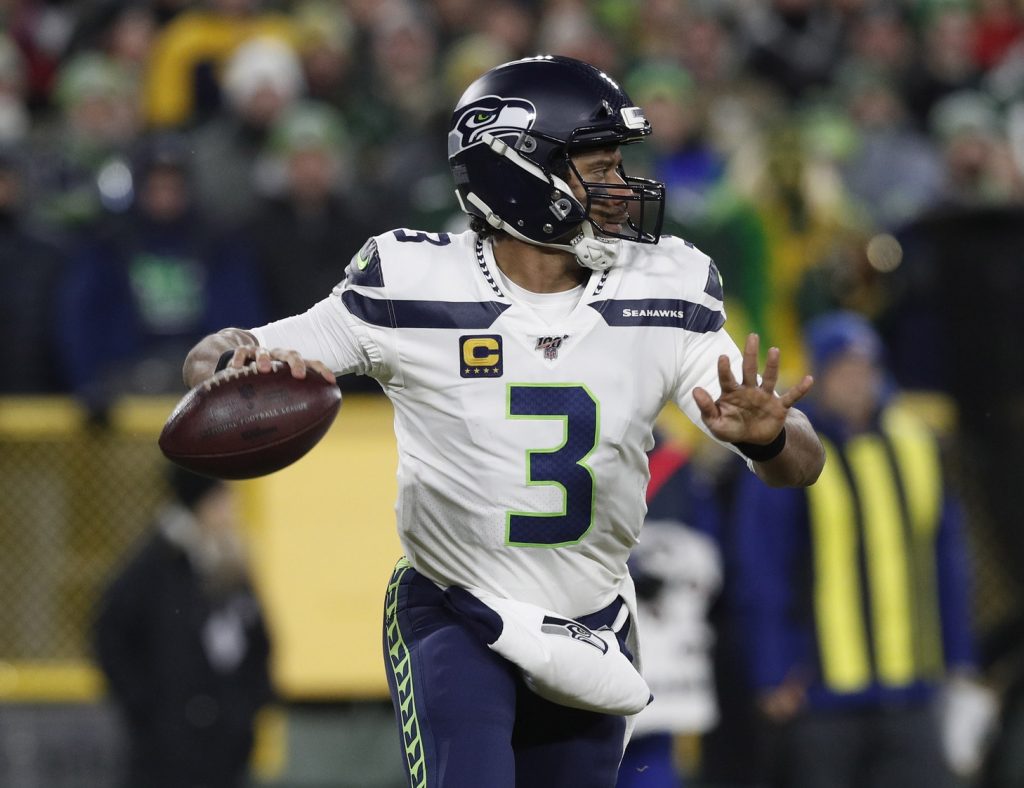
2015 Russell Wilson, Seattle Seahawks
Passer Rating: 110.1 (1st)
ANY/A: 7.73 (3rd)
TD%: 7.0% (2nd)
PFF Pass Grade: 83.7 (6th)
Prior to 2019, the 2015 season was often pointed to as Wilson’s best campaign. And while it was his best statistical effort, it was not at the top in PFF grading. Wilson ranked just 12th in big-time throw percentage, the lowest ranking of his career, and he finished 14th at avoiding turnover-worthy plays. Wilson also had the second-highest percentage of his yards coming after the catch in his career, meaning his stats were inflated more than usual in this 2015 season where everything came together statistically despite a very good — not great — performance.
2016 Matt Ryan, Atlanta Falcons
Passer Rating: 117.1 (1st)
ANY/A: 9.03 (1st)
TD%: 7.1% (1st)
PFF Pass Grade: 90.3 (2nd)
The 2016 Falcons had one of the best offenses of all time, and Ryan was fantastic, but his numbers were in a different stratosphere from a performance standpoint. He was the No. 2 graded quarterback that season and played extremely well, but his pairing with Kyle Shanahan and a bevy of versatile playmakers is what put his stats over the top. Ryan also had just a 46.0 PFF grade on 40 dropbacks that didn’t count against his stats, as these plays were either negated by penalty or two-point conversion attempts — most notably a “pick-2” that cost the Falcons a game against the Chiefs.
2014 Tony Romo, Dallas Cowboys
Passer Rating: 113.2 (1st)
ANY/A: 8.11 (2nd)
TD%: 7.8% (1st)
PFF Pass Grade: 82.6 (6th)
This was another season in which the quarterback played well, but the statistical result screamed “best in the league” instead of “very good.” Romo had a strong 2014, but he had a mediocre 1.1:1 ratio of big-time throws to turnover-worthy plays, and his 10 dropped interceptions tied for eighth in the league.
2018 Mitchell Trubisky, Chicago Bears
Passer Rating: 95.4 (16th)
ANY/A: 6.59 (16th)
TD%: 5.5% (12th)
PFF Pass Grade: 56.5 (35th)
The Bears put together a magical 2018 season, pairing the league’s best defense with an efficient offense. Outside of two excellent games, Trubisky was well-below average as a passer and his stats were inflated by a well-executed screen game and strong work at the catch point by his receivers. The 2019 version of a Trubisky was not that far off from 2018 on a throw-for-throw basis, but the passing stats were far different, showing just how lucky he was in 2018.
Final Word
The PFF grading system provides valuable context that is both descriptive and predictive. Using the predictive parts of the database, we can review past showings that highlight outliers regarding both performance and statistical production. The real value is using the proper data to better predict future performance, and when it comes to the passing game, PFF’s throw-by-throw grading system is the best at isolating the quarterback and identifying future performance.