From a fan's point of view, few things are more frustrating than watching your own team giving up on a third-and-long, whether it's by seeing them call a wide receiver screen that has almost no chance of getting the needed yardage or by having the quarterback check it down to get his running back tackled instead of giving his wide receiver a chance to make a play down the field.
In the past, offenses or quarterbacks who tended to do this a lot have been identified by simple metrics like Football Outsiders' ALEX — a metric that measures air yards relative to the first down marker — or by the percentage of throws short of the sticks, which is a metric that simply counts how often a quarterback doesn't throw the ball beyond the first down marker and instead relies on his pass-catcher to gain the necessary yards after the catch.
[Editor’s Note: PFF’s advanced statistics and player grades are powered by AWS machine learning capabilities.]
According to those metrics, quarterbacks like Teddy Bridgewater, Joe Flacco, Jimmy Garoppolo, Jacoby Brissett and Tom Brady were the most conservative passers on third down in 2019. Conversely, Ryan Fitzpatrick, Aaron Rodgers, Russell Wilson, Jameis Winston and Dak Prescott were among the most aggressive quarterbacks.
While these metrics certainly seem to separate the most aggressive from the most conservative passers in accordance with the eye test, there are some obvious blind spots. Naturally, there is a huge difference between throwing for zero and throwing for nine air yards on third-and-10, but counting throws short of the sticks will not differentiate these two scenarios. The ALEX metric sure does, but it misses other information like the actual targeted route or the defensive play call.
Not all short throws are created equal
In other words, these metrics are missing additional context, which is a frequent criticism of analytics-based football analysis. Of course, when these metrics were first conceived roughly a decade ago (systematically charting air yards wasn't a thing for the NFL until late into the first decade of the 2000s), the necessary context simply wasn't available.
Enter our game-charters at PFF, who have charted every bit of information on each NFL play since 2006 and allow us to add the missing context.
We trained a model that considers all the context and predicts the percentage that a given route run yields a first down under the condition that the receiver is targeted and catches the ball.
Why the second condition, you ask? Why are we assuming the ball is caught? Well, we want to extend the two metrics above and want to describe the intent and not the performance of a quarterback.
When a quarterback has a high ALEX rating (i.e., he throws beyond the sticks often on third down), this means his throws would have a lot of value under the condition they are caught. If we want to describe performance, we can obviously just use metrics like first down rate, expected points added per dropback, or our very own PFF passing grade.
Why are we measuring intent to begin with? Shouldn't we be much more concerned about performance? Of course, performance is the most important indicator of a player or a team, but performance (especially in a reduced sample like third down) is often noisy. Intent or usage, however, is often much more stable, as it doesn't underlie natural variance as much as performance does. And as my colleague Eric Eager has shown, intent can carry a lot of signal for performance.
As an example, if you listened to us one year ago, you might have invested some money in Jameis Winston leading the league in passing yards in 2019, a prop bet that came with a lot of value by merely knowing that Jameis Winston and Bruce Arians both share their passionate intent for throwing deep. Without knowing anything about future performance — and one could argue he sure hit the lower tail end of his performance spectrum — we were able to find value here.
So, what is the additional context we accounted for, you ask, as we turn our attention back to our model?
The answer is pretty much anything one can think of. While ALEX (which, in our case, is the difference between the route depth and the number of yards to go) is still the most important feature for training the model, there are a lot of other factors that influence whether a possible catch will result in a first down.
The first is the offensive and defensive playcall and things like the alignments, the routes run, the coverage scheme and the number of pass-rushers.
Secondly, we see that situational factors — like down, distance and field position — also move the needle. It is particularly noteworthy that the distance (yards to go) plays an additional role even after accounting for the difference between pass depth and yards to go: On third down, catches 7 yards deep with 10 yards to go gained a first down 56% of the time, while catches at the line of scrimmage with 3 yards to go gained a first down 67% of the time.
Another interesting feature of the model is that it is using the route depth and route type, but not the actual pass depth (which is, of course, almost entirely explained by route depth and route type). If only looking at targeted routes, there would be no reason to not use the pass depth, but not using it allows us to apply the model to non-targeted routes. In particular, we can look at how often receivers run their routes past the sticks (without the hard cutoff of a binary classification) and also look at the quarterback's targets beyond the sticks relative to what we would expect based on the routes of his receivers.
Overall, the model is doing a pretty good job of estimating the likelihood of a catch resulting in a first down, as the following calibration of the test data set illustrates.
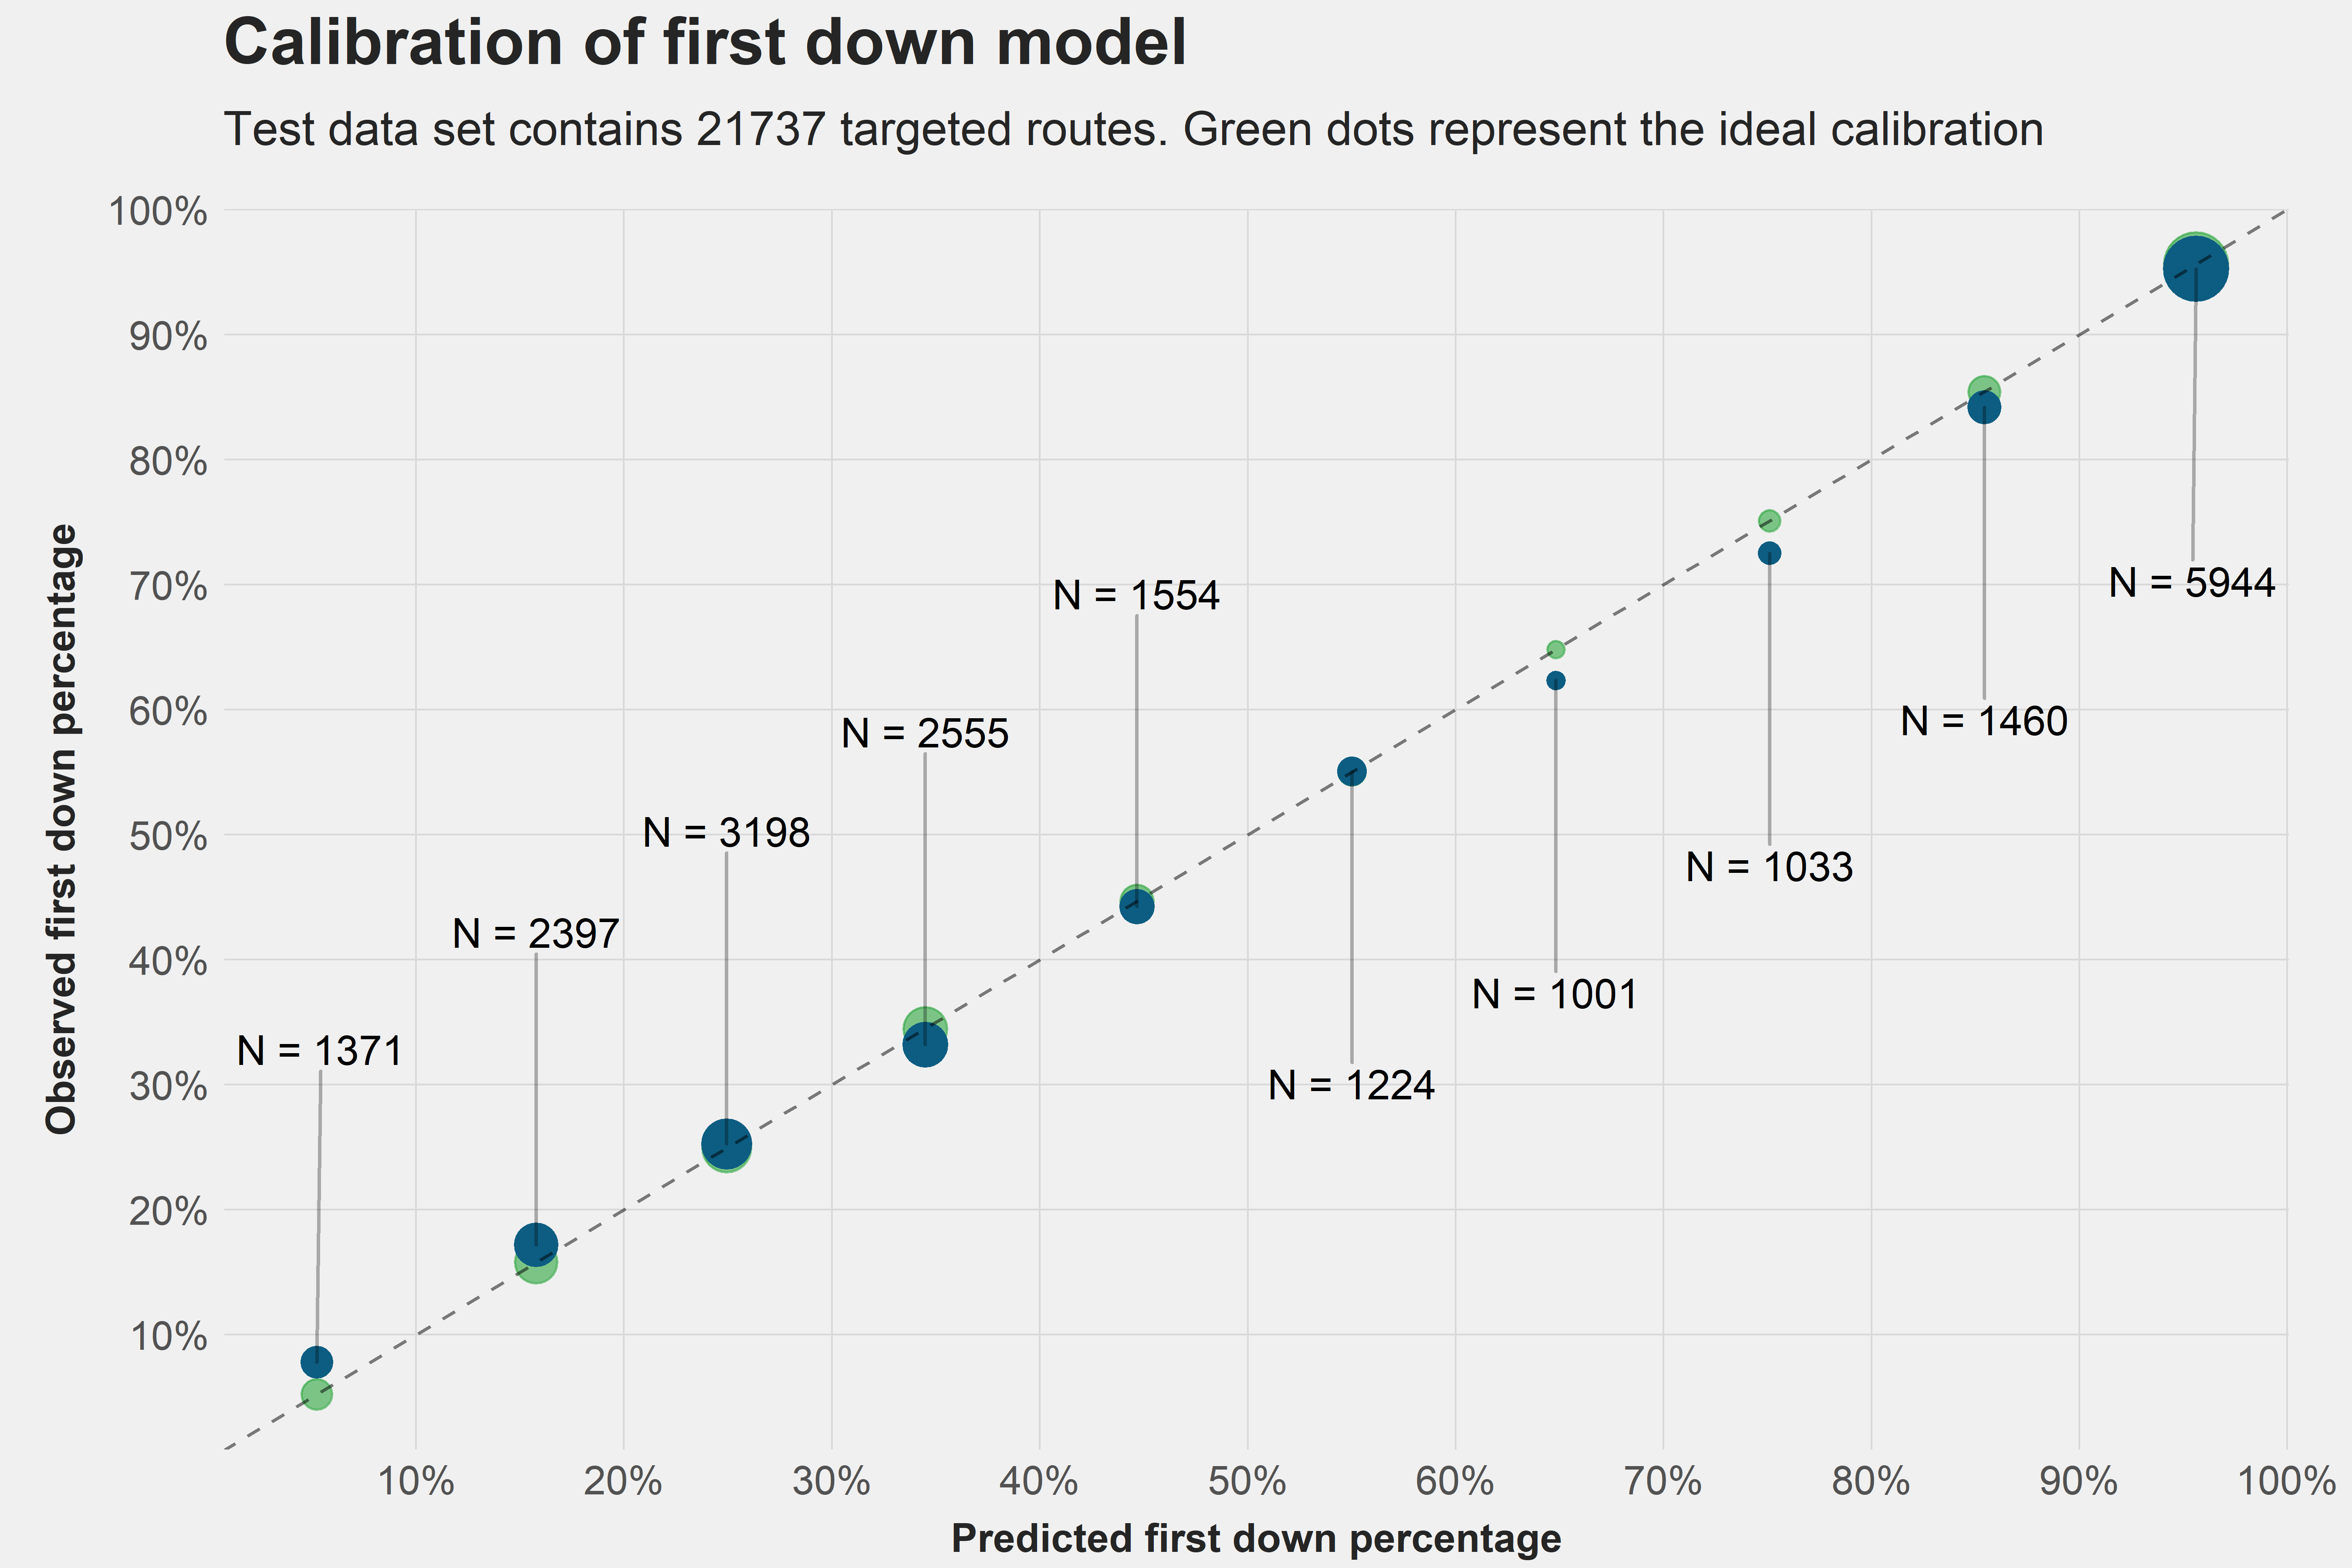
For example, catches that the model expected to yield a first down between 20% and 30% of the time also yielded first downs at this rate. As indicated by the size of the dots, we note that most catches have either a very high chance of yielding a first down (these are, of course, mostly throws beyond or very close to the line to gain) or a fairly low chance. Only 29% of all catches in our test data set have a first down probability between 40% and 90%.
To see the model in action, we consider two plays that look the same on the surface when using metrics that don't account for additional context. These plays, however, are both very different.
On this play, the Oakland Raiders faced a third-and-5 on their own 27, and the Atlanta Falcons chose to rush only four and sit back in zone coverage, ready to converge on any target short of the sticks.
In what has become fairly typical, Derek Carr chose to check it down from a clean pocket, threw the ball exactly to the line of scrimmage and dragged his tight end into a problematic situation as multiple defenders approached for the tackle.
Clive Walford might have had a small chance to gain a first down here, but after slipping, his play was all but over. Since NFL pass-catchers are generally very good athletes and defenders might not react fast enough when sitting back (especially when they play a QB they think will go deep), the model still gave this catch a 45% chance to yield a first down (note that that's lower than 50%, so the classification ends up being correct on this play).
In the following play, the Dallas Cowboys found themselves in a very similar situation, as they faced third-and-5 from their own 30. And just as Derek Carr did, Dak Prescott ended up throwing the ball to the line of scrimmage.
However, these plays are fundamentally different, as the Baltimore Ravens were lined up in man coverage in Cover 1 and elected to bring pressure with six pass-rushers.
DOMINATE FANTASY FOOTBALL & BETTING WITH AI-POWERED DATA & TOOLS TRUSTED BY ALL 32
 Unlimited Fantasy League Sync
Fantasy Start/Sit Line-Up Optimizer & Waiver Wire
WR-CB & OL-DL Matchups, PFF Player Grades, & Premium Stats 2.0 Tools
Nathan Jahnkes Rankings - #1 Most Accurate Last 70 Weeks
PFF Best Bets, Player Props, & Power Ranking Tools
NFL Mock Draft Sim with Trades & Draft Grades
Unlimited Fantasy League Sync
Fantasy Start/Sit Line-Up Optimizer & Waiver Wire
WR-CB & OL-DL Matchups, PFF Player Grades, & Premium Stats 2.0 Tools
Nathan Jahnkes Rankings - #1 Most Accurate Last 70 Weeks
PFF Best Bets, Player Props, & Power Ranking Tools
NFL Mock Draft Sim with Trades & Draft Grades
Already have a subscription? Log In